
Chapter 6. Building Business Data Dashboards
In this chapter, you will:
Learn how business data dashboards can have a positive effect on your organization
Discover how to build a dashboard within SharePoint 2010
Explore the Business Data Web Parts, their uses, and how to configure them to present business data in an effective way
Explore other Web Parts you can use to add the finishing touches to your business data dashboard
When you hear the word dashboard, you probably think of the everyday physical object in your car. To drive a car safely and to avoid mechanical breakdowns, you need the easily viewable information about the car’s state and functioning that the dashboard provides. When you drive a car, you are constantly monitoring live data made available to you through the dashboard. Often the data is read-only, but it lets you know on an ongoing basis what is going on with the car: how much gas is in the gas tank so you know when to refuel, how fast the car is traveling so you can keep within the speed limits, and how many revolutions the engine is making per minute. In the past, many cars did not provide this much information, so perhaps it is not critical but nice to know. Important information from the dashboard includes warnings: the engine is overheating, the car is running out of gas, or a passenger is not wearing a seatbelt. This information is made visible to you through warning lights (and sometimes through sound) to grab your attention. Figure 6-1 shows an example of a car dashboard.
Imagine if your car didn’t have a dashboard and you had to rely on monthly or weekly reports about the car instead. These reports might provide information like the car’s average speed over the entire period or how many times the car ran out of gas. At least you would know if you had to schedule repairs for your car because it overheated on day 4 of the month. You might receive an attachment about the state of your car in a spreadsheet that you later find was duplicated, and you are not sure which is the correct version.
Many businesses rely on information provided to them in a weekly or monthly report. These reports are out of date the moment they are printed or sent via email, and by the time you receive them, it is too late to react constructively. It would be absurd to receive information about your car’s operation in this way, but this is exactly how some business organizations operate. For instance, learning that you ran out of stock of your biggest-selling product three weeks ago isn’t useful information. But being warned that you will likely run out of stock of that product next week is useful, just as seeing that your car’s fuel gauge is getting close to the 0 mark is useful in letting you know that the car will run out of fuel soon—you are able to react to the situation before it becomes a crisis.

It wouldn’t be practical to email the dealership while you are driving your car and ask for an up-to-date status report every time you wanted to know the tire pressure or the engine’s water level, yet this is what happens within businesses. Information workers are constantly being emailed for status updates, because the requestors may not understand how to obtain the information themselves. Perhaps they haven’t had training on systems such as Microsoft Dynamics CRM, or they simply don’t have time to look for the information and therefore delegate it to someone else in the organization.
Dashboards showing critical business information can be extremely powerful for an organization. They can help warn about cash-flow issues, stock levels, or targets not being met. Just like a dashboard in a car, you only need to glance at a business data dashboard to check the status of various types of business information.
Dashboards can also be used for a variety of other business reasons. Often in businesses, some roles or departments are not recognized as contributing to an organization’s success. For example, the IT help desk responds to the needs of information workers, but because the IT help desk is not involved directly with selling or building something to sell, it is often considered a source of overhead expense. Using a dashboard, you can promote how well the IT help desk is performing and how much money the company has saved due to the efficiencies of the IT help desk. This dashboard could contain key performance indicators (KPIs) showing the number of calls successfully answered within the service-level agreement, how long the servers have been running without interruption, and how many employees considered their call to the help desk successful.
In this chapter, you will learn how to build Microsoft SharePoint dashboards and present external business data in a way that is useful to your business using the Business Data Web Parts, SharePoint Designer 2010 to customize those Web Parts, and other Web Parts such as the Microsoft Chart Web Part.
Building SharePoint 2010 Dashboards
In this section, you will learn how to build a SharePoint dashboard, what SharePoint provides for out-of-the-box functionality, and how can you use Business Connectivity Services (BCS) and the Business Data Web Parts to provide valuable information.
In its basic form, a dashboard in SharePoint is just a SharePoint page, whether you use a simple Web Part page stored within the Site Pages Library in a team site, a Web Part page created from a Reports Library, or a PerformancePoint dashboard. In any of these cases, the dashboard consists of Web Parts that display useful information that can be read easily. As dashboards consist of only Web Parts, you will usually create a Web Part page, rather than a wiki or a publishing page.
Designing a Dashboard
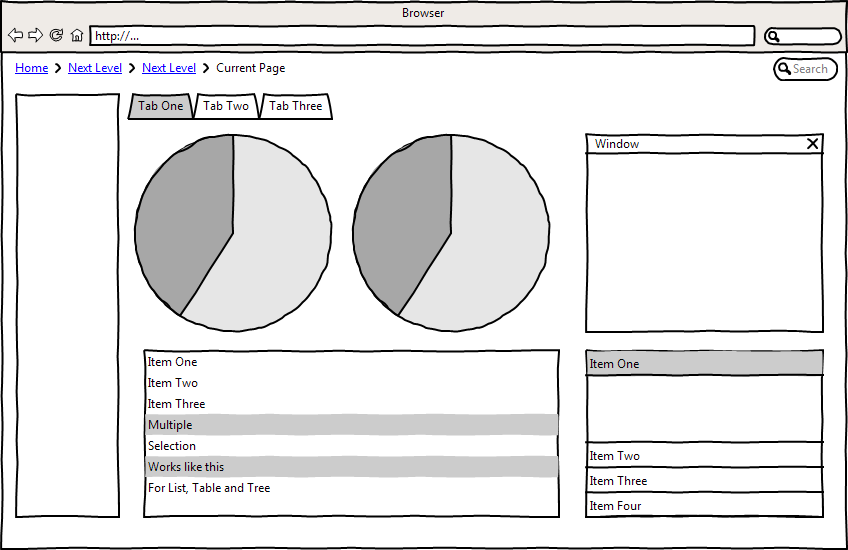
Before you create a dashboard, plan the layout first so you end up with a more effective dashboard. If you don’t plan well first, you might run out of space, or the Web Parts won’t quite fill the width of the Web Part zone. Before you create the dashboard, consider designing a wireframe, also known as a page schematic or blueprint, showing the layout of the dashboard, as shown in Figure 6-2. Using the wireframe, you can gather the business requirements and obtain approval for the dashboard from the business users who will be using it. You can also decide which Web Part Page template to use to create your dashboard page.
A wireframe consists of a drawing displaying the layout of the navigation, breadcrumbs, charts, Web Parts, and Web Part zones. You may want to provide the wireframe design to a designer capable of providing a custom layout within SharePoint, so that you can add Web Parts required by the business to the layout.
Creating a wireframe enables you to design a SharePoint Web Part page with Web Part zones that fit well with the Web Parts displaying the business-critical information. Microsoft Visio is a great tool to use to design the wireframe, as it provides a number of graphic stencils for wireframe creation. Other useful wireframe creation tools are available from websites such as www.wireframe.com.
PerformancePoint Dashboards
The Enterprise edition of SharePoint Server 2010 includes PerformancePoint Service (PPS), which allows you to analyze data in SharePoint through the use of dashboards, scorecards, reports, and key performance indicator Key Performance Indicators (KPIs). PPS is a service application that requires configuration.
Note
See Also For more information on service applications, see Chapter 3.
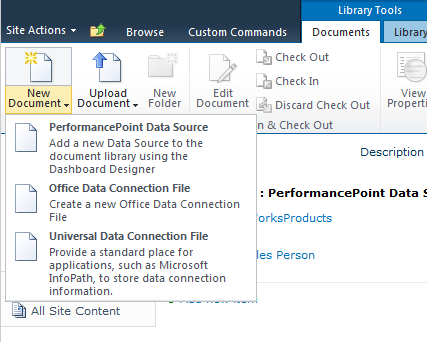
Once you have configured the PPS service application, you can create a Business Intelligence Center, a special type of SharePoint site containing libraries for storing dashboards, data connections, and content. You can configure connections to SharePoint lists, SQL Server Analysis Services, SQL tables, and Excel Services. Upon creating a Business Intelligence Center site, you can launch a client application called PerformancePoint Dashboard Designer from the Data Connection Library. Figure 6-3 shows how to create a new PerformancePoint data source connection, which will open the PerformancePoint Dashboard Designer.
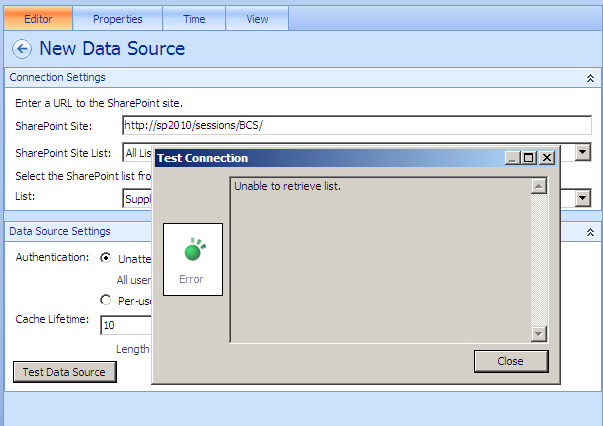
The PerformancePoint Dashboard Designer enables you to build very advanced dashboards. Although you can connect SQL tables as a data connection in a PerformancePoint dashboard, you cannot select an external content type (ECT) as a data source for your connection. It stands to reason that since you can create an external list from an ECT, and external lists act like SharePoint lists, that you can configure as data connections in PerformancePoint, you can configure an external list as a data connection in PerformancePoint. If you try this, however, you will receive an error message, since the data itself doesn’t actually reside within SharePoint. Figure 6-4 shows that PerformancePoint can’t be used to connect to external lists.
Note
See Also You can find more information about PerformancePoint at http://technet.microsoft.com/en-us/library/ee661741.aspx.
Using PerformancePoint isn’t the only way to create dashboards in SharePoint. Whether you use SharePoint Foundation 2010 or SharePoint Server 2010, you can easily create dashboards that display external data.
Using a Report Library to Create Dashboards
You can create a Web Part page using your browser or SharePoint Designer, and then add Web Parts to the page to create your dashboard. If you have the Enterprise edition of SharePoint Server, you can use a report library to create dashboards. Pages created in a report library already contain Excel Services Web Parts and KPI Web Parts, which you would otherwise need to add manually to a page. These Web Parts are useful on a dashboard, and many organizations use them on their webpages.
Note
The Reports Library template, Excel Services Web Parts, and KPI Web Parts are available only if you have the Enterprise edition of SharePoint Server 2010, and you have activated at the site level and site collection level the SharePoint Server Enterprise Site Features.
You can create a report library using the following steps:
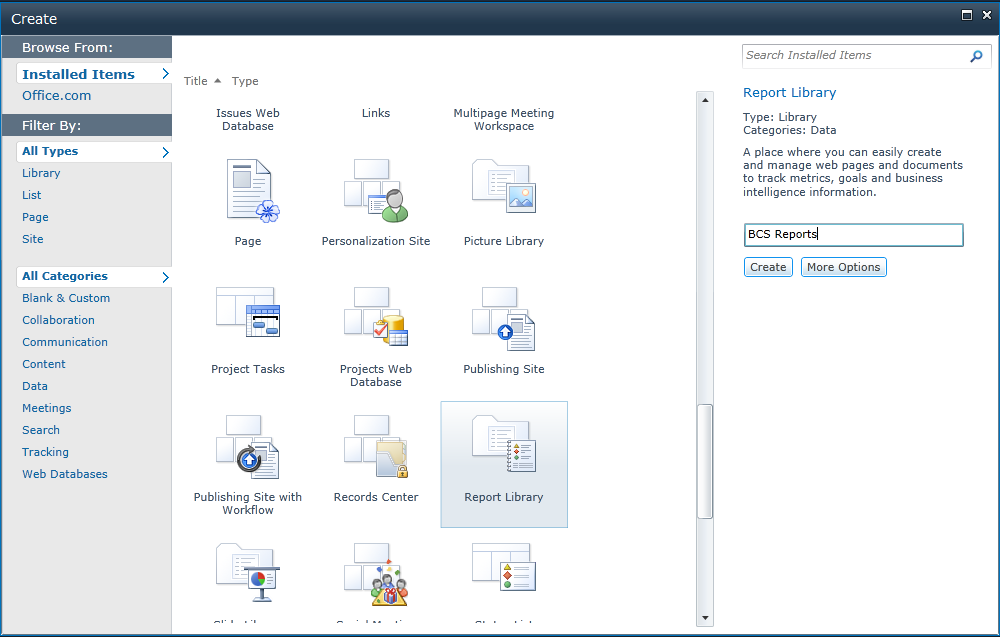
Click Site Actions, and then click More Options to display the Create dialog box, where the list and library templates are displayed, as shown in Figure 6-5.
In the middle section of the Create dialog box, select the Report Library template, and in the Report Library section, type a name for the library.
Click Create to create your library.
To create a dashboard, click the Documents tab on the ribbon, under Library Tools, and then in the New group, click New Document, and then click Web Part Page With Status List.
Note
The default content type associated with a report library is Report. When you click the New Document icon in the New group, you create a report that is an Excel spreadsheet. The default view of a report library is filtered to display only reports. To display both reports and dashboards on the Library tab, select All Reports and Dashboards or Dashboards.
In the Page Name section, type the name of the Web Part page—for example, Sales Dashboard—and a title and description.
Leave the default options selected on this page. Notice that the option selected in the Status Indicators section will create a status indicator list for you. Alternatively, you could select one of the other options and create the list manually at a later time. The name of the status list automatically created for you is <Web Part page name> Status Indicator Definitions.
Click OK to create the Web Part page. The newly created page will display in your browser, as shown in Figure 6-6.
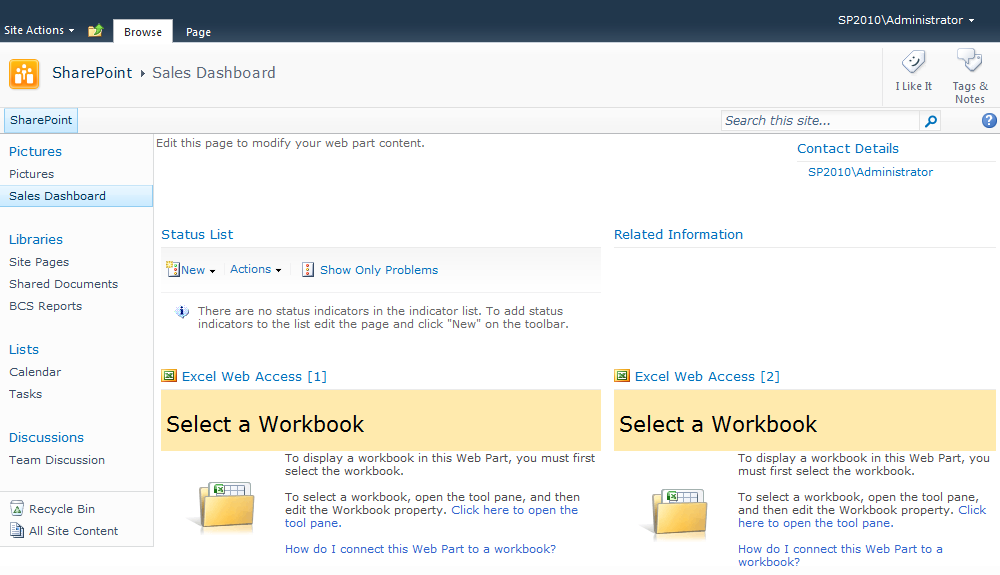
The report dashboard consists of two Excel Web Access Web Parts, a List Web Part that displays the contents of the status list, an Apply Filters Button Web Part, a Related Information Summary Links Web Part, a Summary Web Part, and a Contact Details Web Part. Notice that no Business Data Web Parts are used to display data stored in external systems; this is the subject of the next section. The Excel Web Access Web Part and status list are explained later in this chapter.
Exploring the Business Data Web Parts
You can add any Web Part to your dashboard pages. In the Enterprise edition of SharePoint Server 2010, you can add Business Data Web Parts to simplify the creation of dashboards. If you have the Enterprise version of SharePoint Server 2010, and you want to build a good dashboard that presents external business data information, you will most likely use the Business Data Web Parts.
When you add a Web Part to your page, you will notice a Web Part category called Business Data. Not all the Web Parts listed within this category are directly related to Business Connectivity Services (BCS), but this section explains each of these Web Parts, starting with the Business Data List Web Part, because they are all useful when building a dashboard.
Note
The examples in this section use the Adventure Works database, which you can download from http://sqlserversamples.codeplex.com. To use the Business Data Web Parts, first create an external content type (ECT). The process to do so is detailed in Chapter 4.
Business Data List Web Part
You can use the Business Data List Web Part to display multiple rows of data from an external source, and you can easily configure it using the Web Parts properties. While you can further modify this Web Part within SharePoint Designer 2010, you can configure it using the browser to a stage where it displays data. Using the Edit View option within the Web Part, you can configure the order of the columns, filters, sorting, pagination, and item limits.
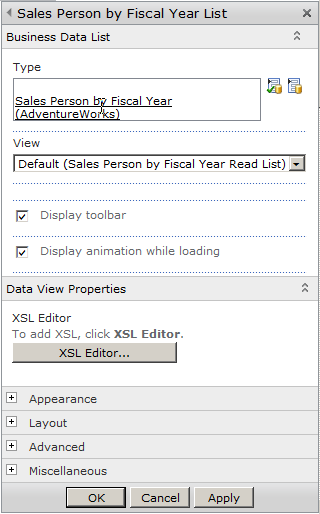
Upon adding the Business Data List Web Part to your page, click the down arrow to the far right of the Web Part title and then click Edit Web Part to open the Business Data List tool pane. You use the Business Data List tool pane to configure the Type property to select the external system where the data you want to present is stored. The Type property is referring to the ECT.
The lookup icon allows you to display the list of available ECTs. The list of ECTs is security trimmed, so it is possible that even though you can view external data within another Business Data List Web Part, you may not have permission to configure the same external data yourself.
Once you have configured the Type property, at the bottom of the tool pane, click Apply. The data within the Web Part itself displays. Notice that the title of the Web Part has changed to match the title of the ECT, as shown in Figure 6-7.
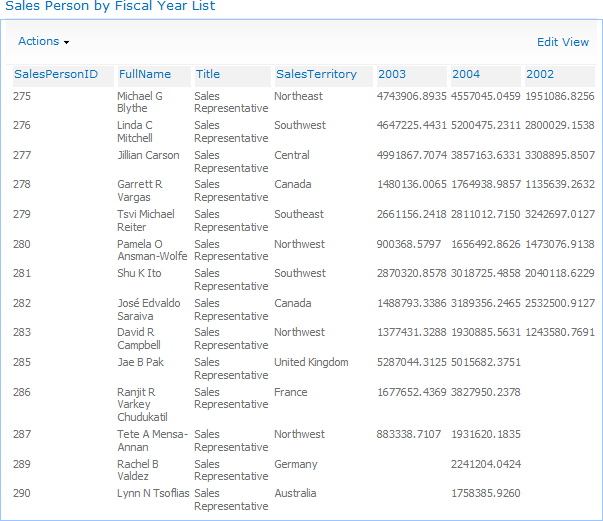
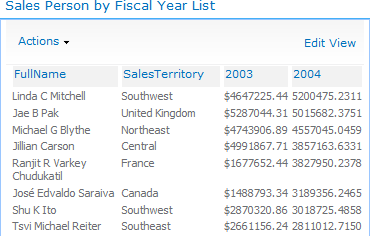
Other properties for Business Data List Web Part are explained later in this section. Figure 6-8 displays a Business Data List Web Part that is configured but not formatted.
Edit View
While the Web Part page is in Edit Page mode, the Business Data List Web Part contains an Edit View link in the top-right corner. Clicking Edit View allows you to configure some basic view options, such as sorting and filtering, as well as other options you cannot set through the browser. For example, the sales figures in Figure 6-8 are not displayed in currency format. In fact, it is strange that the sales figures are displayed to more than two decimal points. The Edit View option does not allow you to format values, but you can format values either when you create the ECT using Visual Studio or when you modify the view using SharePoint Designer.
The Edit View page is divided into six sections:
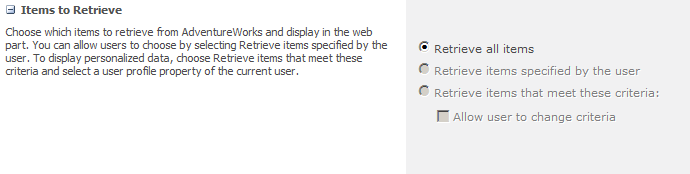
Items to Retrieve When you edit the view of your Business Data List Web Part in the browser, you will first notice that you can choose which items are displayed. This option is dependent upon creating filters when configuring the ECT. The default option is to retrieve all items from the external data source. However, when you create filter methods in the ECT, you can choose to allow the user to set the filter value or you can set a filter value yourself, which the user can modify if required. In Figure 6-9, these options are not available, since filter methods were not created in the ECT.
Item Limit When an external data source contains thousands of rows of data, you can use a filter method so that the ECT returns only a subset of the external data. You can also set the item limit for the ECT, which is especially useful when configuring a dashboard. For example, you may want to show only the top 10 performing sales representatives, instead of all 200 sales representatives.
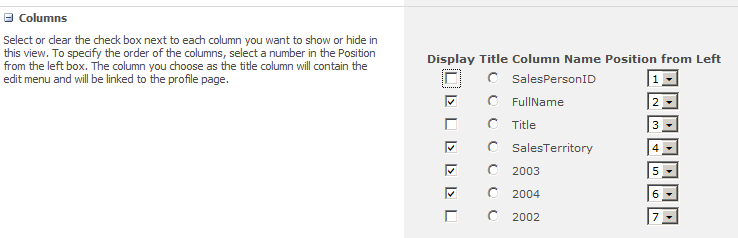
Columns This section allows you to select which columns you want to display, set the order of the columns from left to right, and set one of the columns as the Title column. The Title column displays a drop-down list when you hover over it and allows actions to be triggered against the item selected. For example, an action could be a search for a salesperson within the SharePoint search center. Figure 6-10 shows how you can figure the view of the Business Data List Web Part within the browser.
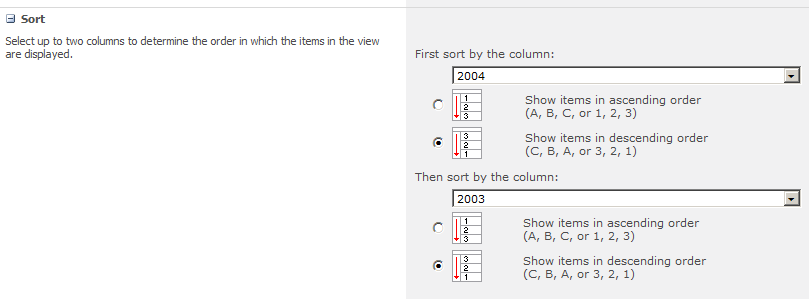
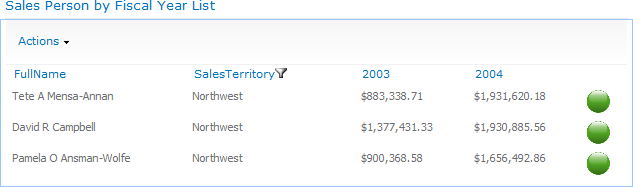
Sort This section allows you to sort by up to two columns in either ascending or descending order. For example, if you want to show the salesperson with the most overall sales for the past couple of years first, configure the view to show the most recent sales figures in descending order, and then sort by the previous year in descending order, as shown in Figure 6-11.
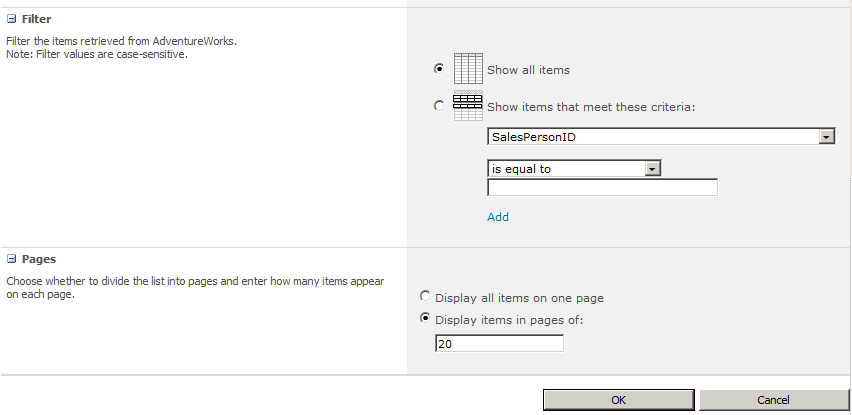
Filter Although you may have already configured filters when you created the ECT, it is possible to hard-code the filter values for the view of the Business Data List Web Part. When you set these filters, users cannot change them using the filter toolbar within the Business Data List Web Part.
Pages The final section is for pagination. Here you can simply set the number of items you want to display on each page, as shown in Figure 6-12.
Formatting Data
After you configure the view of the Web Part, the data is presented close to your requirements, but the lack of formatting may annoy users. You can address this issue by modifying the XSL of the Web Part.
Note
The Extensible Stylesheet Language (XSL) family of languages, including Extensible Stylesheet Language for Transformations (XSLT), is coding language for styling Extensible Markup Language (XML). XSLT provides similar results to that of a Cascading Style Sheet (CSS) file for HTML. You can use XSL within most SharePoint Web Parts to provide styling, branding, positioning, and general look-and-feel customizations to present the contents of the Web Part. You can also embed JavaScript in many cases within the XSL to provide custom functionality.
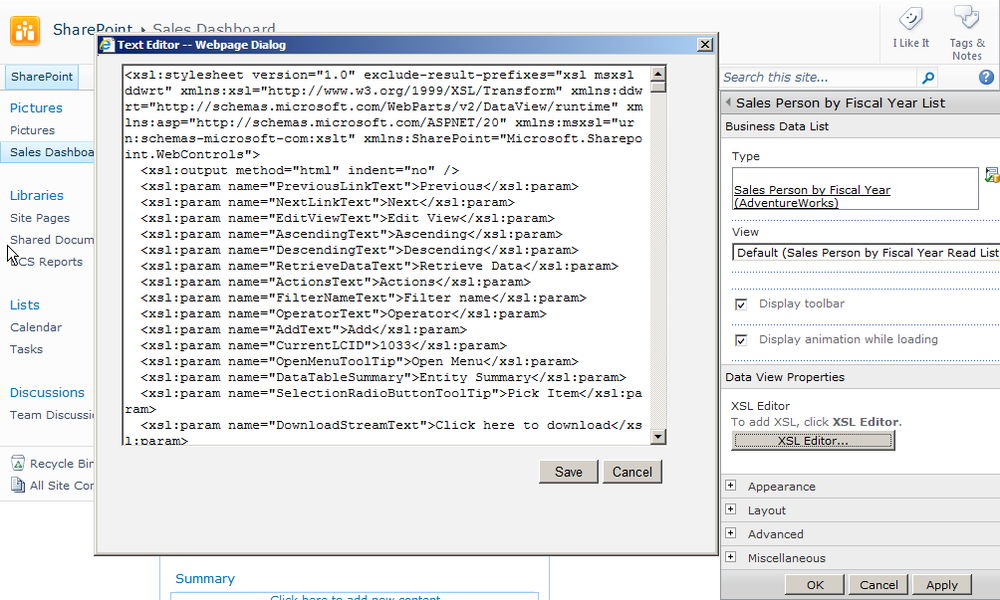
In the Business Data List Web Part tool pane, you can find the XSL Editor button in the Data View Properties section. When you click the button, a Text Editor – Webpage Dialog box appears, with the XSLT equivalent of the setting you configured in the Edit View page. The dialog box does not offer a good user experience for modifying XSL. However, you can copy and paste the XSL into SharePoint Designer 2010 or Visual Studio and use these tools to amend the code. It is certainly recommended that you back up the XSLT code before making any changes. Figure 6-13 shows the XSL editor built into the Web Part.
If you used the Business Data List Web Part to display data from the Adventure Works database, then your currency column displays more than two decimal places. Using Visual Studio, locate the XSLT code that contains the column name. In the example for this book, the 2003 sales data has a column name of @_x0032x003, and the XSLT code is as follows:
<xsl:value-of select="@_x0032_003/>
To format the sales data to two decimal places, the code should be:
<xsl:value-of select="format-number(@_x0032_003, '$###0.00')" />
Copy the XSLT back into the Text Editor – Webpage Dialog box for the Business Data List Web Part, which results in the 2003 column being formatted as shown in Figure 6-14.
If you are changing the XSLT, make sure to keep a copy of your modified XSLT. When you use the Edit View menu and make even subtle changes, the XSLT for the Web Part is regenerated and will wipe out any changes you made manually using the XSL Editor dialog box. If you add another column to the Web Part, such as the 2002 column, again you will lose the formatting on the 2003 column. It is good practice to store your XSLT in a separate file, upload that file to a document library, and then type the URL of the file in the XSL Link text box in the Miscellaneous section of the Business Data List Web Part tool pane.
Visual Studio does not provide a WYSIWYG experience when editing SharePoint data, so you need some understanding of XSL to format the business data. SharePoint Designer does have a WYSIWYG design view, though, so you can use SharePoint Designer to achieve some formatting changes without writing any XSL.
Using SharePoint Designer to Format Data
SharePoint Designer 2010 is an excellent tool for editing the Business Data Web Parts. You can use it to apply conditional formatting and implement KPIs. To modify the Web Part in SharePoint Designer 2010, follow these steps:
Click Site Actions and then click Edit in SharePoint Designer.
You can view all the files, reports, and dashboards stored in the report library by clicking All Files in the Navigation pane. When you select your dashboard, the Settings page appears.
In the Customization area, click Edit File to open the page in normal edit mode.
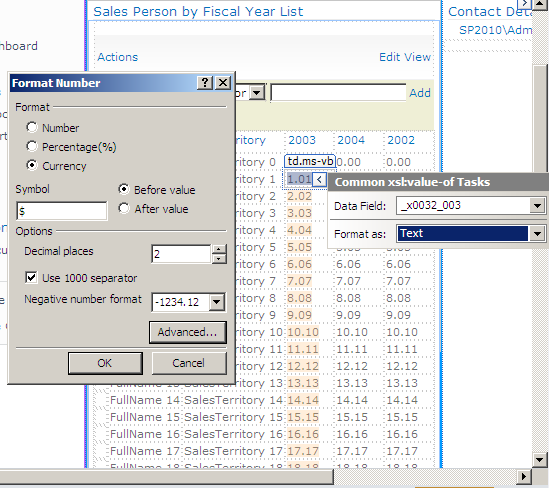
The Business Data List Web Part displays with sample data and the filter toolbar. From here, you can use the Common xsl:value-of Tasks dialog box to amend the number format, as shown in Figure 6-15.
In addition to formatting the columns, you can insert three images in place of the sales values for 2002. The images will be traffic light indicators—red, yellow, and green—which you will configure to display based upon conditional formatting.
Prior to formatting the page, upload the three traffic light images into a document library. In SharePoint 2010, a good place to upload images that represent data and are not uploaded by team members is the Site Assets Library, if you are on a team site. You can then use the Insert tab to insert the three traffic light images into a single row.
Alternatively, you can copy and paste the three traffic light images into a single row. SharePoint Designer then automatically displays a copy of the images in each row. Within a single row, click one of the traffic light images—for example, the green image—and then on the Options tab in the Data View Tools tab set, click Conditional Formatting, and then click Show Content. The Conditional Criteria dialog box appears, where you can set the conditional formatting to show the image only if a certain condition is met. For example, when the value in the 2004 sales column is greater than the value in the 2003 sales column, the green traffic light indicator displays. You can then repeat this procedure for the red image, and set the condition that when the 2004 sales column is less than 2003 sales, the red traffic light indicator displays. In addition to displaying images, you can apply formatting changes to the font or to the background color of each row. Figure 6-16 illustrates adding the images and applying conditional formatting to show the graphics.
You can implement many other formatting changes using SharePoint Designer. For example, you can display alternate rows with different background colors and change the page font to your organization’s official font. SharePoint Designer is a great place to experiment, as long as you are in a development environment. If you do not have a development environment, then experiment in a separate site collection, and if that is not possible, create a separate page on the production site.
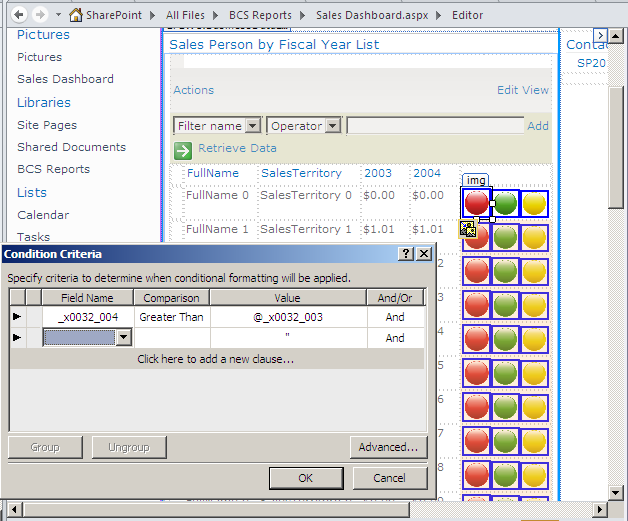
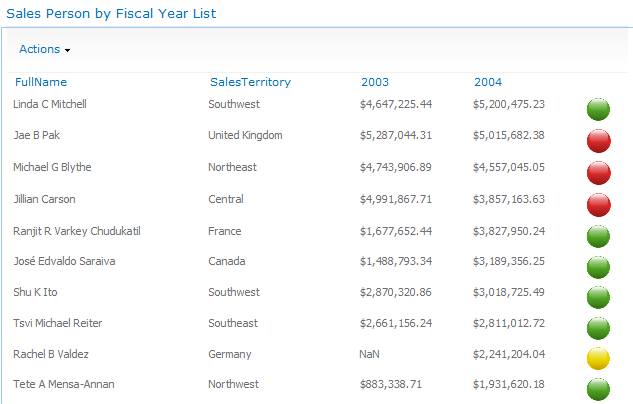
Figure 6-17 shows the Business Data List Web Part within the browser once you save the changes you made using SharePoint Designer.
Now that this Web Part is on the dashboard page, users can modify the filters themselves to select the information they want to see. For example, a user may want to show only the salespeople within a specific region, as shown in Figure 6-18.
The Business Data List Web Part is useful when you require a read-only view of the business data. It enables you to format, filter, and sort the data easily through either the Edit View option or SharePoint Designer customization.
Business Data Item and Business Data Item Builder Web Parts
The Business Data Item Web Part was designed to show read-only data. This Web Part, unlike the Business Data List Web Part, shows just one row at a time.
You can configure the Business Data Item Web Part to display a specific row in columnar format by providing it a unique value within a column marked as the identifier. For example, using the Adventure Works database, you may provide this Web Part a value of 11001, which is the identifier for Eugene Huang within the Sales.vIndividualCustomer table. You do not want to continue reconfiguring the Web Part each time you want to view a different customer’s details, so you will likely use this Web Part to dynamically provide the row that you are looking for. The identifier value can be passed to the Business Data Item Web Part via a Web Part connection. You can connect the Business Data Item Web Part to a Business Data List Web Part, or from any other Business Data Web Part, including the Business Data Item Builder. The Business Data Item Builder Web Part takes a value from the URL parameter and passes it to the consuming Business Data Item Web Part, allowing you to open detailed information on another page, in the same way the profile page works for business data.
The Business Data Item Web Part shows detailed information for one particular row. Displaying a number of rows, such as CustomerName, Address, Address2, Town, City, State, Zip, Phone, Fax, and Contact Name, in a Business Data List Web Part uses too much real estate on the page. To overcome the space limitations, you can display just CustomerName and City. Then when the user clicks CustomerName, the other columns appear within the Business Data Item Web Part, as shown in Figure 6-19, where the Business Data Item Web Part is connected to the Business Data List Web Part.
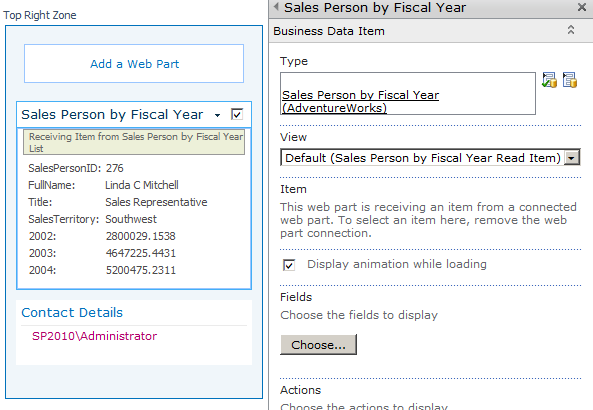
You can easily configure the properties for the Business Data Item Web Part. As with the Business Data List Web Part, you choose the ECT that you want to display. You can then optionally enter the identifier value for the item you want to display, as shown in Figure 6-20.
After you enter an ECT for the Business Data Item Web Part in the Type text box, click OK to close the tool pane. The page is now in edit mode, which allows you to configure the Business Data Item Web Part to consume a connection. You can set the connection either from the providing Web Part or from the consuming Web Part—the approach you choose doesn’t make any difference. Figure 6-21 shows how to configure the Web Part connection from the providing Business Data List Web Part.
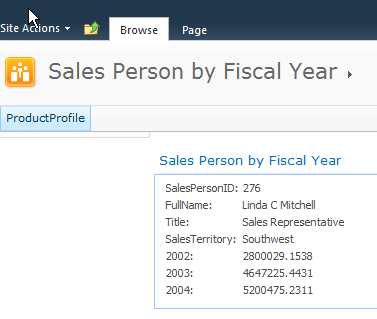
You also use the Business Data Item Web Part on a profile page, which you create either in SharePoint Designer 2010 or within the SharePoint Central Administration website in the ECT settings. The profile page displays when you click the search result or when the action is clicked from one of the BDC Web Parts. Typically when you search for a document or list item, clicking the hyperlink associated with the item results in the item opening. This cannot happen with external data, so the summary information is shown in the search results, but when the hyperlink is clicked, the identifier for the returned item is passed via the URL to the profile page for that ECT. The profile pages look a bit basic, but you can modify them through XSL or SharePoint Designer 2010. Figure 6-22 shows a default profile page with the Business Data Item Web Part.
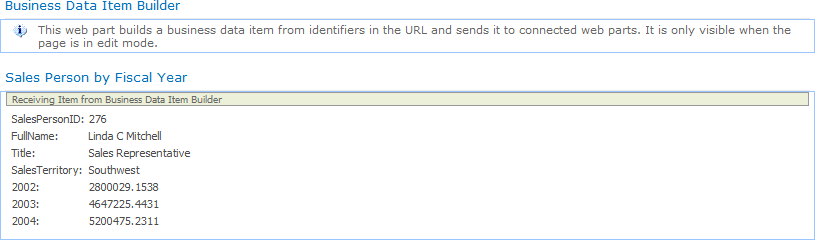
If you edit a profile page, you will notice that the normally hidden Business Data Item Builder Web Part is displayed. The purpose of the Business Data Item Builder Web Part is to take the parameter from the URL passed via the custom action or the search results page, and pass it via a Web Part connection to the Business Data Item Web Part (as shown in Figure 6-23).
You can also modify the Business Data Item Builder Web Part using XSL. Although you cannot modify the Web Part in SharePoint Designer 2010, you can modify the page itself.
Business Data Related List Web Part
The Business Data Related List Web Part is very similar to the Business Data List Web Part in that it displays multiple rows of data. However, it is designed to show data related to data displayed from another external content type (ECT). The ECT is related to the second ECT with an association, which you need to create when defining the ECT.
When you design a relational database, you will often join two or more tables using a primary key field in one table that points to a foreign key field in the second table. The table with the primary key is often referred to as the “one” side and the related table as the “many” side in a one-to-many relationship. An example of this type of relationship is that one customer can place many orders.
Note
See Also For more information on associations, see Chapter 4.
Once an association exists, you can use the Business Data List Web Part to display the data from the one side of the relationship (the providing ECT). You can then configure the Business Data Related List Web Part to show the content from the many side (the receiving ECT).
Within the Web Part properties of the Business Data Related List Web Part, after choosing the correct type, select the relationship that you want to use. It is possible to have more than one relationship—for example, customers may be related to orders as well as contacts.
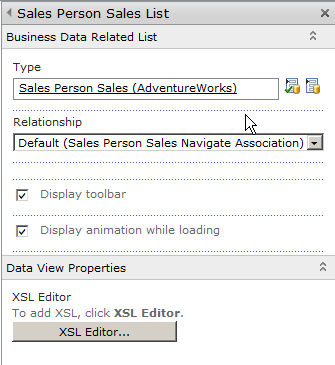
You can customize how you view the data in the same way as with the Business Data List Web Part. Figure 6-24 shows the configuration of the Business Data Related List Web Part.
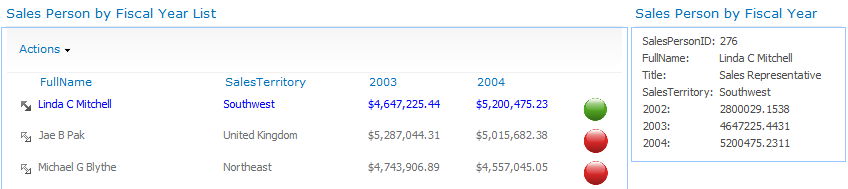
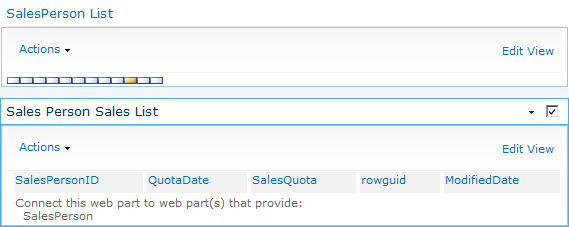
Once you set the Web Part properties and click OK, the Business Data Related List Web Part displays a message indicating that you must use Web Part connections to connect the two Web Parts. As with the Business Data Item Web Part, you can provide or consume the connection from either Web Part. Figure 6-25 shows the connected Business Data List and Related List Web Parts.
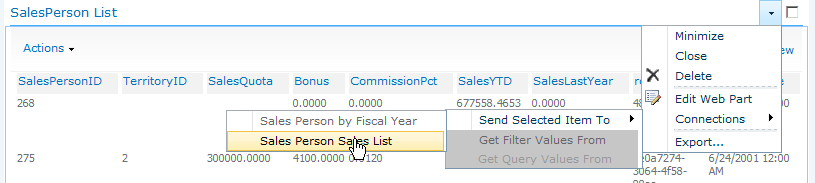
Once you’ve connected the Web Parts, an icon appears next to each row in the Business Data List Web Part. Clicking the icon fires the connection to the Related List Web Part, which in turn filters the results based on the provided value. Figure 6-26 shows how to configure the connection between the two Web Parts.
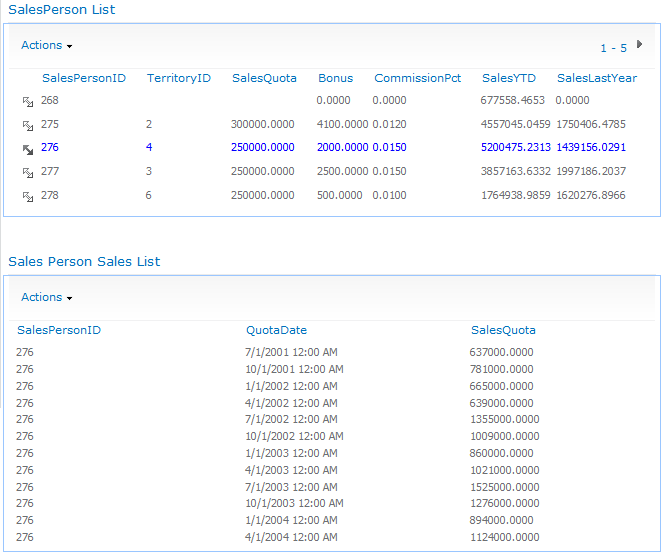
Once the connection has been created between the Business Data List and Business Data Related List Web Part, you are able to see the related items shown within the two Web Parts (see Figure 6-27).
It is worth noting that you can achieve similar functionality using standard Web Part connections in SharePoint Designer between two Data View Web Parts or two Business Data List Web Parts. Building the connection within SharePoint Designer offers some advantages, such as the ability to join Web Parts across two pages within the same team site and also build connections to filter data based upon two columns that are not strictly primary and foreign keys. SharePoint Designer has some limitations when building associations between ECTs, mainly around a table that contains a composite key. A composite key is where a unique row is identified by two columns as a combination and not one unique column. SharePoint Designer requires that each table use a single column as the unique identifier to build an association.
Business Data Connectivity Filter Web Part
The Business Data Connectivity Filter Web Part is especially useful when you build a dashboard that displays data from an external source. You may already be familiar with some of the other out-of-the-box filter Web Parts, such as the Current User Filter Web Part. You can add the Current User Filter Web Part to a page, and then connect to a List or Content Query Web Part to filter the results based on the current user. For example, you can only display tasks where the assigned-to user is equal to the logged-on user.
The Business Data Connectivity Filter Web Part works in a similar way. The idea is that you add the Business Connectivity Filter Web to the Web Part page and map it to a specific ECT. You then choose a Value column, such as Period, that stores the year’s quarter, such as Q1, Q2, Q3, or Q4. The value from the Period column is passed to other connected Business Data Connectivity Web Parts on the same page, allowing the user to select a period such as Q1 or Q2 and see all the data for the connected Web Parts for just that period. Using the Business Data Connectivity Filter Web Part becomes an easy way to filter all the data on the same Web Part page without requiring reconfiguration of the way the other Web Parts display the data. You select the value you want to pass to the connected Web Parts from a single dialog list that shows the data from the ECT.
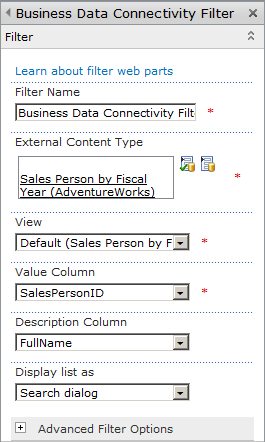
You can set the Filter Name, which is a value that populates the Web Part Connections menu, and then select the ECT that contains the data you want to use as the filter. Figure 6-28 shows the Web Part with a view of Sales Person by Fiscal Year. The Value Column is the column that, when selected, contains the value sent to the connected Web Parts, where it will be used to filter their contents. You can also select a Description Column. For example, SalesPersonID contains only unique numbers, and a user visiting the page would not know who the salesperson was by looking at the number, which is the employee ID. The FullName column stores the name of the salesperson, so if you select the Full-Name column in the Description Column drop-down list, the FullName value displays instead of the SalesPersonID. A user will then know the name of the salesperson the user wants to see information about, and when the user selects the FullName of that salesperson, the data from the value column, the SalesPersonID, is sent to the consuming Web Part.
The purpose of configuring the Web Part is to provide dashboard readers the ability to initially see the performance of all salespeople as a default, but then to enable users to select a particular salesperson to see that salesperson’s individual performance. The dashboard is then an interactive page, as the data is dynamically redisplayed depending on the interaction of a user with the page.
Now that you have configured the Web Part, check that you are able to select the required data before connecting the Web Part to other Web Parts on the page. Many of the Business Data Connectivity Filter Web Parts properties appear dimmed because they are unavailable to change once the Web Part is connected to others.
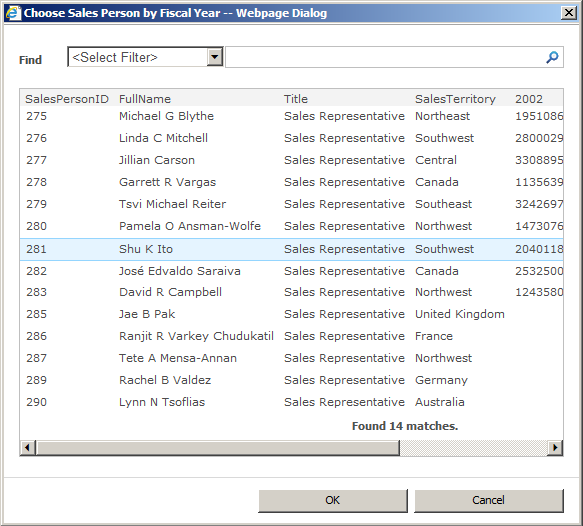
To test that the Search dialog box is returning data, click the Select External Item(s) icon (![]() ) within the Business Data Connectivity Filter Web Part.
) within the Business Data Connectivity Filter Web Part.
The Search dialog box appears, and you are able to select a row. You should then see the Description Column displaying a value within the Business Data Connectivity Filter Web Part, as shown in Figure 6-29.
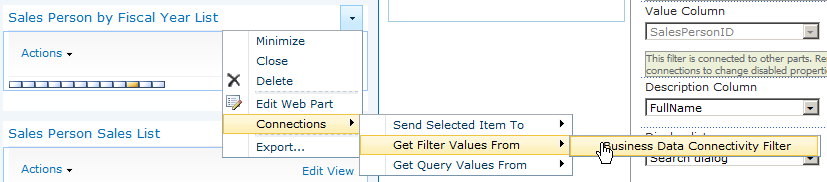
The final task is to connect the Business Data Connectivity Filter Web Part to other Web Parts on the same page. You can get strange results when configuring the connectivity from the Business Data Connectivity Web Part. A good practice is always to consume the connection from the Web Part that is to be filtered. That way, the behavior appears to be consistent.
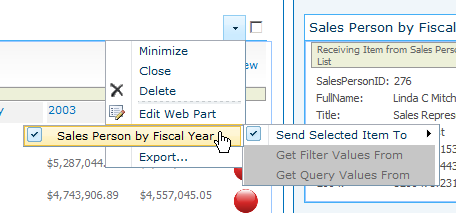
To consume the connection, edit the Web Part page and click the shortcut menu of the consuming Web Part. In this example, you are consuming the connection from a Business Data List Web Part. Figure 6-30 shows how to configure the Web Part to consume the connection. You can do this for each Web Part to be filtered, including those that are also providing a connection.
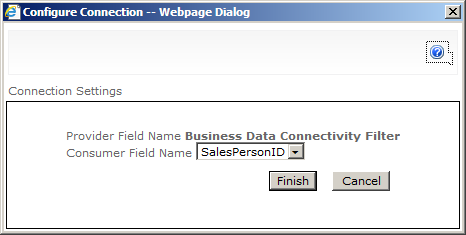
After configuring the connection, a dialog box appears that asks you to map the column that contains the filter value, such as SalesPersonID, which in turn matches the SalesPersonID value being sent from the Business Data Connectivity Filter Web Part, as shown in Figure 6-31.
The Business Data Connectivity Filter Web Part now filters the results within the connected Web Parts based upon the filter value selected.
Business Data Actions Web Part
Each ECT you create can have custom actions associated with it. The custom actions consist of a URL and a parameter, allowing an action to be run against a particular row. An example of an action is the View Profile link. If you create a profile page for an ECT, the View Profile link is automatically created as an action for the ECT. The profile page consists of a Business Data Item Web Part showing by default all the columns and values for a selected row. The row is selected when you trigger the custom action.
It is possible to create other custom actions. For example, consider a Customer ECT and how the user might get information they need about a customer, such as conducting an Internet search for more information about that customer. Opening a browser window, navigating to a search engine, and then typing the company name that you wish to search on is time-consuming. Using a custom action, you can search for the customer in a new browser window by configuring a custom action to pass through the Company Name column of the selected row of data. The user may search for the customer name using a website such as LinkedIn, Google, or Bing. These actions can be built using a URL. For example, the URL for a Bing search is similar to the following:
http://www.bing.com/search?q=Adventure+Works&qs=n&form=QBLH&filt=all&pq=adventure+works&sc=8-
15&sp=-1&sk=
This example is specifically searching for “Adventure Works.” But what if you don’t know yet which company name will be searched? In that instance, you don’t use specific words in the URL, but instead use parameters. The URL will look similar to the following:
www.bing.com/Search?{0}The {0} is a placeholder for the column value. When you create the custom action, you choose the column value, such as CompanyName, that will replace the {0} at runtime against the selected item.
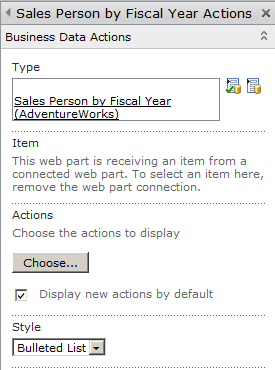
Actions can be triggered from most of the Business Data Web Parts. The Business Data List, Related List, and Business Data Item Web Parts contain an Actions drop-down list. You can also display the actions within the Business Data Actions Web Part, as shown in Figure 6-32, which displays two custom actions: View Profile and Search on Bing.

Note
See Also To learn how to create a custom action, see Chapter 5.
You can configure the Business Data Actions Web Part to show the actions for a specific ECT, and then a specific row via an identifier. However, you do not have to hardcode an identifier value for a specific row in the properties of the Web Part, as this will not be known to you at the time of configuring the Web Part. Again, you can use Web Part connections to join the Web Part to consume the custom actions for another Web Part to select the row. That way, when you click an item in a Web Part, such as a Business Data List Web Part, the custom actions are ready to run against the selected item.
In addition to being able to choose the style formatting for the display of your custom actions, you can customize which actions will display. For example, perhaps you don’t want all actions to display, if they aren’t appropriate. Figure 6-33 shows the configuration of the Business Data Actions Web Part.
The Business Data Custom Actions Web Part is a great addition to any business data dashboard, as it allows you to better arrange the dashboard. For example, you can hide the Actions menu from all other BDC Web Parts to obtain more real estate on the page and keep the actions neatly configured in one area.
Chart Web Part
As you probably realize from the name of this Web Part, it is not a BCS-specific Business Data Web Part, but you can use it with BCS. The Chart Web Part allows you to create most types of charts, including pie, bar, line, and column charts for many different data sources. The data sources include:
Another Web Part on the page
A SharePoint list
An ECT
Excel Services
A SharePoint dashboard is likely to present business data where the data source definitions are not limited to those stored in the BCS metadata store, but come from other data sources as well. A chart allows you to display the data in a manner that is sometimes more readable on a dashboard than displaying the raw data within a table or grid. In this section, you will learn how to configure the Chart Web Part for data source definitions stored in the BCS metadata store.
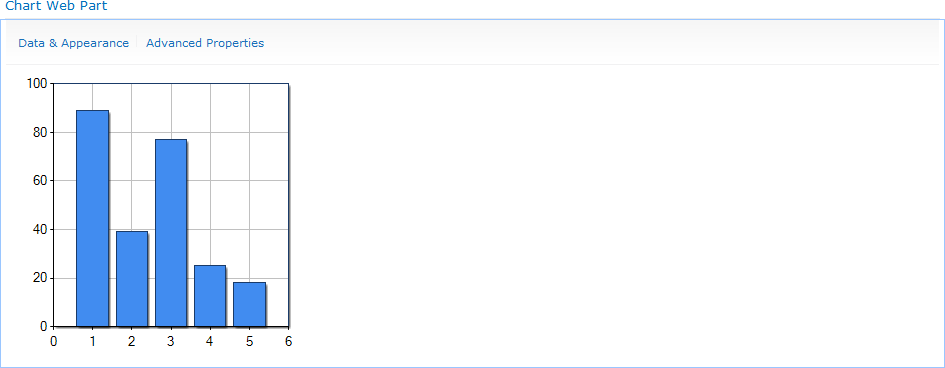
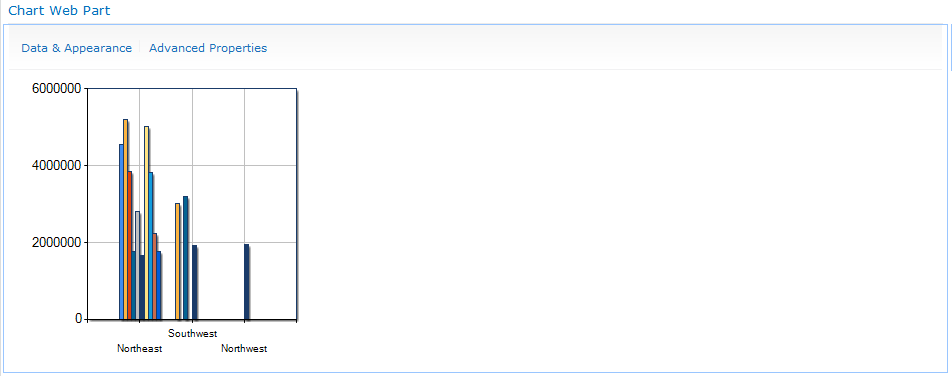
The Chart Web Part displays sample data in a 2D column chart when you first add it to the Web Part page. You configure the Web Part not through its tool pane like the other Web Parts described in this chapter, but through wizards triggered from the two links at the top of the Web Part, as shown in Figure 6-34.
To configure the Chart Web Part, follow these steps:
Click Data & Appearance to display the Data Connection & Chart Appearance Wizard page. This page contains two links:
Customize Your Chart
Connect Chart to Data
Click Connect Chart to Data to display step 1 of the wizard, Choose a Data Source.
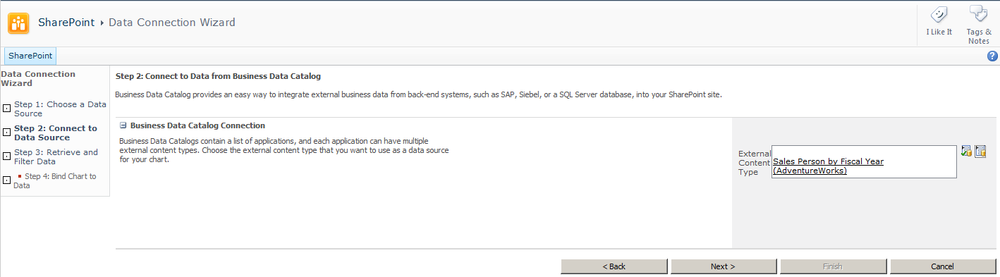
To connect to an ECT, select Connect to Business Data Catalog, and then click Next. Step 2 of the wizard displays.
Select the ECT that contains the data you want to view within a chart. Figure 6-35 shows the selected ECT.
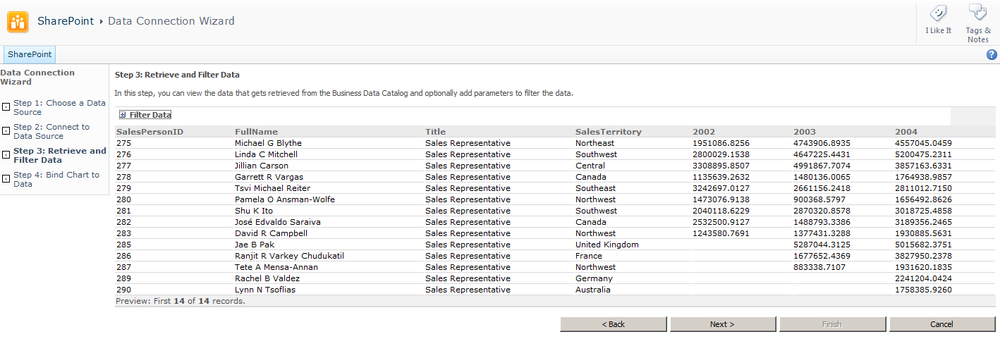
Click Next to display step 3 of the wizard, as shown in Figure 6-36. On this page, you preview the data that will be used to display the chart. You may optionally expand the Filter Data section of the page to configure filter parameters, which allow the chart to be filtered using the out-of-the-box filter Web Parts.
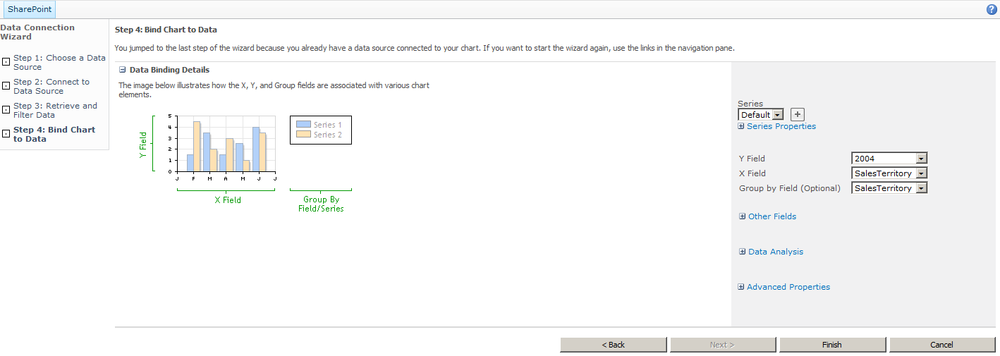
Click Next to display step 4 of the wizard, where you can define the columns used to plot the chart. You can specify the column for the X axis and Y axis. As shown in Figure 6-37, the chart is also grouped by a column since it has multiple rows containing a region.
Click Finish to see the configured chart.
To change the chart’s look and feel, click the Data & Appearance link at the top of the Web Part, as shown in Figure 6-38, to display the Data Connection & Chart Appearance Wizard page, where you click Customize Your Chart.
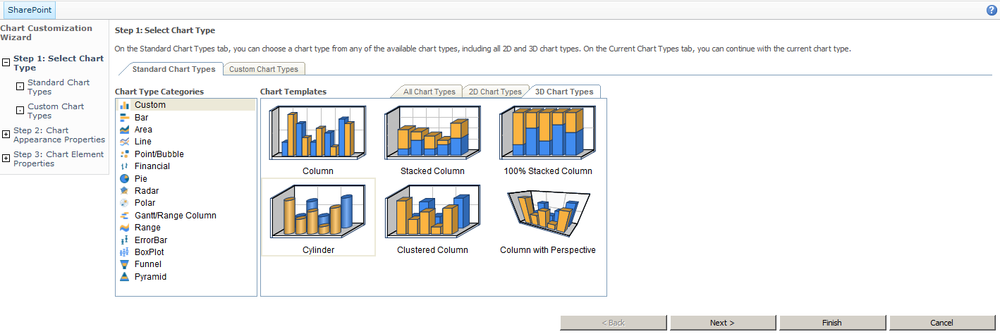
You can customize the look and feel of the chart, including changing the chart type, setting a title and legend, and configuring the size of the chart in pixels. The chart tends to be small by default. Changing the default size from 300 pixels to around 900 pixels wide makes a big difference in the readability of the chart. Figure 6-39 shows some of the chart types you can choose from.
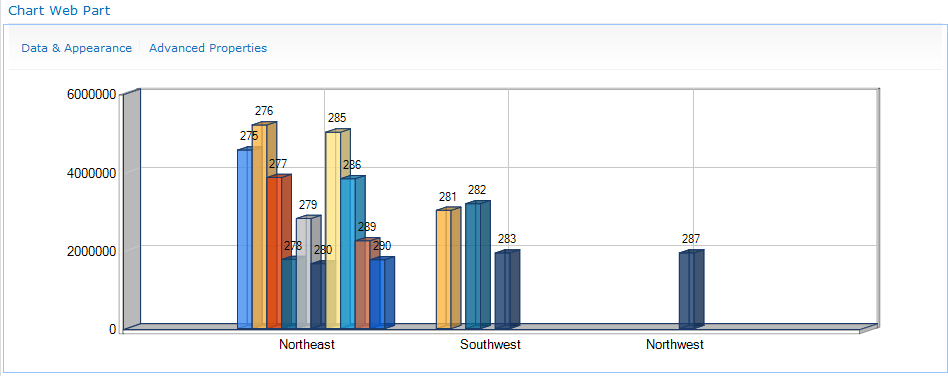
After you complete the wizard, you can plot the Adventure Works Sales by Fiscal Year data in a chart as well as set it to display as a Business Data List Web Part within the dashboard, as shown in Figure 6-40.
Other Business Data Web Parts
Other Web Parts useful for a dashboard are not related to Business Connectivity Services (BCS). A point of confusion is that these Web Parts are displayed within the Business Data category of Web Parts. Arguably, they are related to business data, just not Business Data Catalog (BDC) or BCS.
This section describes the other Web Parts, such as the Excel Web Access Web Part and Visio Web Part, and how you can use them within a business data dashboard.
Excel Web Access Web Part
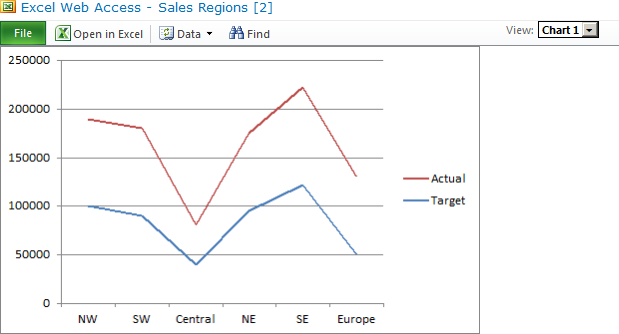
Excel Web Access is an extremely powerful service within SharePoint Server 2010. Excel Web Access allows Excel workbooks to be published to a report library, which is essentially a special type of SharePoint document library. The report—an Excel workbook—can then be displayed using the browser, allowing information workers to view workbooks. The data in the workbooks can be changed by a user through the Excel Web Access Web Part by modifying certain parameters or values. Changing the values and parameters within the Web Part can provide updated calculations. For example, the Excel Web Access Web Part may display part of a workbook for mortgage calculations. Exposing the parameters for the borrowed amount or interest will affect the monthly payment.
The Excel Web Access Web Part allows you to display objects from a Microsoft Excel workbook stored within a report library. These objects could include a chart or data contained within a range or formatted as a table. An organization’s business data is often stored within spreadsheets and not just in relational databases that can be consumed through BCS. The Excel Web Access Web Part therefore deserves a mention in this chapter, as it is likely to contribute to your business dashboards.
An Excel workbook is created either from within a report library or from the Excel client application and then published to the Reports Library. Using the Excel Web Access Web Part, you can select the workbook and the object you want to display within the Web Part.
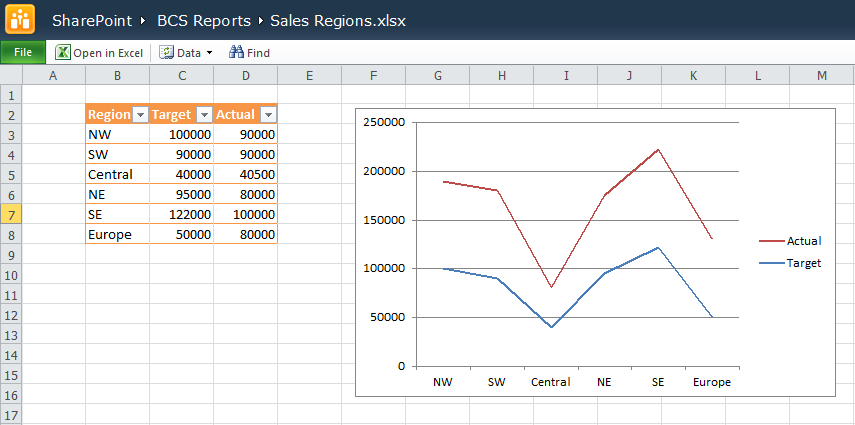
Figure 6-41 shows a sample Excel workbook containing a table of sales-related data and an Excel chart. The workbook is stored within a report library.
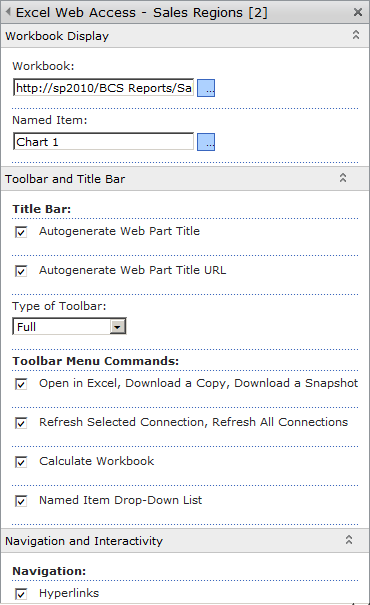
You configure the Excel Web Access Web Part using its tool pane, which allows you to browse to the workbook and then type the name of the object you want to display. Figure 6-42 displays the properties of the Excel Web Access Web Part.
You can make many refinements to the Excel Web Access Web Part, including configuring the Web Part title, setting the type of toolbar, and choosing the options available on the toolbar. Figure 6-43 shows the configured Excel Web Access Web Part.
The Excel Web Access Web Part can also consume filters from other Web Parts on the page, such as the Text Filter Web Part. This allows different objects to be displayed based upon the filter value.
Status List and Indicator Details
Most dashboards are likely to display key performance indicators (KPIs) of some sort that show how well different areas of the organization are performing. KPIs usually consist of a target and an actual value against a business goal, such as revenue per quarter. Traffic light indicators provide a visual cue of whether or not a particular goal was met. For example, assuming the revenue for the quarter was $50,000, but the target was $40,000, a green traffic light would display, indicating that the quarter revenue equaled or exceeded the target value.
SharePoint Server provides a Status List template that enables you to define your goals and targets within a SharePoint list. The Status List contains the definition and can dynamically obtain the actual value against a target from multiple data sources:
SharePoint list
Excel Web Access
SQL Server Analysis Services
Fixed-value indicator
Notice that BCS is not in the list of data sources. However, if your data resides in a Microsoft SQL Server database, then in place of using BCS, you could use SQL Server Analysis Services as a data source for your indicators.
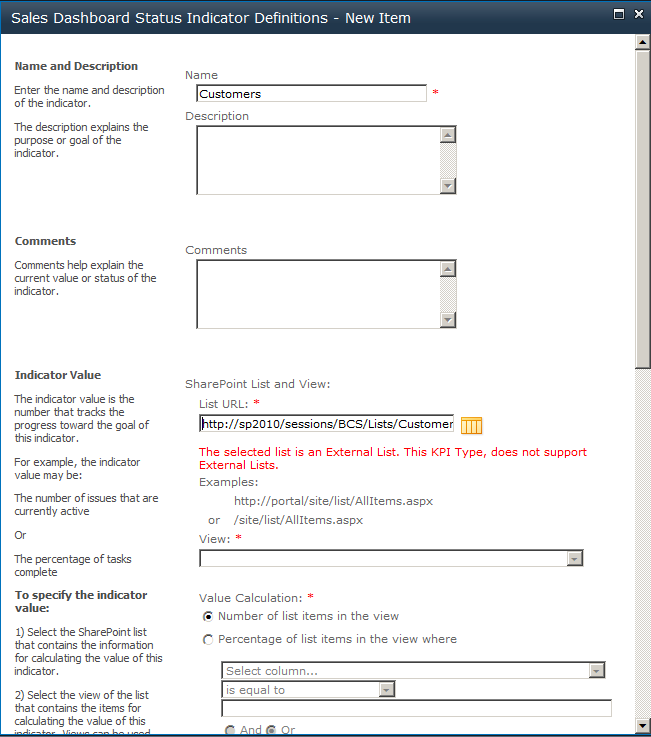
A common misconception is that you can base a KPI on data from a BCS external list instead of using an external content type (ECT). Unfortunately, this is not achievable, as the data presented in an external list does not reside within SharePoint. Figure 6-44 displays the error message that appears if you try to create a new status indicator definition with an external list.
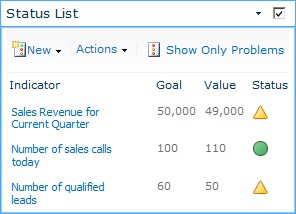
If you do create a status indicator against one of the other data sources, once you have created the list item, you are able to display the KPI itself within the Status List Web Part. The Status List Web Part displays the description, goal, actual value, and status indicator, as shown in Figure 6-45.
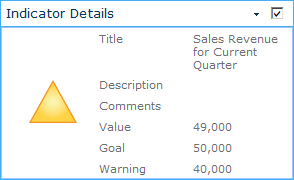
The Status Indicator Details Web Part is virtually the same as the Status Indicator List Web Part, except that it focuses on just one of the indicators instead of providing a list of them. Within the tool pane of the Indicator Web Part, specify the location of the status list along with the indicator you want to display, as shown in Figure 6-46.
Because BCS is not one of the available data sources for the status indicators, you can use the Data View Web Part in SharePoint Designer or customize a Business Data List Web Part to show KPIs, as described earlier in this chapter.
Visio Web Access
The Visio Web Access Web Part is the last Web Part that appears in the business data category. The Visio Web Access Web Part is similar to Excel Web Access Web Part, in that you can display documents within the browser rather than in the client application. Visio drawings are another method of storing data diagrams and are therefore considered business data, albeit a type not associated with BCS.
This chapter described many of the Web Part properties that happen to be specific to each Web Part. However, other Web Part properties are common across many out-of-the-box Web Parts. Often these properties are ignored, but they are relevant and useful, especially when you’re trying to design a pleasing SharePoint dashboard. Many of the Business Data Web Parts derive from the Data View Web Part and share some of the Data View Web Part properties. The Web Part tool pane contains four sections:
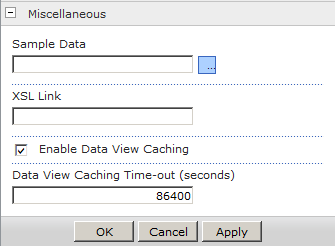
Miscellaneous This section consists of four properties you can use while building the dashboard. Figure 6-47 shows the Miscellaneous section of a Business Data List Web Part.
Figure 6-47. The Miscellaneous section of a Business Data List Web Part contains the Sample Data and Caching options.Sample Data The Sample Data property is useful when you modify the Web Part in an editor such as SharePoint Designer 2010. SharePoint Designer 2010 generates its own sample data when you modify the Web Part in SharePoint Designer instead of the browser. The sample data provides you with a realistic view of what the Web Part will look like within the browser once it has been configured. Occasionally, you might need to see more realistic data to test your calculations and formatting. The sample data can be pasted or typed into the Sample Data property as XML.
XSL Link This property allows you to link to an XSLT file that may be stored within a library as a site resource or within the 14 folder on the SharePoint server. Linking to the XSL file allows you to continue modifying the XSL through an editor, such as Visual Studio or SharePoint Designer, so you don’t have to modify the XSL without an editor in the XSL window of the Web Part, as described earlier in this chapter.
Enable Data View Caching This property is checked by default. This setting allows the data to be cached for the period set in the Data View Caching Time-out (Seconds) property. The default is 86,400 seconds, which is equivalent to one day.
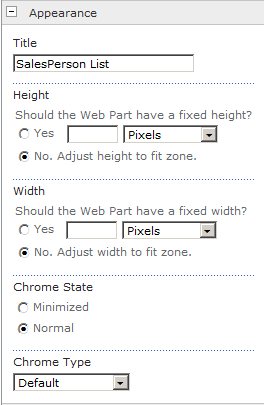
Appearance This section includes five properties, as shown in Figure 6-48.
Title It is useful to change the Title property of the Web Part when using the Business Data Web Parts. The title automatically names itself after the ECT that the Web Part is configured to use. If the same ECT is used several times on a page, you will often see a number within parentheses next to the title, such as Customers (2). Renaming the Web Part allows the title to make more sense. When the Web Part is not a Business Data Web Part, the Title property is the name of the Web Part, and you should change it to indicate the purpose of the data it displays.
Height and Width These properties can be useful for Web Parts, such as the Chart Web Part, when there is a graphic or a grid of information that needs to fit within a certain space. Often with these Web Parts, you end up with a lot of whitespace taking up valuable real estate on the dashboard.
Chrome This property is the surrounding border of the Web Part. You can specify to show the Default option, None, Title and Border, Title, or Border only. Often in a dashboard, a title may not be required at all. In the Chart Web Part, for instance, you can place a title within the chart itself.
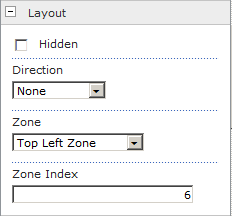
Layout This section contains four properties, as displayed in Figure 6-49.
Direction This property controls the direction of the text. You can set it left to right or right to left, which is useful within some language packs.
Zone and Zone Index You can set these two properties by dragging and dropping the Web Part between Web Part zones. You may also set the zone and the Web Part order by setting the properties within the Layout category. The Zone Index is the order from top to bottom within the Web Part zone.
Hidden Other Web Parts you have learned about include the Filter Web Parts. Such Web Parts are hidden by default, but you can unhide them. Unhiding a Web Part is useful when you’re trying to troubleshoot or while you’re building the dashboard. It might be that you aren’t getting expected results when linking to a hidden Web Part, and you want a better understanding of the values stored in the hidden Web Part.
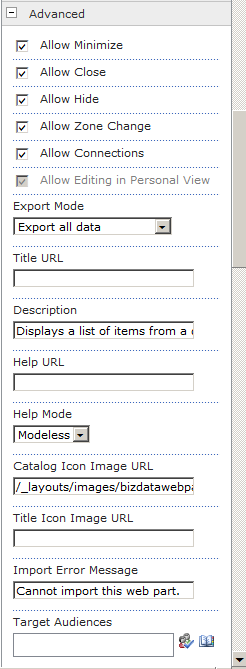
Advanced This section contains the many of the properties that configure whether a user can modify the personal properties of a Web Part. As the designer of the page, you can enable users without design permissions to perform only certain operations, such as Allow Minimize, Allow Close, Allow Hide, Allow Zone Change, and Allow Connections. Figure 6-50 displays the Advanced properties.
Export Mode When a developer creates a Web Part property, the designer can specify whether the property can be marked as sensitive. When you export a Web Part, those Web Part properties that are flagged as sensitive will not be exported. For example, a data source connection string could include a password to an SQL server. If a Web Part property was created to store a data source connection string, then it would be a security risk to allow users of the Web Part to export all of the properties the Web Part property that included the data source connection string values. Therefore, a password field or connection string field can be marked as sensitive. As the person who configures Web Part properties, you may prevent anything marked as sensitive from being exported.
Title URL This property enables you to type a URL in a text box and configure the Web Part title as a hyperlink pointing to that URL. This property is used widely in SharePoint with List View Web Parts, where you click the Web Part title and are redirected to the default view of the list.
Description The text within this text box is displayed as a tooltip when a user hovers the mouse over the Web Part title. Within a dashboard, you can use this description property to include a description of the data returned from BCS.
Help URL This property allows you to reference a help page. The referenced help page then opens instead of the standard help pages provided by SharePoint.
Help Mode This property describes how the help window will be displayed.
Catalog Icon Image URL and Title Icons Image URL Use these text boxes to define the URL of a descriptive custom icon. The image size must be 16 pixels by 16 pixels. The Catalog image is used when listing a Web Part, such as within the Web Part pane that appears when you add a Web Part to a page. The Title image is used in the Web Part title bar and can add visual impact to your dashboard.
Import Error Message Use this property to define a custom error message displayed when an attempt to add the Web Part onto the page is not successful.
Audience Targeting This property allows you to show a Web Part to current users whose profile positions them into an audience. For example, if a user enters the Sales Team domain group in the Audience Targeting text box, and the user is not a member of the Sales Team domain group, SharePoint automatically hides the Web Part from the user.
Summary
Microsoft SharePoint business data dashboards are a powerful way to display data throughout your organization in an easy-to-read and understandable manner. Without these kinds of dashboards, businesses may rely on emailed attachments of reports, or information workers may need to obtain the required data for themselves.
In its basic form, a dashboard in SharePoint is just a SharePoint page that contains more than one Web Part displaying related business data. These pages tend to be interactive, so a user can select data in one Web Part, thereby affecting the data displayed in another Web Part. To create an effective dashboard, you should plan the layout of your page using a wireframe or page schematic.
As dashboard pages tend to contain only Web Parts, it is customary to create Web Part pages as dashboard pages. You can add any Web Part to your dashboard pages, but the Enterprise edition of SharePoint Server 2010 provides additional Web Parts that are categorized as Business Data Web Parts, which simplify the creation of dashboards.
Using the Business Data Web Parts, you can easily create dashboards that bring together data from different Excel workbooks and Business Connectivity Services (BCS) applications, and display the data within views or charts. Key performance indicators (KPIs) provide a clear vision of the performance within your company, and you can create these on your business data through either the status list or customization of the Business Data List Web Parts.