Fiber Bundle
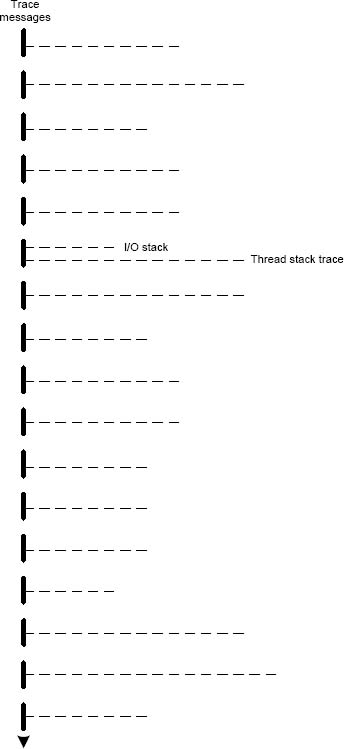
The modern software trace recording, visualization and analysis tools such as Process Monitor, Xperf, WPR and WPA provide stack traces associated with trace messages. Consider stack traces as software traces we have, in a more general case, traces (fibers) bundled together on (attached to) a base software trace. For example, a trace message, that mentions an IRP can have its I/O stack attached together with the thread stack trace with function calls leading to a function that emitted the trace message. Another example is an association of different types of traces with trace messages such as managed and unmanaged ones. This general trace analysis pattern needed a name so we opted for Fiber Bundle as analogy with a fiber bundle49 from mathematics. Here's a graphical representation of stack traces recorded for each trace message where one message has also an associated I/O stack trace: