
Chapter 5
Automated Identification 1
This chapter addresses automated identification technology. In recent years, automated identification technology as part of mechatronics has become increasingly important in many areas such as industry, physical distribution, security, archiving, and medical application. Currently available and research-phase techniques related to identification technology are described in this chapter.
5.1. Introduction
We first look back at the historical development of the barcode and radio frequency identification technologies. In 1968, a barcode system for goods- wagon transport control was developed using a barcode symbol (Code 2 of 5) and a He-Ne laser scanner by Identicon Corp [HIR 01]. Afterwards, the serial barcode system grew into a system handling a large amount of information. By the 1980s (specifically 1984), the POS (point of sale) system using the JAN (Japanese article number) code was in practical use. Since then, the serial barcode system has been used to identify many articles such as foods, electrical appliances, medical apparatuses, medical materials, medicines, books, and clothes in distribution and physical distribution. In factories, barcode systems (using barcode Code 39 or NW-7) have been used in collecting production information and product instruction for realization of FA (factory automation) and CIM (computer integrated manufacture). In the late 1980s, several two-dimensional (2D) codes were developed in response to the requests by users for a barcode capable of handling much information in fields such as semiconductors, medicine, and mechanical components. Specifically, PDF417 and QR code were developed in 1989 and 1994, respectively. These barcodes including serial and 2D barcodes were standardized according to ISO (International Organization for Standardization) and IEC (International Electrotechnical Commission) in 1996 [HIR 01], and are now used in the field of sales management of articles in distribution, physical distribution, manufacturing, and individual identification.
On the other hand, the RFID (Radio Frequency Identification) system was developed to identify an IC tag attached to concrete-mixer vehicles to monitor the running status in 2002 [NIK 03, RFI 04]. This is a non-contact, non-directional identification system using a radio frequency wave and IC chips [RFI 04, JAP 03]. Presently, this system is used for personal identification, such as in the use of cash cards, credit cards, point cards, ticket cards, and commutation tickets, and in cattle identification.
Thus, identification technologies such as the barcodes and RFID have many applications. In recent years, automated identification technology as a part of mechatronics has become increasingly important because of the possibility of its wide use in many areas such as industry, physical distribution, security, archiving, and medical application. In this chapter, currently available and research-phase techniques related to this technology are described. In the following sections, conventional serial binary barcode and 2D barcode identification technologies are introduced. As a 2D barcode identification technology in a research phase, a multi-line scan based on the time-sharing laser light emission method using a laser is also presented. A newly developed ternary barcode detection technology currently in its research phase is then presented. Finally, RFID technology with many prospective applications is introduced.
5.2. Serial binary barcode
Serial barcodes such as Code 39, NW7, and Code 128 are binary barcodes consisting of white and black bars and spaces. Code 39 and NW7 are discrete barcodes consisting of the binary level with a wide bar or space (1) and a narrow bar or space (0). Code 128 is a continuous barcode consisting of multiple levels with four bar (space) widths. Techniques for scanning the serial binary barcode are a laser mechanical scan using a rotary mirror and an electronic scan using a CCD (charge-coupled device) line image sensor. These barcodes have the characteristics that they are easily read without contact and have a high identification rate when using the mentioned scanning techniques. The laser scanner and CCD scanner realize a nearly 100% identification rate.
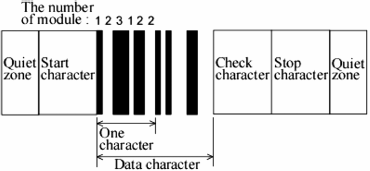
Code 39 developed by Intermec Technologies Corp. (in 1975) was standardized in ISO and IEC in 1999. The code is currently used in physical distribution, product management in factories, and medical industry as main applications. One character of this barcode consists of five bars and four spaces, where three of the bars and three of the spaces are wide. This barcode can express 44 kinds of characters. The minimum symbol length is given by [5.1]:
Here, X, C, N, and G represent the narrow element width, the total number of characters not including start and stop codes, the ratio between wide and narrow elements, and the gap between neighboring characters, respectively. Q is the minimum width of the quiet-zone space, which is regulated at one larger than the width of the start and stop characters. When X is equal to or less than 0.508 mm, N is set to 2.2–3.0 (usually 2.5). The gap G is set to the largest of either 3·X or 1.35 mm. The height H is set to the largest of either 6.35 mm or 15% of all symbol length. Figure 5.1 shows a code pattern of one character of Code 39.
Figure 5.1. Code pattern of one code 39 character
NW7 developed by Monarc Marking in 1972 has characters consisting of seven elements, with each character composed of four bars and three spaces. Only two of the seven elements are wide. This barcode can express 20 characters. The barcode is used, for example, in clothing management, blood management, pick-up management for the home-delivery service, mail registration, lending management at libraries, and membership cards. The minimum symbol length L is given by:
Here, W is the total number of wide character codes. Figure 5.2 shows a code pattern of one character of NW7.
Figure 5.2. Code pattern of one NW7 character
Code 128 developed by Computer Identics Corp. in 1981 has characters consisting of three bars and three spaces, where each bar (space) has four types of bar (space) width. The code can express all 128 ASCII characters. Three types of code set — A, B, and C — are defined depending on the type of start code. The minimum symbol length L is given by [5.3]:
Here, X and D represent the module width and the number of figures of the code set, respectively. C represents the total number of ASCII characters, function characters, shift characters, and code characters. Q represents the minimum quiet zone width, which is the largest of either 10X or 2.54 mm. This barcode being able to handle lots of information is used in the management of medical apparatuses, medical materials, and medicine. Figure 5.3 shows a code pattern configuration of Code 128.
Figure 5.3. Code pattern configuration of Code 128
5.2.1. Identification technology for serial binary barcodes
We first describe the identification principle of the serial binary barcode. A barcode reader for identification of this kind of barcode consists of a light source, scanner, detector, amplifier, A-D convertor, decoder, and interface (Figure 5.4). A light-emitting diode (LED) or a laser diode is used for the light source. There are two self-scan-type techniques of CCD scanning and laser scanning for the scanner. The CCD has a self-scanning function in the device itself. However, in laser scanning, a polygonal mirror or galvano mirror is used for scanning laser light. The polygonal mirror has a highly stable rotation speed but is expensive, whereas the galvano mirror has an unstable scanning speed but is inexpensive. Therefore, for the latter, special signal processing techniques are required. A photodiode is used for the detector in laser scanning because of its high sensitivity. A photodiode array integrated in the CCD device is used in the CCD scanner. In the case of the A-D convertor, sophisticated techniques are required to obtain the digitized bar and space signals corresponding to each bar and space width. The decoder measures barcode patterns as width information by counting clock pulses. These measured patterns are classified as 1 or 0 corresponding to wide and narrow bar or spaces. The pattern data are decoded as a character or sign and converted to ASCII character codes. Subsequently, these are recorded in the memory. Finally, in the interface, memorized data are sent to an RS-232C interface or a TTL serial interface on PCs or terminals.
Figure 5.4. Identification principle of the barcode

5.2.1.1. CCD scanning
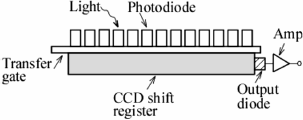
A light source of red LEDs is used to illuminate uniformly the barcode. The wavelength of red LEDs used is mainly 660 nm. The reflected light from the barcode is detected by a CCD line image sensor that consists of 2,000–3,000 elements [SEQ 75]. The output signal of the CCD sensor is converted by the A-D conversion circuit and its digitized signal is decoded in the decoder. The configuration of the CCD line image sensor is shown in Figure 5.5. This sensor is able to detect optical signals away from the object both by contact and remotely. In the former case, the reading width of the barcode is usually narrower than that of the scanner head. That is typically 80 and 100 mm, which are available for use in applications of FA and physical distribution. This scanner can be made cheaply and has a high identification rate. In the latter case, remote identification using a CCD sensor with 10 cm focal distances is possible at several centimeters to 10 cm from the object. Because wide barcodes can be detected using this sensor, there is no need to prepare scanners corresponding to the barcode width. That is, the application range is expanded.
Figure 5.5. A configuration of the CCD line image sensor
5.2.1.2. Laser scanning
Basically, a laser scanner (using a red laser diode) is used in handheld scanners. The wavelength of laser diodes, which are most frequently used for barcode readers, is 660–680 nm. Laser light reflected by a rotary mirror with multi-reflection mirror facets scans a barcode surface as shown in Figure 5.6 [WAK 10a]. The light reflected from the barcode is detected by a sensor through the optical filter and optical-electrical converted signals are identified by a decoder. The scanning speed is 30–50 scan/s. The detection resolution changes depending on the detection distance. Usually, the resolution decreases as the scanner moves further from the focal point and nearer the one. Remote identification, large detection width (long detection depth), and maintenance of the high identification rate are features of this scanner. Therefore, this scanner is useful for a POS system and goods management in physical distribution.
Fixed-type laser scanners are those that are able to read barcodes automatically. The principle of reading barcodes is the same as that of handheld scanners. In the case of a fixed device, scanners and barcodes are positioned such that the reading and start of detection are automatic. The feature of this scanner is its high-speed detection. The scanner can operate at scan speeds higher than 400–2,000 scan/s. In addition, this scanner has features of long detection distance, long detection depth, and large detection width. Therefore, it is used on FA production lines and in physical distribution.
Figure 5.6. Schematic outline of a laser scan system

5.2.2. Requirements for serial binary barcode identification
The identification rate is affected by the contrast of barcode symbols. The print contrast signal (PCS) and space reflection rate Rs as indices of contrast are defined by the ANSI (American National Standards Institute) as follows:
Here, Rs, Rb, and Rsmin represent the reflection rate of space, reflection rate of a bar, and minimum reflection rate of space, respectively.
5.2.3. Decoding for identification
The identification rate depends on factors such as the quality of a barcode label, optical resolution of a barcode reader, A–D convertor, and decoding algorithm. In the case of the decoder, the time period of the bar or space pattern signals measured as the number of clock pulses is classified as 1 or 0 compared with a reference value. The reference value cannot be constant because the time period changes depending on the scanning speed and the bar width. Usually, after the initial bar time period is measured, the reference value is defined. Next, the reference value is modified depending on the following bar width measured. Using this method, the system can be subordinated to the scanning speed. Thus, the identification rate increases.
Generally, the identification rate is higher for high-speed scanners. Scanners such as CCD scanners and laser scanners scan 10 times for identification. The scanner’s reading rate per single scan is low, but the overall reading rate increases because of the multiple scanning. However, the first reading rate is important. When the first reading rate FR is too low, complete identification is impossible (Figure 5.7). This is seen from the dependence of the identification rate P on the FR that changes as shown in formula [5.7].
Here, N is the number of scans.
Figure 5.7. Identification rate versus number of scans. FR represents the first reading rate

5.3. Two-dimensional binary barcode
PDF417 developed in 1989 and QR code developed in 1994 are typical 2D barcodes. PDF 417 is a stack-type 2D barcode that can handle binary codes in addition to ASCII characters and numerals (Figure 5.8). This barcode consists of a basic module (a code word) of 17 modules with four bars and four spaces.
Figure 5.8. A symbol example of PDF417 [HIR 03]

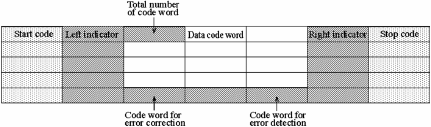
The symbol consists of a start code, a left indicator, data, a right indicator, and a stop code (Figure 5.9). The column number of the code word is 1–90 and the maximum number of lines is 3–90. The left and right indicators include a line number, a total line number, a total column number, and a security level. The first code word in the data represents the total number of code words and the last code word an error detection code word. The symbol length L including a quiet zone is given by:
Here, R is the number of code words per line. The quiet zone is set to more than twice the module width X. The minimum module height is set to more than three times the module width X. When X is 0.191 mm, the minimum module height is 0.57 mm.
This barcode with a large number of columns is identified using raster scanners or CCD scanners. Since this barcode encoded with much information is easily identified by usual barcode readers, it is used most widely around the world.
Figure 5.9. Configuration of PDF417
On the other hand, QR code is a matrix-type code that has large cells and view finders on three corners (Figure 5.10). Owing to this structure, the reference position, origin, symbol size, and tilt are detected at high speed. When the number of cells, cell size, and one-sided quiet zone width are N, X, and Q, respectively, the vertical or horizontal length of the symbol L is given by:
This code that decodes the cell’s layout pattern is difficult to read by scanning. It is instead read by area image readers. A QR code with less than 100 characters consisting of English letters and numerals can be read within 32 ms.
Figure 5.10. A symbol example of QR code [HIR 03]

5.3.1. Scanning technology of the 2D barcode
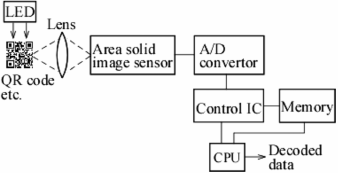
An electronic scan using a CCD or MOS area image sensor (area solid image sensor) is a barcode scanning technique for the 2D binary code such as PDF417 and QR code. In image sensing techniques, light emitted by the light source of LEDs illuminates 2D codes uniformly. In this case, uniform illumination using a reflection plate is important for the subsequent processing of the image signal. The 2D binary code image per field is stored in an area solid image sensor using a focusing lens. This image transformed to electronic signals is read out and stored in the memory (Figure 5.11). Through image processing, the type of 2D code, position, size, tilt, origin, and distortion are detected. The image data are encoded as optimal data for obtaining efficiently encoded symbol data. The white (1) or black (0) information for each cell from the optimal data is determined through comparison with a threshold. The digital data obtained by comparison is transformed to a corresponding symbol character using a symbol character table. When using area image sensors, a decoding time or speed is determined by how image processing is done. Optical focusing is also important for obtaining a sharp image. An automatic remote focusing method using both an LED and a laser diode is used recently. Area solid image sensors can read 2D codes and stack-type barcodes in addition to binary barcodes. Only stack-type barcodes can also be read using laser raster scanners.
Figure 5.11. Schematic outline of an area solid image sensor scan system
5.3.1.1. CCD area solid image sensor
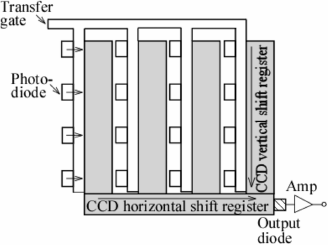
There are mainly two types of CCD area solid image sensors: which are a frame-transfer device with an imaging area and an additional transfer area, and an interline-transfer device integrating these areas within the same area [SEQ 75]. The configuration of a CCD area solid image sensor of the interline-transfer type suitable for a compact integration structure is shown in Figure 5.12. While this configuration enables simple operation of imaging and storage functions, it results in a complex cell design and a reduction of the light-sensitive area. The operation principle of the sensor is described below. When an optical image is illuminated on the photodiode, the charge is accumulated in the separate photodiodes. After the charge in each cell is stored in the previous field, it is transferred to the vertical shift register and then shifted to the horizontal shift register by one element during each horizontal period. All shifted charges are then transferred to the output diode along the horizontal shift register. The charge is transformed to a voltage signal at the output diode and the amplifier. Thus, a conversion of optical image of barcode patterns to electrical signals is achieved. The CCD solid image sensor has features of less noise and higher sensitivity compared with the MOS area solid image sensors described in the following section.
Figure 5.12. Configuration of a CCD area solid image sensor
5.3.1.2. MOS area solid image sensor
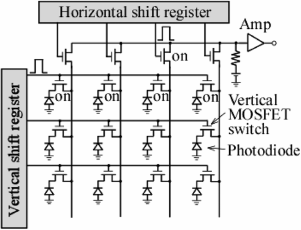
A MOS area solid image sensor is also used as a scanning device. The configuration of this structure is shown in Figure 5.13. This device has a structure with horizontal/vertical shift registers and integrating in a x-y matrix style each pixel which consists of a photodiode and vertical MOSFET switch [TAD 03]. The incident light is illuminated to the photodiode. Pulses from the horizontal/vertical shift registers are sent sequentially to the vertical/horizontal selection lines. When gate pulses from the horizontal and vertical registers are given to the gates of the vertical MOS FET switches and a column selection switch, the charge on the photodiode in the pixel selected is read out by discharging through the selected vertical MOSFET switch and the column selection switch to the output amplifier. Currently, the advanced version of this sensor reduces the reset- and dark-current noise and increases sensitivity using a buried photodiode, and is used as a CMOS area solid image sensor for digital video and single-lens reflex cameras. Such devices feature easy integration of peripheral circuits and lower power dissipation but a lower signal-to-noise ratio compared with the CCD area solid image sensor.
Figure 5.13. Configuration of a MOS area solid image sensor
5.3.2. Multi-line scan based on time-sharing laser light emission
Goods identification in real time is attractive in applications such as goods management in production lines and automated warehouses requiring high-speed detection. To realize real-time identification, the barcode needs to contain much information. Although the use of high-density 2D binary barcodes or color barcodes for identification systems has been considered, the scanning speed in these techniques is limited to nearly 50 scan/s by the complicated image processing using CCD/MOS area solid image sensors, and this makes it difficult to achieve the high-speed sorting of goods. Furthermore, because the depth of the field in a camera lens using CCD/MOS area solid image sensors is shallow (< 2 cm), the focus needs to be adjusted to realize a longer detection range. For high-speed identification of stack-type 2D barcodes such as PDF 417, raster laser scanners are appropriate. In conventional simple laser scanners, a physical scanning speed is determined by the rotation speed of the polygonal-mirror scanners. This simple type of scanner is insufficient for applications in which high-speed identification is necessary, because the scanning speed is limited by the scanner’s physical characteristics. Hence, the key to achieving a high-speed identification system is to ensure that the system can identify a large amount of barcode information within a single scanning period.
5.3.2.1. Three-line scan by time-sharing laser light emission
For achieving high-speed identification, a multi-line-scan 2D binary barcode detection system (BCDS) using multi-LDs with time-sharing light emission (TSLE) operation for a stack-type 2D barcode was proposed in 1999 in the research phase [WAK 99, WAK 00b, WAK 01]. This enables multi-line barcodes to be read within a single scanning period. The 2D binary BCDS employing the TSLE operation is able to detect a stack barcode consisting of n lines within a scanning period of one facet of a polygonal mirror. Here, a three-line BCDS capable of realizing this is described for demonstration. Figure 5.14 is a schematic outline of the detection system, which consists of three LDs to detect a three-line barcode. Figure 5.15 shows waveforms to explain the operation principle. In this system, light emitted from the three LDs is reflected on to a polygonal mirror and reflected light from the mirror scans each line of the barcode in a time-sharing mode at a high LD drive frequency. Scattered reflected light from the three-line barcode is detected by a single photodetection apparatus consisting of a photodiode, photodetection lens, and a photodetection amplifier. The detected output is sampled in the time-sharing mode using sampling pulses synchronized with LD drive pulses. Three sampled outputs are digitized in the A/D conversion circuit. One of these digitized outputs (CH2*) is delayed for a barcode signal period T0 and another (CH3*) is delayed for twice the barcode signal period 2T0 in the delaying circuit. Two delayed outputs (CH2** and CH3**) and another non-delayed digitized output (CH1*) are added together in the summing gate. The added outputs are decoded successively in a decoder within a scanning period (T0), which contains a blanking period. Therefore, with this
Figure 5.14. A schematic outline of the 2D binary BCDS with the TSLE consisting of three LDs and a three-line barcode [WAK 01]

operation, the scanning of three barcode lines is completed within a period of one facet of a polygonal mirror; effective high-speed scanning triple that in conventional 2D barcode scanners is possible. Use of a single photodetection apparatus enables a scanned barcode surface to achieve wide defocus because there is no need to focus on photodetection apparatus arranged in different spatial positions.
Figure 5.15. Waveforms in the 2D binary BCDS employing the TSLE operation to explain operation principle. T0 represents a one-line barcode signal period [WAK 01]

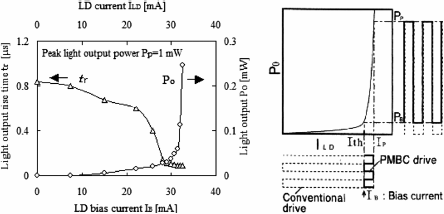
5.3.2.2. Optimization of LD bias current
When visible light LDs are used, we must take care in a drive mode of the LDs. As shown in Figure 5.16, the conventional modulation drive of index-guided-type LDs without bias current achieves a rise time tr of no less than 0.9 µs owing to its slowly rising light emission phenomenon [WAK 96, WAK 98a, WAK 99]. This phenomenon of slowly rising light emission is not caused by the laser driver circuit or packaging. tr just below 100 ns is required to achieve an LD drive frequency of 2 MHz. In the TSLE system, it is desirable that LDs are driven using the bias current as predicted from the current-light output characteristics of Figure 5.16. However, a bias current corresponding to a bias light must be optimized to a suitable one because there is a tradeoff between the high-speed pulse modulation operation and the threshold of LD (Ith ~31 mA). Channel crosstalk between three-line barcode signals caused by the bias light was tested. Channel crosstalk test results showed that a bias current below 30 mA is desirable to obtain small channel crosstalk between two channels. On the other hand, a bias current near the threshold of LD (~28.5 mA) is desirable to achieve a high-speed light output rise time of 90–130 ns (Figure 5.16). Therefore, the optimum bias current Iopt is 28.5 mA, which is slightly less than the threshold of LD (Ith ~31 mA). Thus, a pulse modulation drive with an LD bias current near the threshold (PMBC drive) developed in 1996 is useful for achieving high-speed switching of LDs [WAK 96, WAK 98a, WAK 99]. This method enables high-speed light emission, unlike the conventional modulation drive method of LDs. Hence, it enables high-frequency driving of LDs; that is, high-speed scanning.
Figure 5.16. (a) Light output rise time versus LD bias current, light output versus LD current characteristics. (b) Light output pulse in relation to the magnitude of LD bias current
5.3.2.3. Experimental results
A prototype system consisting of three LDs for a three-line barcode has demonstrated the effectiveness of the TSLE operation (Table 5.1). The interval between neighboring LD light paths is 9 mm. The interval l1, l2, and l3 between laser diodes LD1, LD2, and LD3 and the mirror are 197, 103, and 16 mm, respectively. This interval has been designed to be different from each others because of using spatially overlapping LD heads to make the LD light paths’ interval as small as possible. The distance between the polygonal mirror and the mirror was set to 60 mm. The polygonal mirror used is a six-mirror-facet polygonal scanner with the size of one mirror facet being 25 × 25 mm2. Index-guided type, 680 nm, LDs in the system were used because of small astigmatism. A photodetection apparatus consists of a photodetection lens with an aperture of 20 mm φ, a Si PIN photodiode (S3071), and a three-stage amplifier with a bandwidth of 6.4 MHz and a gain of 71.54 dB. Barcodes consist of three-line Code 39 symbols with a minimum width of 0.4 mm and a length of 44 mm arranged in parallel.
Table 5.1. Specifications of the prototype 3-line BCDS with TSLE operation
| Photodetection amplifier | Bandwidth of 6.4 MHz, Gain of 71.5 dB |
| Photodiode | Si PIN photodiode, Capacitance of ~15 pF |
| Rotating mirror scanner •Number of mirror facets •Size of one mirror facet | 6 25 × 25 mm2 |
| Laser diode | Index-guided type, 680 nm |
| Lens | 20 mmφ |
| Space between lights emitted from two LDs | 9 mm |
| Barcodes | Code 39 symbols with length of 44 mm arranged in parallel, a minimum bar width W = 0.4 mm |
In this system, the pulse modulation method with a bias current near the threshold (PMBC drive) of index-guided-type visible light LDs was used to improve laser light output rise time (tr) characteristics. For example, the optimum bias current of 28.5 mA for LD2 was chosen to achieve a high-speed light output rise time tr of ~130 ns. The system could recognize the barcode symbol pattern with a minimum width of 0.4 mm under the condition of one-line scanning period 2.05 ms for L = 10 cm. Figure 5.17 shows the maximum effective scanning speed versus LD drive frequency. The maximum effective scanning speed Ves was estimated under the condition that barcodes could be recognized within the practically usable detection lengths (approximately 7–17 cm). The achieved Ves was 1,460 scan/s when the drive frequency fc was 2 MHz. This is two and nine tenths times the speed of conventional
Figure 5.17. Maximum effective scanning speed versus LD drive frequency in the 2D BCDS with the TSLE consisting of three LDs and the three-line barcode [WAK 01]
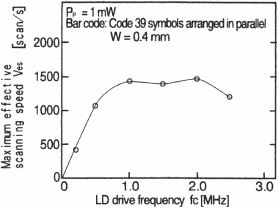
2D barcode scanners. A decrease in Ves for fc between 1 and 2 MHz is due to the wide interval between the neighboring sampled points in one barcode symbol. A sampled barcode signal waveform with a wide interval between neighboring sampled points becomes disarranged by noise within a non-sampled period and rough, when fc is somewhat high but there are few sampled points. As a result, barcode recognition in fc of ~1.5 MHz cannot be achieved at a high scanning speed of ~1,440 scan/s. That is, the scanning speed enabling us to recognize barcodes must be less than ~1,440 scan/s to increase the number of sampled points. An increase in Ves for fc = 2 MHz is due to an increase in the number of sampled points for one barcode symbol. Ves is limited by the narrow bandwidth characteristics of the photodetection amplifier. In addition, a long detection range (~10 cm) for the system was achieved without the need to adjust the focus, unlike the case for cameras when using CCD/MOS area image sensors.
Furthermore, a 2D BCDS with mask collimators was proposed to control the aperture of the laser beam to realize high detection resolution [WAK 04].
A system consisting of masks with 2.5 and 3 mm apertures was confirmed to be capable of providing sufficient resolution for 0.25 mm barcodes over a detection range of more than 12.5 cm.
5.4. Ternary barcode
In a 2D binary BCDS using a raster laser scanner appropriate for relatively high-speed detection, the amount of information handled by barcodes is limited by the number of raster scanner mirror facets and the detection resolution of the identification system. In addition, in a 2D BCDS with TSLE, the number of barcode lines is limited to nearly four because of the photodetection amplifier bandwidth limitation of about 6.4 MHz realizable in practical use (that is, the number of sampling points is limited), and thus, not so much information can be handled [WAK 01].
Therefore, a ternary barcode with much information was devised in 2005 [WAK 05, WAK 06a]. Although laser scanners are now being used to identify binary barcodes in production lines and elsewhere, no laser scanner enabling the system to identify half-tone barcodes has been developed yet. However, because conventional laser scanners or raster scanners can be used in detecting this kind of barcode through the development of new signal processing methods, there is the possibility of operating the detection system at high speed.
5.4.1. Dual-threshold method
In this section, a ternary barcode detection system (TBDS) with the laser scanner employing a dual-threshold (DT) detection method is described, providing a long-range detection range without having to adjust the focus. It also provides a high scanning speed while maintaining a great amount of information.
5.4.1.1. Dual-threshold ternary barcode detection system
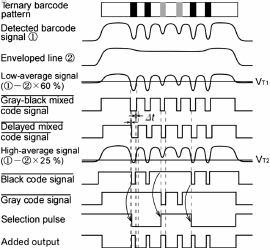
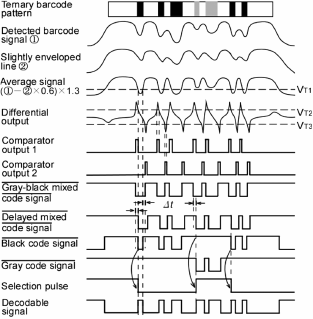
An outline of the DT TBDS using a laser diode scanner is shown in Figure 5.18, and the detection method is explained in Figure 5.19. This system obtains an enveloped line of a detected barcode signal using an enveloped line detector and obtains two reference signals by decreasing this enveloped line to two levels with 60% and 25% attenuators. These reference signals, subtracted from the original barcode signal in different subtraction gates, obtain low-average and high-average signals. Thus, a bent barcode signal with a hyperbola-shaped enveloped line is easily changed to unbent low- and high-average signals. Gray-black mixed and black code signals are obtained by comparing these low- and high-average signals with independent thresholds VT1 and VT2 in gray-level and black-level comparators, respectively. This method automatically allows the system to control comparison levels to a proper level depending on the barcode signals. Therefore, code signals can ideally be obtained regardless of the detection distance. The mixed code signal is delayed by a time difference ∆t between the gray-black mixed and the black code signals at each rise or fall change (caused by the difference in comparison levels) to obtain a selection pulse and produce a gray code signal. The selection pulse is created using a sampling circuit, which samples the black code signal selectively at the falling edge of the delayed mixed code signal. When the black code signal is low, the selection pulse becomes low at the first pulse of the black code signal, and this state is maintained until the high state of the following black code signal is sampled. Therefore, the gray code signal is obtained by deleting only signal parts corresponding to black bars using the logical product gating operation of the selected pulse and the delayed mixed code signal. The gray and black code signals are then added together in the summing gate, and the added output is decoded in a decoder, which chooses the gray or black code signal with the selection pulse. This system does not need complicated processing. Therefore, it is expected to detect barcodes at higher speeds and over longer ranges.
Figure 5.18. Schematic outline of the dual-threshold ternary barcode detection system [WAK 06a]
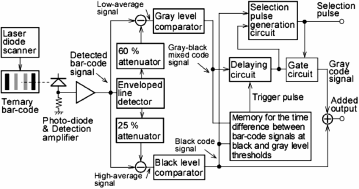
Figure 5.19. Operation waveforms in the ternary barcode detection system employing the dual-threshold detection method [WAK 06a]
When the ternary barcode is used, the amount of information greatly increases compared with that of a conventional binary barcode. In the binary barcode of Code 39, the maximum number of expression characters is 44. However, a combination of ternary barcodes consisting of nine elements per character enables the system to express at least 640 characters. This means that over 14 times more information can be realized using the ternary barcode, which enables the expression of numerals and Chinese characters, in addition to the basically required alphabet.
The attenuation degrees of two attenuators are set at 0.6 and 0.25, considering the condition in which the longest detection range could be achieved. The optimum thresholds VT1 and VT2 are set at 0.1 and 0.05 V, respectively, considering the maximum detection range.
5.4.1.2. Experimental results
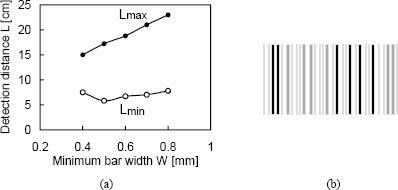
The prototype system was tested. The detectable range for a minimum bar width W of 0.4 mm for a barcode was over 7.5 cm (Figure 5.20), which is practically usable. W is limited by a decrease in the changes of the barcode signals from a narrow white to a narrow gray or narrow black bar. In addition, as a test result of the possibility of high-speed detection, a maximum scanning speed of 370 scan/s, which is seven times the ~50 scan/s achieved by conventional CCD cameras, was obtained under the practical detection range (≥4 cm).
Figure 5.20. (a) Detection distance versus minimum bar width [WAK 06a]. The scanning speed is 333 scan/s. (b) The ternary barcode used in the experiment
Employing DT techniques, two-line and six-line ternary barcode identifications were also investigated to clarify the possibility of high-speed multi-line detection. A two-line DT BCDS was tested in combination with the TSLE technique and shown to be capable of detection at a scanning speed over 16 times that of conventional CCD cameras [WAK 06b]. A six-line DT BCDS was tested by combining with a raster scanner and shown to be capable of detection at a scanning speed of 417 scan/s, half that of the two-line system [WAK 07, WAK 09]. The sixmirror-facet raster scanner with a unit angle θ = 0.61° (slant angles of six mirror facets = +2θ to −3θ) and dimensions of one mirror facet of 15 × 25 mm2 was used in this experiment. The experiment result for the slant angle of the barcode showed that the allowable skew angle for detection of the barcode is −16° to +16°, which is nearly equivalent to that for the conventional 2D BCDS.
5.4.1.3. Theoretical study of the multi-line barcode configuration
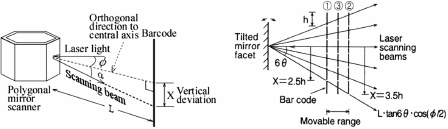
In a 2D BCDS using a tilted mirror scanner (raster scanner), the position of a laser scan beam changes depending on the detection length. Therefore, laser scanning beam traces need to be made clear in designing an optimum BCDS. The vertical deviation of laser scanning beams depends on the incident angle at which the beams are incident to the tilted mirror facet, φ/2 [WAK 98b, WAK 00a]. According to Li’s scan pattern theory [LIY 95], a vertical deviation x of the laser scanning beam reflected from the tilted mirror referring to the position of the beam reflected from the non-tilted mirror facet is given by:
Thus, the scanning beam shifts far from the orthogonal direction as the incident angle increases. This means that as the laser beam deviates from the central part of the barcode, the vertical deviation x either increases or decreases. This model allows an optimum 2D BCDS including an optimum barcode configuration and its position to be designed easily.
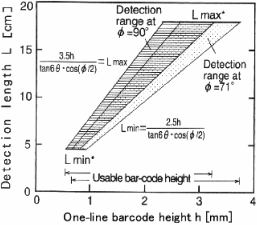
Using this model, a usable barcode configuration was studied theoretically. In the prototype raster scanner, the tilt angles of the six mirror facets are set at values between −3θ and +2θ. That is, three mirror facets are tilted in the lower direction and two mirror facets in the upper direction. The relation at this time between the location of a laser scanning beam and position of the barcode is shown in Figure 5.21. The lowermost laser scanning beam reflected from the scanner tilted to the lowest direction is located at L·tan(6θ)·cos(φ/2). The boundary position of the lowermost barcode and the outside is 3.5h (where h is the barcode height per barcode line). The boundary position of the second lowermost barcode and the lowermost one is 2.5h. Considering the severest condition when the laser scanning beam departs from the barcode pattern, the condition in which laser scanning beams can pass through each line of barcode is as follows:
Figure 5.21. (a) Vertical deviation of the laser scanning beam depending on the incident angle of the laser beam. (b) Relationship between laser scanning beams and the six-line barcode position [WAK 00a]
This relation is presented as the detection length versus one-line barcode height in Figure 5.22. Practically usable barcode heights are the dotted and lined areas encircled by the detection length limits shown in the figure. Lmax* is mainly determined by the signal to noise ratio of the signal processing circuits and Lmin* is limited by the size of the scanner apparatus installed with the tilted mirror scanner. In the figure, as the incident angle φ/2 decreases, the usable barcode height extends. For example, when the range above 3 cm of L is allowed, the optimum barcode height extends from 1.4–2.7 mm at φ = 90° to 1.6–3.1 mm at φ = 71°.
Figure 5.22. Detection length versus one-line barcode height [WAK 00a]
5.4.2. Envelope differential composite method
In the DT TBDS, the detection resolution is limited to 0.4 mm because of distortion of the detection signal from an uneven signal change that depends on the bar width. This distortion is due to the detection signals corresponding to narrow bars (black, white, and gray bars) in high-density barcodes decreasing in amplitude to low levels because of the decrease in the amount of laser light reflected from the barcodes. In this section, the TBDS employing an envelope differential composite method (proposed in 2008 [WAK 08]) is shown to provide high barcode densification with long range and high-speed scanning of a great amount of information.
5.4.2.1. TBDS employing the envelope differential composite method
An outline of the envelope differential TBDS using a laser diode scanner is shown in Figure 5.23. The detection method is explained in Figure 5.24. A slightly enveloped line of a detected barcode signal is obtained using an enveloped line detector with a small discharge time constant τ and a reference signal by decreasing the enveloped line intensity to a level with 60% attenuators. The use of the slightly enveloped line is indispensible for suppression of the detection signal distortion in the detection of high-density barcodes. An average signal is obtained by subtracting the reference signal from the original barcode signal with a subtraction gate and amplifying with an amplifier with a gain of 1.3. The amplifier is applied to compensate the decrease in intensity of a barcode signal because of the subtraction of the slightly enveloped line from the original barcode signal. The black level of the average signal is relatively stable and this average signal has a wide enough difference between black and gray levels. Therefore, a black code signal is obtained by comparing the average signal with a threshold VT1.
Figure 5.23. Schematic outline of the TBDS employing the envelope differential composite method [WAK 08]

Figure 5.24. Waveforms illustrating the operation principles of the envelope differential composite method
This method automatically allows the system to maintain a level comparable to the appropriate one depending on the barcode signal.
When using high-density barcodes, a gray signal in the average signal is of small intensity and is not at a stable level. Therefore, to obtain a stable gray code signal, a differential method is applied to the average signal. The average signal is differentiated to extract the average signal waveform’s transition, and the differential signal is compared with threshold voltages VT2 and VT3 employing two level comparators. Narrow comparator-output pulses corresponding to transitions from white to black or gray levels and the reverse are obtained. A gray-black mixed code signal is then obtained by a presetting operation at the preceding rising edge of these comparator-output pulses and a resetting operation at the following rising edge using a preset-reset circuit. Black and mixed code signals are obtained using the same processing circuits as those described in section 5.4.1. Because the system detects a ternary barcode with narrow bars while eliminating signal distortion using the slightly enveloped method and emphasizing the transitions of the barcode signal applying the differential method, the system can steadily detect high-density barcodes.
5.4.2.2. Experimental results
A prototype system for a single-line four character ternary barcode has been developed and tested. The detectable range for a low minimum bar width of 0.3 mm was found to be more than 5.4 cm, which is a wide range (Figure 5.25). This range is 4.5 times greater than that found with the DT method. This result means that correct detection is not mainly dependent on the detection distance, since approximately unbent averaged signals that adapt to any barcode pattern with little distortion are obtained over a wide range by applying the slightly enveloped and differential methods. As the minimum bar width W decreases, the detection signal for a narrow bar becomes small and so the detection range deteriorates. Contrarily, as W increases, the minimum detection length lengthens since the average signal distortion for wide black bars becomes remarkable near the minimum detection length because of the small τ(=7.3 µs) for the enveloped line detector. However, the detection range is almost the same as that used in the DT method, since the average signal distortion diminishes at distant detection lengths because of the short wide-black-bar signal rise time in the average signal. Concerning the scanning speed, the possibility of detection with a high scanning speed (351 scan/s) over seven times that of conventional CCD cameras was confirmed. Thus, the possibility of high-speed detection with a wide detection range was confirmed even when the density of BC was increased to a practical bar-width level of 0.3 mm.
Figure 5.25. Detection distance versus minimum bar width. The number of characters is 4 in addition to the start and stop codes. The scanning speed is 333 scan/s [WAK 08]

5.4.3. Fixed-period delay method
The TBDS employing the envelope differential method has a count-latch memory for delaying the gray-black mixed code signals so as to separate them into gray and black code signals. Because of the distortion of the delayed mixed code signal through the counting period-latch timing instability and the fluctuation of the differentiated signal through the noise contained in the average signal, the detection bar width is limited to nearly 0.3 mm while a practical minimum bar width W = 0.25 mm is needed. A TBDS employing a fixed-period delay (FPD) method was developed in 2010 to provide a longer range and a higher scanning speed while being simple and able to handle much information [WAK 10b].
5.4.3.1. TBDS with a fixed-period delay method
The FPD TBDS using a laser diode scanner is outlined in Figure 5.26. The detection method is explained in Figure 5.27. In this system, the average signal is processed using a nonlinear filter (NLF) to suppress the sharp-edged noise contained in the average signal. The NLF output signal is differentiated to extract the NLF output signal’s waveform. Comparator-output pulses corresponding to the transition from white to black or gray levels and the reverse are obtained by comparing the differential signal with the two thresholds VT2 and VT3. A gray-black mixed code signal is obtained through a presetting operation at the preceding rising edge of these comparator-output pulses and a resetting operation at the following rising edge. The mixed code signal is then delayed for a fixed period td using a shift register to eliminate the delayed signal’s distortion as in the count-latch method. Gray and adjusted black code signals and the decodable signal are obtained by the same operation as described in section 5.4.2. The system does not require complicated image processing and has a simple circuit configuration without causing an unstable delay. Therefore, a miniature TBDS with longer range and higher speed is expected to be realized.
Figure 5.26. Schematic outline of the fixed-period delay TBDS [WAK 10b]
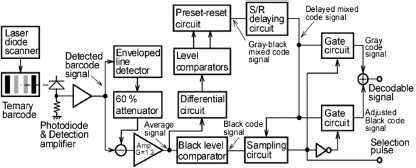
Figure 5.27. Operation principle waveforms of the TBDS using the FPD method [WAK 10b]

5.4.3.2. Experimental results
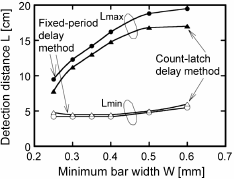
An NLF capable of cutting off high-frequency signals over 2.4 MHz and dropping sharply in gain and clipping the top and bottom sharp-edged signals over 100 kHz has been developed to suppress the sharp-edged noise (Figure 5.28). The unity gain frequency of the OP Amp used in this filter were ~3 MHz. The detection performance of the system using this NLF was examined. The detection distance versus minimum bar width of the system is shown in Figure 5.29, where it is compared with that of the count-latch system (without the NLF). The detectable range for the BC with W = 0.25 mm was increased to a practical range of 5.3 cm, which is 1.8 times longer than that in the count-latch system. The detection range was improved particularly for long distances, where the detection signals are easily distorted, employing a shift-register stable delay for the mixed code signal. Noise suppression was effective in detecting high-density barcodes. It also contributed to the detection range improvement of the BC with W = 0.25 mm; the improvement was about 1 cm.
Figure 5.28. (a) Configuration of a nonlinear filter. (b) Peak-peak output voltage versus frequency. The unity-gain frequency in the OP Amp fT is ~3 MHz. The amplitude of the input sine wave signal is 0.5 V [WAK 10b]
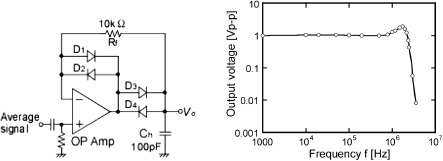
Figure 5.29. Detection distance versus minimum bar width for the TBDS. td =2.5 µs, vs = 333 scan/s [WAK 10b]
In examination of the possibility of high-speed detection, a maximum scanning speed of 417 scan/s, which is 8.3 times the ~50 scan/s achieved with the conventional CCD cameras, was obtained under the practical detection range for W = 0.3 mm. This is because there was no need for complicated image processing. A TBDS with a FPD method was shown to be capable of providing high-speed detection of a high-density barcode with W = 0.25 mm.
5.5. RFID
RFID is an identification technique that does not use light, and thus, it is essentially different from the barcode technologies. The basic idea of this technology was devised to identify aircraft in the World War II era [RFI 04, STE 05]. RFID employs a microwave transmission method using radio waves (950 MHz-2.45 GHz; UHF band) and an electromagnetic induction method using electromagnetic waves (13.56 MHz: shortwave band). At practical levels, radio wave technology and electromagnetic induction using magnetic waves of 2.45 GHz and 13.56 MHz, respectively, have been developed [RFI 04, JAP 03].
5.5.1. Electromagnetic induction technology
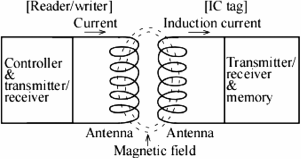
Electromagnetic induction technology using magnetic waves of 13.56 MHz is practical and is characterized by processing a large amount of information. The technology uses a reader/writer to emit electromagnetic waves and an IC tag with an antenna coil and memory to receive the wave and transmit saved information (Figure 5.30). For RFID employing the electromagnetic induction method, IC tags with loop coils are located at a maximum of 1 m from a reader/writer with a loop coil. 13.56 MHz transmitting signals are used to create an induction electromagnetic field. When the modulation signal with read and write instructions is transmitted from the coil of the reader/writer, a modulation signal is induced in the coils of the IC tags. Power is then generated and demodulation achieved on the IC tags. IC tags read data from memory and write data. When the IC tags transmit the modulation signal including read and write results to the reader/writer, the reader detects the modulation signal and demodulates it. ASK (Amplitude Shift Keying) for modulating a transmission signal amplitude, FSK (Frequency Shift Keying) for modulating its frequency, and PSK (Phase Shift Keying) for modulating its phase are employed for the modulation method. This technology is currently used for automatic ticket inspection systems, entering/leaving checking systems, auto matic checkout counter systems in cafeterias, and identification at libraries and of containers in airports. The amount of information is from several bytes to several kilobytes. The transmission speed is several kilobytes to 212 kb/s.
Figure 5.30. Electromagnetic induction method
The transmission directivity of the electromagnetic wave from a reader/writer is gradual, and so, this technology has wide communication ability. This technology also has features capable of writing information into IC tags and reading them in the presence of stains and dust. However, detection is affected by the installation direction of IC tags. This is difficult to use owing to a detection error problem (related to an eddy current effect) in the case of nearby conductive materials such as metals [JAP 03, YAM 05]. Another drawback of this RFID is that the cost of IC tags is high. If these several issues are resolved, the technology will be used in the wide area of FA, physical distribution, electronic ticketing, and security.
5.5.2. Microwave transmission technology
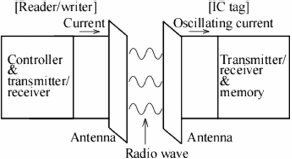
In microwave technology using magnetic waves of 2.45 GHz, a reader/writer transmits data to and receives data from IC tags (Figure 5.31). Antennas for a reader/writer and IC tags are microstrips printed on the circuit substrate, which is shorter than that in the electromagnetic induction system. Microwaves are modulated by transmission data and transmitted to IC tags. IC tags receive these data to demodulate and achieve reading and writing instructions. The linear polarization and circular polarization methods are used for radio waves. In the former method, the transmission and reception direction of radio waves must be adjusted to the oscillating direction of the radio waves. Therefore, there is a limitation placed on the installation of the reader/writer and IC tags. On the other hand, in the latter method, since the electric field direction of radio waves circulates in transmission, there is no limitation to the installation of reader/writer and IC tags.
Figure 5.31. Microwave transmission method
Thus, this technology enables the reader/writer to communicate from several meters with the IC tags. It is appropriate to identify a large section of material. It is possible to have directivity for the reader/writer. It has the same features as described in section 5.5.1, capable of writing information into IC tags and reading them in the presence of stains and dust. It has also the feature of reading IC tags in rough positions. However, this is easily influenced by reflection from metal [YAM 05]. It is also influenced by water and humans through absorption, and its communication distance is thus shortened [JAP 03]. When IC tags of 2.45 GHz are used nearby radio-wave local area network (LAN) units, radio-wave communications are apt to disturb each other. This is the case in controlling the comings and goings of cars in a parking area and product control on assembly and processing lines (FA). In the future, the technology will be used in the package and material management of physical distribution in addition to these areas because it is possible to communicate from long distances.
5.6. Application examples
Serial binary barcode and the two-dimensional BCDSs will be typically used in the following areas because of low-speed identification processing capability.
– Low-speed sorting of parcels in automatic production lines (FA) and automated warehouses;
– Receipt and shipment of goods;
– Package and material management in physical distribution;
– Management of electronic and mechanical components;
– Security control;
– Management of medicine and blood;
– Library book management.
The multi-line-scan 2D binary barcode and the TBDS using a laser scanner will be used especially for high-speed sorting of parcels in automatic production lines and automated warehouses in addition to the areas listed above because of the high-speed identification and handling capability of large amounts of information.
RFID technology can be used in the following application areas because of wide communication capability.
– Electronic ticket inspection systems;
– Checkout counter systems in cafeterias;
– Identification at libraries;
– FA (product control in assembly and processing lines);
– Security control (e.g. entering/leaving checking system);
– Parking control;
– Package and material management in physical distribution;
– Management of livestock;
– Tracing of animal movement.
However, RFID technology is apt to be influenced by water, metal, and radio-wave networks. Therefore, it should be used in an environment without these materials or with the application of new techniques (such as applying an amorphous insulator) that eliminate the influences.
5.7. Concluding remarks
Current technologies and technologies in their research phase for automated identification were described, starting with the historical development of the binary barcode and radio-frequency identification technologies. The main current barcodes — serial binary barcodes and two-dimensional binary barcodes — and related detection technologies of laser scanners and CCD line scanners and CCD/MOS area solid image sensors were introduced. These technologies are currently fully grown and so are predicted to be combined with other technologies such as RFID or to be merged into multi-line scanning with time-sharing laser light emission operation and ternary barcode detection. Multi-line scanning technology employing the TSLE method and pulse modulation drive method of LDs for realizing effective high-speed scanning were also introduced in their research phase. As high-speed scanning technologies of barcodes containing large amounts of information, the ternary barcode and detection techniques of a DT method, an envelope differential composite method, and a fixed-period delay method in their research phases were then described. These research phase techniques are thought to be useful for applications in which high-speed identification is necessary, while investigation into optimal miniaturization of optical systems is needed. Furthermore, current RFID technologies and their future prospects were introduced. In terms of RFID, new technologies to provide solutions to reflection by metal and absorption by water, and interference between radio-wave LAN units and RFID units are hoped to be developed in the near future.
5.8. Acknowledgments
The author would like to thank President Y. Aragane and Dr. K. Watanabe of Tokyo Metropolitan College of Industrial Technology for their support concerning the publishing of this document. He would also like to thank Dr. C. Nagasawa of Tokyo Metropolitan University for his valuable support regarding works on multi-line barcode and ternary barcode detection systems. He would also like to thank Mr. O. Hayashiguchi and Mr. H. Ajiki for discussions throughout research on the multi-line barcode detection system. In addition, he would like to thank Dr. Nagasawa, IEEE, Elsevier, the Japan Society of Applied Physics, and Japan Industrial Publishing Co., Ltd., for their kind permission to reuse figures from previously published materials [HIR 03, WAK 00a, WAK 01, WAK 06a, WAK 08, WAK 10b].
A part of research concerning the multi-line barcode detection technology was supported by Grants-in-Aid for Scientific Research from the Japan Society for the Promotion of Science awarded in FYs 2002 and 2003. A part of work on the ternary barcode detection technology was also supported by the program of Collaboration of Innovative Seeds by the Japanese Science and Technology Agency in FY2009.
5.9. Bibliography
[HIR 01] HIRAMOTO J., Knowledge of Barcode and Two-Dimensional Code, Tokyo, Japan Industrial Publishing Co. Ltd., 2001.
[HIR 03] HIRAMOTO J., Barcode Symbol (1D·2D) Introductory Text, Tokyo, Japan Industrial Publishing Co. Ltd., 2003.
[JAP 03] JAPAN AUTOMATIC IDENTIFICATION SYSTEMS ASSOCIATION, Radio Frequency Identification, Tokyo, Ohmsha Co., 2003.
[LIY 95] LI Y., KATZ J., “Laser beam scanning by rotary mirrors. I. Modeling mirror-scanning devices”, Applied Optics, vol. 34, no. 28, 1995, pp. 6403–6416.
[NIK 03] NIKKEI COMPUTER, IC tag (RFID), Tokyo, Nikkei BP, 2003.
[RFI 04] RFID TECHNOLOGY EDITORIAL DEPARTMENT, All Radio-Frequency IC Tags, Tokyo, Nikkei BP, 2004.
[SEQ 75] SEQUIN H.C., TOMPSETT F.M., Charge Transfer Devices, New York, Academic Press, Inc., 1975.
[STE 05] STELLUTO C.G., The State of RFID Implementation and its Policy Implications, NJ USA, IEEE-USA EBooks, 2005.
[TAD 03] TADOKORO Y., Measurement and Sensor Engineering, Tokyo, Ohmsha Co., 2003.
[WAK 96] WAKAUMI H., AJIKI H., “High-speed two-dimensional bar-code detection system”, The 1996 Conference on Lasers and Electro-Optics Europe, 1996 CLEO/Europe, Hamburg, Germany, 8–13 September 1996, Technical Digest, p. 188.
[WAK 98a] WAKAUMI H., AJIKI H., “Two-dimensional bar-code detection system using a complementary laser light emission method”, Sensors and Materials, vol. 10, no. 1, 1998, pp. 47–61.
[WAK 98b] WAKAUMI H., AJIKI H., “A high-speed 12-layer two-dimensional bar-code detection system with wide-band photo-detection amplifier and balanced raster scanner”, Proceedings of SPIE — The International Society for Optical Engineering, vol. 3491, 1998, pp. 868–872.
[WAK 99] WAKAUMI H., NAGASAWA C., “A three-layer two-dimensional bar-code detection system with time-sharing laser light emission method”, The Transactions of the Institute of Electronics, Information and Communication Engineers C-I, vol. J82-C-1, no. 11, 1999, pp. 650–651.
[WAK 00a] WAKAUMI H., “A high-speed 12-layer two-dimensional bar-code detection system”, Optical Review, vol. 7, no. 1, 2000, pp. 66–72.
[WAK 00b] WAKAUMI H., NAGASAWA C., “A high-speed two-dimensional bar-code detection system with time-sharing laser light emission method”, Proceedings of SPIE — The International Society for Optical Engineering, vol. 4087, 2000, pp. 1253–1258.
[WAK 01] WAKAUMI H., NAGASAWA C., “Development of a two-dimensional bar-code detection system using multi laser diodes with time-sharing light emission operation”, Optical Review, vol. 8, no. 2, 2001, pp. 101–106.
[WAK 04] WAKAUMI H., NAGASAWA C., “High detection resolution for two-dimensional bar-code detection system using masked collimators”, Sensors and Actuators A: Physical, vol. 110, no. 1–3, 2004, pp. 177–181.
[WAK 05] WAKAUMI H., NAGASAWA C., “A ternary bar-code detection system with pattern-adaptable dual threshold”, Eurosensors XII Extended Abstracts, Barcelona, Spain, 11–14 September 2005, p. MP43.
[WAK 06a] WAKAUMI H., NAGASAWA C., “A ternary barcode detection system with a pattern-adaptable dual threshold”, Sensors and Actuators A: Physical, vol. 130–131, 2006, pp. 176–183.
[WAK 06b] WAKAUMI H., NAGASAWA C., “A 2D ternary barcode detection system with a dual threshold”, Proceedings of the 5th IEEE Conference on Sensors, IEEE Sensors 2006, Daegu, Korea, 22–25 October 2006, pp. 1511–1514.
[WAK 07] WAKAUMI H., NAGASAWA C., “A high-speed 2D barcode detection system with a dual threshold method”, International Conference on Control, Instrumentation and Mechatronics Engineering, CIM’07, Johor Bahru, Malaysia, 28–29 May 2007, pp. 378–383.
[WAK 08] WAKAUMI H., “A high-density ternary barcode detection system employing an envelope-differential composite method”, Proceedings of the 7th IEEE Conference on Sensors, IEEE Sensors 2008, Lecce, Italy, 26–29 October 2008, pp. 1076–1079.
[WAK 09] WAKAUMI H., “A high-speed six-line ternary barcode detection system with a dual threshold method”, ICROS-SICE International Joint Conference 2009, Fukuoka, Japan, 18–21 August 2009, Final Papers, pp. 1127–1131.
[WAK 10a] WAKAUMI H., “A six-line ternary barcode detection system with a dual threshold method”, International Journal of Mechatronics and Manufacturing Systems, vol. 3, no. 3–4, 2010, pp. 261–273.
[WAK 10b] WAKAUMI H., “A high-density ternary barcode detection system with a fixed- period delay method”, Eurosensors XXIV, Linz, Austria, 5–8 September 2010, pp. 252–255.
[YAM 05] YAMANAKA T., KONDA J., URATA T., “The effect of eddy-current flux on transmission capacity of RFID antennas embedded in mobile phones”, IEICE Technical Report-EMCJ, vol. 105, no. 439, 2005, pp. 1–6.
1 Chapter written by Hiroo WAKAUMI.