
Chapter 6. Making Beautiful Maps
Over the last few years, thanks in a large part to Google Maps, people have become accustomed to using maps on the Internet. But because of the ubiquity of Google Maps, maps often have the feel of stock photography; they are very familiar and can be perceived as stale and impersonal. Recent developments in online mapping make it possible to use alternative map tiles and graphics, and even to create your own tiles.
This chapter covers various ways to make the look and feel of your map your own. We will show you how to customize markers, the map interface, map tiles, and map pop ups.
Markers
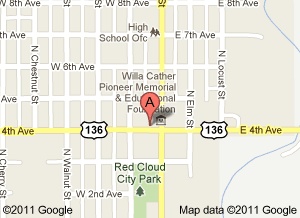
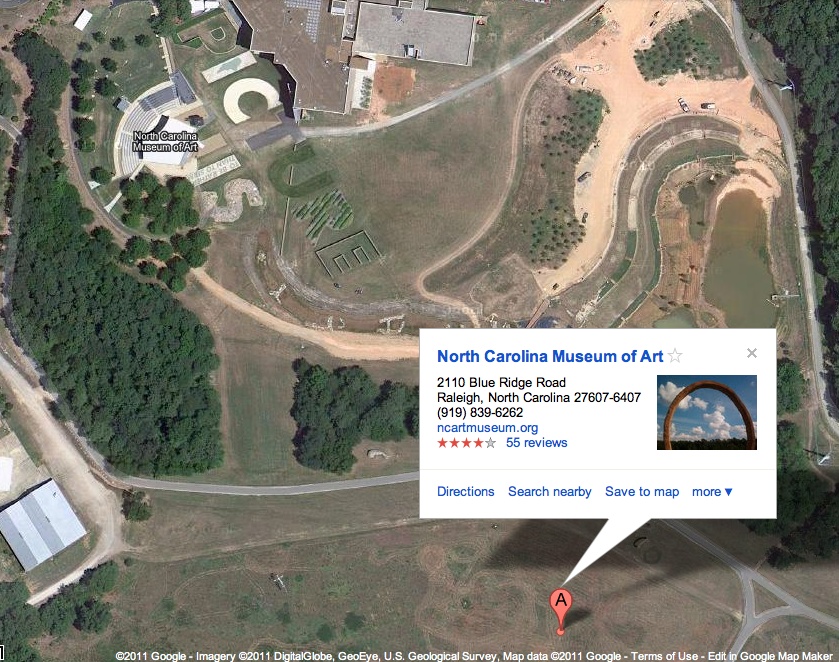
Even if you love the standard Google Map, you probably do not want to use the typical red pin to show the location of everything (see Figure 6-1). Fortunately, some other markers come with Drupal Modules, or alternatively you can add your own custom markers.
OpenLayers Styles
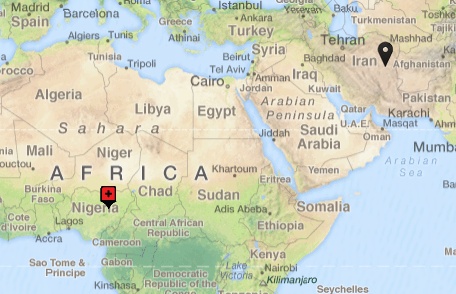
In OpenLayers styles we showed how to add a new color of circular marker. As well as changing the line thickness, color, and opacity, it is possible to use images for markers. When adding a new style at admin/structure/openlayers/styles, you can enter the path to an image file in the “externalGraphic” field. Normally this file will be in your custom module or theme. Some examples of custom images used as markers are shown in Figure 6-2. An example of a vector used as a marker is shown in Figure 6-3.

GMap Markers
The GMap module provides a number of default markers to use in your maps. But if these are not what you need, you will have to manually add new ones. The GMap module searches through the markers folder and all folders within that. It collects data on markers from .ini files and stores that data in a cached object. The module then references that object when creating and displaying maps. We will go through four steps to create a new marker:
Decide on a storage location for our markers and create a folder.
Add a Marker to that folder.
Create a .ini file and add details of our marker to the file.
Regenerate the marker cache.
Note
The GMap module provides documentation using the Advanced Help module. The page on your site that contains help for adding markers is help/gmap/extending.
Marker location
Unfortunately, GMap does not provide a good way to store our
custom marker files. By default, all markers are stored in the GMap
module within the markers
directory. You can add your custom markers to this directory, but you
will run into problems when you upgrade the module: you may forget
that you put custom markers in this directory, and so will
accidentally delete them.
The alternative is to change the variable that designates the directory that contains markers. However, because of the way that the GMap module works, only the markers that are available to use on our map are the markers in this directory. We could change this variable to a directory in our custom module, but then we would no longer have all the default markers that are included in the GMap module.
So, we lose in either case. For this example’s purpose we will use the first method. We will create a new subdirectory in the GMap module called mappingdrupal and will end up with something like the following <path_to_gmap_module>/markers/mappingdrupal/.
Add a marker
Now, we will add the image file for our new marker to this directory. You can download the marker that we created for this exercise from MappingDrupal.com. Save it as <path_to_gmap_module>/markers/mappingdrupal/marker-black.png. Make a note of the dimensions of the image (25×41), since we will need that later.
The .ini file
Next we need to tell GMap a little about our image so that it can put it into maps. Within our new directory, we create an .ini file named mappingdrupal.ini inside the subdirectory we created earlier (the name of the file is not important, but the .ini extension is). The file will be at <path_to_gmap_module>/markers/mappingdrupal/mappingdrupal.ini. This file can contain information about many markers, although in this example we just have one.
Add the following to that file:
; Defaults
[defaults]
;shadow = ""
anchorX = 15
anchorY = 41
infoX = 17
infoY = 6

; Marker sets
[mappingdrupal]
name = "Mapping Drupal Black"
sequence = "marker-black.png"
This defines a marker named Mapping Drupal Black shown on the map in Figure 6-4.

The following explains the different parts:
The
[defaults]section defines some default values for our marker. Defaults are useful when you have dozens of markers the same size. We have commented out theshadowline because this marker does not have a shadow. A shadow is a separate image file that is layered underneath the marker image.anchorXandanchorYdefine how the top left of the image should be offset so that the point of the pin is over the appropriate place on the map. In this case the point of the pin is the center of the bottom of the image, soanchorXshould be half of the width of the image (15 pixels) andanchorYshould be almost the full height of the image (41 pixels).infoXandinfoYare the pixel coordinates relative to the top left of the marker image where the “tail” of a pop up points to. See Theming Pop Ups for more on pop ups.[mappingdrupal]defines the marker set (seesequencebelow to see why it is a set) and is the identifier for the marker.nameis the marker’s text name, used to refer to it in the interface (see Figure 6-5).sequencedefines the marker or markers that are used for this marker set. It is a sequence because we could use multiple images here, such as markers with numbers 1 through 9 on them.
Regenerate marker cache
Finally, we tell GMap to rebuild its marker cache. We can do
this in the interface. Go to admin/config/services/gmap and under the
Regenerate Marker Cache section, click on the
button titled Regenerate. Then you can choose
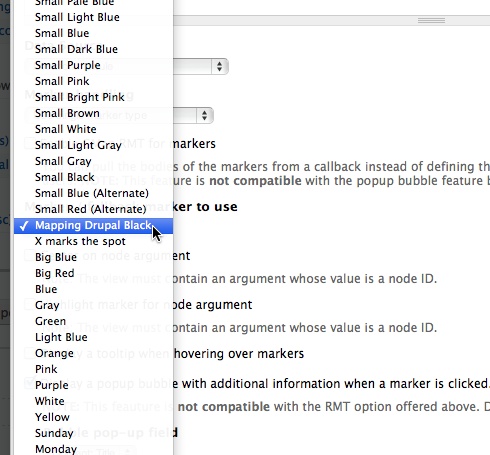
your new marker called Mapping Drupal Black, as
shown in Figure 6-5. When
shown on a map of San Francisco, it will look like Figure 6-4.
Data-Driven Styling
It is possible to change markers or styles based on data in your website. For example, a user can set the color of a marker, choosing a color when adding a new “Drupal User Group” to your website. This data-driven styling is achieved with Marker Handling in the GMap module, and with Attribute Replacement in OpenLayers. Both of these techniques are powered by the Views module, which includes the data needed for styling when doing the database query that creates the data layer for the map.
GMap Marker Handling
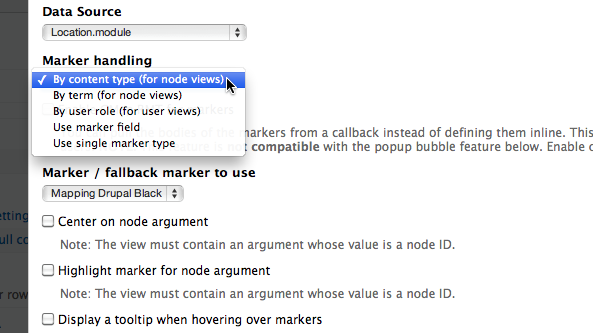
The GMap module uses Views to display Drupal data, as described earlier in Mapping with the GMap Module. The GMap Location module allows you to choose which markers to use based on Taxonomy Terms, Content Types, and User Roles. It is also possible to create a Field in your Content Type that contains a list of marker names. To select a marker for a particular content type, edit the content type and select a marker from the list. To use this setting when creating a map, you need to specify that in the “Marker handling” section of the View, as shown in Figure 6-6.
OpenLayers Attribute Replacement
In the OpenLayers module, it is possible to replace any Style value with data, specifically Views data. To achieve this in the OpenLayers modules, we first have to tell Views that we want to use new some fields, then use a specific syntax to pass the data from the fields to our Style.
To do this, we will add a field to our Drupal User Groups content type from Geofield Module. This field will contain a list of colors. When a user is adding a new Drupal user group, they can choose a color from this list.
As shown in Figure 6-7, create a new field of type Select (Text) and add some colors to the “Allowed values list.” Make this a required field; a missing color will cause errors when displaying the map.

Next, add your new field to the View created earlier in Setting Up an OpenLayers Map. In the Data Overlay View, add your new field to the Field List. Now, if you look in the “Preview” section of the View, you will see a section that looks like Figure 6-8.

Copy ${field_style_color}
from this list of parameters, as this is the
Token that will be replaced with the color for
each Drupal user group that will be shown on the map.
The last step is to update our Style with this new Token value.
Edit the Drupal User Groups style at
admin/structure/openlayers/styles/drupal_user_groups/edit
and change the fillColor field to the
Token that you just copied, ${field_style_color}. Edit the Drupal User
Groups that have been added to your website to choose colors for them
all. Your map should now have colored markers, as shown in Figure 6-9.
This has been a brief example, but enough to show how data associated with content on your website can be used to change styles used on your map.

The Map Interface
Many different interface graphics are used when displaying a map: for instance, the zoom controls or the layer pickers. In the OpenLayers module, we can replace the default graphics with our own. This fairly simple change immediately makes your map more tightly integrated with your site.
OpenLayers Module
In OpenLayers, maps have two settings related to changing the interface graphics, the “Image Path” and the “CSS Location.” The Image Path is the directory where OpenLayers will look for specifically named images to use in the interface. The CSS Location is the path to the CSS file that will be included with the map. Although you could include the CSS for styling your map in one of your Theme’s CSS files, this is not a good idea, because lots of CSS is required for your map; you would end up loading lots of unnecessary CSS on pages that do not have maps.
Note
Both the Image Path and CSS Location are Class level settings, and will affect all subsequent maps on the page. This means that you will not be able to have two maps on the same page with different interface styles.
If you are using the default hosted version of the OpenLayers library, it will look in the following places for images and .css stylesheets:
The default hosted directory of images: http://openlayers.org/api/img/
The CSS located at: http://openlayers.org/api/theme/default/style.css
The styles in this stylesheet often refer to images that are in a subdirectory at http://openlayers.org/api/theme/default/img/
Note
You can download the OpenLayers library directly from openlayers.org and see all the images that are included.
These images and CSS create the default interface for OpenLayers, shown in Figure 6-10.

The best way to go about making your own image set is to start with the defaults from the OpenLayers library. Once you have downloaded and unpacked the library, you should copy the contents of the <OpenLayers_library>/theme/default directory into your Drupal installation (for instance, to sites/all/libraries/mappingdrupal_ol_theme). Next, to simplify things, copy all the images from <OpenLayers_library>/img into the directory sites/all/libraries/mappingdrupal_ol_theme/img/. Now replace images and edit the stylesheet. When you are done, in the OpenLayers map settings, enter the path to your images and CSS.
The map in Figure 6-11 shows the map interface that is soon to be the default for the OpenLayers module. It is a custom set compiled by community members.

Theming Pop Ups
Google Maps popularized the idea of a “pop up” on a map (Google calls this an InfoWindow). A pop up is a speech bubble that appears when a user clicks on a marker; it displays a snippet of information relevant to that place, as shown in Figure 6-12.
GMap Theming
In the GMap module, because of the way it uses Version Two of the Google Maps API, you cannot change what the pop up looks like. However, you do have control over the display of the content that goes into the pop up. GMap uses Views Display for rendering its output, so you can theme it just like any other View. Under the Advanced section in Views, you can see the Theme Information (shown in Figure 6-13). Create one of the .tpl.php files for the Row style output or Field content, such as views-view-fields--drupal-companies--page.tpl.php. Theming views is beyond the scope of this tutorial, but if you have the Advanced Help module enabled, you can access the help page for theming views on your website at /help/views/using-theme.

OpenLayers Theming
The simplest way to change the appearance of the pop up in OpenLayers is to use CSS. If you need to add or alter the markup, you will need to understand JavaScript theming.
The OpenLayers module uses Drupal’s JavaScript Theming method. This is not as powerful as Views theming, because we are limited to using JavaScript rather than PHP, but we can achieve similar results. The following code is what the OpenLayers module uses to theme pop ups:
/**
 * Javascript Drupal Theming function for inside of Popups
 *
 * To override, define: Drupal.theme.openlayersPopup
 *
 * @param feature
 *  OpenLayers feature object.
 * @return
 *  Formatted HTML.
 */
Drupal.theme.prototype.openlayersPopup = function(feature) {
  var output = '';

  if (feature.attributes.name) {
    output += '<div class="openlayers-popup openlayers-tooltip-name">' +
      feature.attributes.name + '</div>';
  }

  if (feature.attributes.description) {
    output += '<div class="openlayers-popup openlayers-tooltip-description">' +
      feature.attributes.description + '</div>';
  }

  return output;
}
To override this theme, you need to define a Drupal.theme.openlayersPopup() method in a
JavaScript file in your module or theme. The Drupal JavaScript API
handbook page explains how to do this (the documentation linked
is for Drupal 6, but it will work for Drupal 7, too).
OpenLayers Pop Up Style
In OpenLayers Module, we saw how OpenLayers allows us to override images used in the map interface; the pop up can also be changed by following those instructions. The pop up is formed from a CSS Sprite image that is named cloud-popup-relative.png. Figure 6-14 shows the image that gets used in the CSS Sprite; the thin outlines are hard to see, but it has several lines that make up edges, corners, and arrows that all get put together to form the pop up.

Figure 6-15 shows a new image to replace to replace the default OpenLayers sprite image. The sprite creates a hard-corned translucent dark pop up. This pop up will soon be the default for the OpenLayers module.
Figure 6-16 shows how this pop up looks on a map.


Map Tiles
Map tiles are small images tiled together to create a map, usually the base layer for a web map. A tileset is a specific set of these images. What tileset you choose can have a drastic effect on the visual nature of your map.
Adding Base Layers to GMap
GMap can be extended to add base layers. This has to be done directly with code. We will not go into great detail here, but will give a short overview.
To add some layer options in the GMap configuration form, we will use
hook_gmap()again (this function was previously explained in Add geolocation options to maps). Inhook_gmap(), for thebaselayersoperation, return an array structured like the following:$layers['Section Name']['layer_id'] = array( 'title' => t('Title of layer'), 'default' => TRUE, 'help' => t('Description of layer'), );Also, within
hook_gmap(), in thepre_theme_mapoperation, usedrupal_add_js()to include the JavaScript that will add the layer to the map.Within the JavaScript file referenced in the previous step, include code similar to the following:
Drupal.gmap.addHandler('gmap',function(elem) {
  var gmap = this;

  obj.bind('bootstrap_options', function() {
    var opts = gmap.opts;
    var layers = gmap.vars.baselayers;

    // Put layers here (??)
    opts.mapTypes.push();
    opts.mapTypeNames.push();
  });
});
Note
The MapBox module has an implementation for adding base layers to GMap and will be the easiest way to do this, though it is still fairly undocumented. The MapBox module is discussed more at MapBox.
Adding Base Layers to OpenLayers
Adding base layers is one of the greatest strengths of the OpenLayers module. The module comes with support for Google Maps, OpenStreetMap, Bing, Yahoo!, CloudMade, and more. OpenLayers is intended as (and is) a versatile way of displaying almost any sort of geographical data.
Available Base Layers
Of the many base layers available, four will be discussed here: Google Maps, MapQuest, CloudMade, and MapBox, as well as a tool that lets you create your own map tiles.
Google Maps tiles
Both GMap and OpenLayers support the various Google Maps tilesets. These are fairly well known; they include a Road set, a Satellite set, a Hybrid of the two, and a Physical set that shows elevation and contour, shown in Figure 6-17.
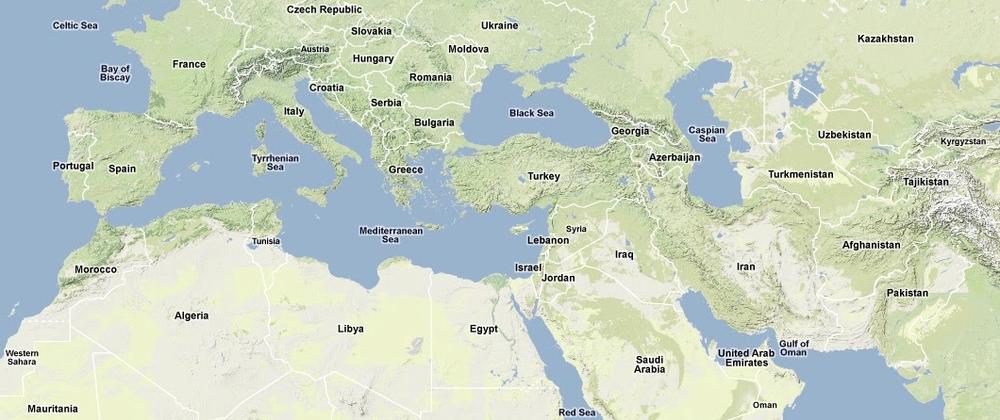
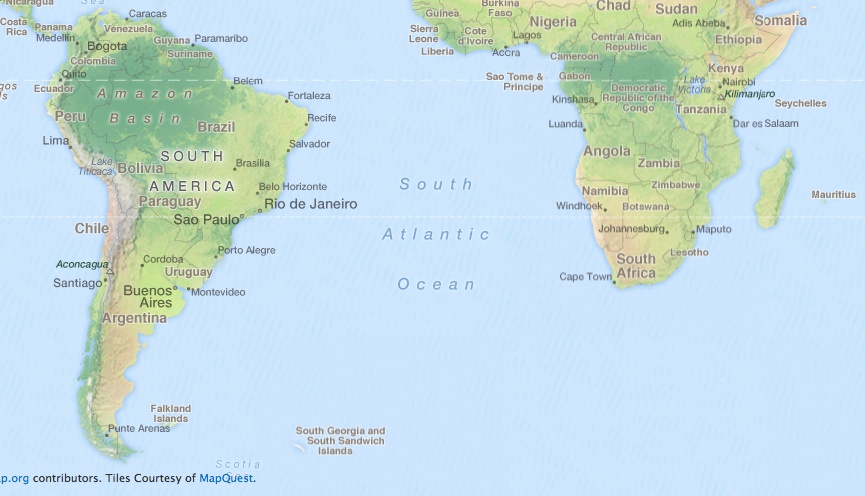
MapQuest tiles
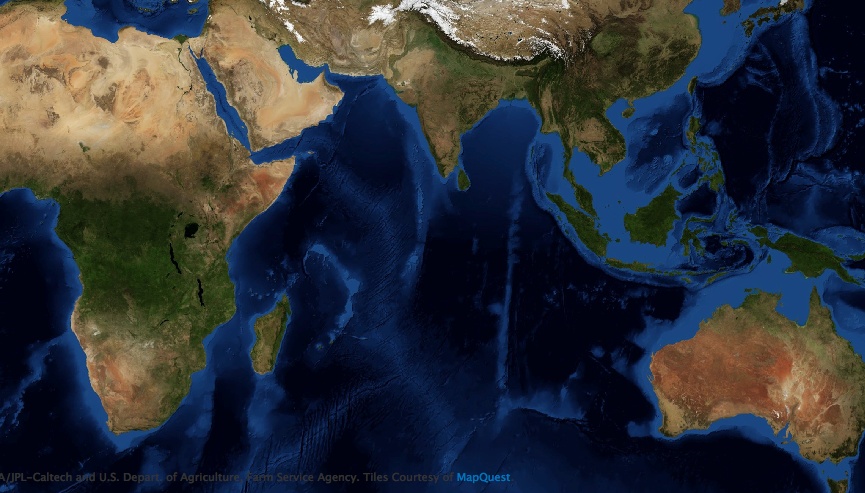
MapQuest was one of the original organizations doing web mapping. Recently they partnered with OpenStreetMap, an online, open (wiki-style) map of the world. MapQuest has released a free tileset based on the OpenStreetMap data (shown in Figure 6-18), as well as a free tileset of satellite imagery (shown in Figure 6-19). You can find out more about these and the associated API in their developer documentation.
In upcoming versions of the OpenLayers modules, these new layers will be available by default.
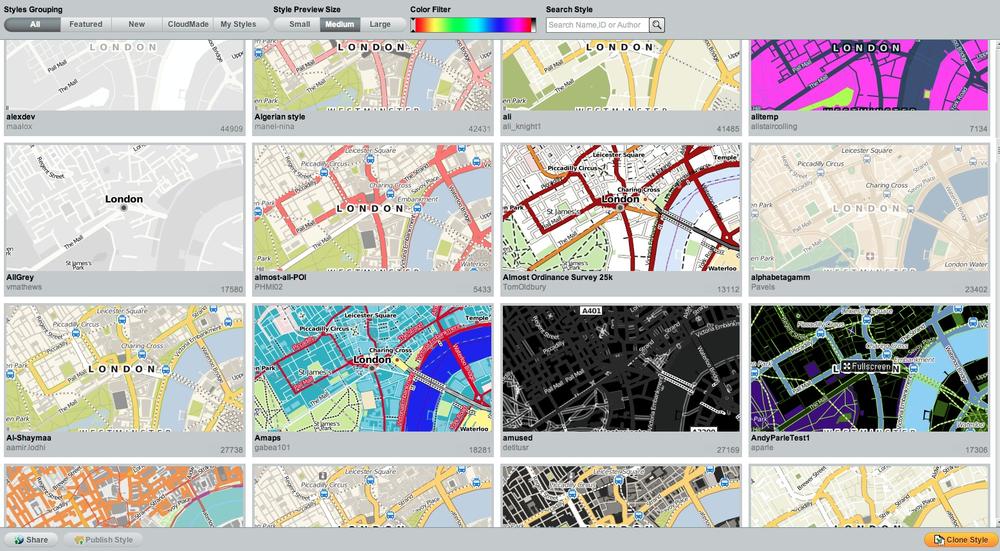
CloudMade
CloudMade provides location-based services. Their Style Editor is a free web-based tool for creating custom tilesets from OpenStreetMap data. This is the easiest and most inexpensive way to get custom map tiles for your site. Figure 6-20 is a screenshot from the Style Editor showing some of the styles that people have created.
The OpenLayers module has support for CloudMade tilesets. This requires downloading another library, but there are instructions within the module at admin/structure/openlayers/layers/settings.
MapBox
Development Seed is a company that has made a suite of open source mapping tools, known as MapBox. Among their many great contributions to the open source world, a lot of their tilesets are available to use for free. You can browse them at tiles.mapbox.com.
There is a MapBox module that provides base layers to both GMap module and the OpenLayers module. With the OpenLayers module, you can add a wide selection of MapBox base layers from the many tilesets, while the GMap integration only provides a select few. The MapBox module also provides a number of nice icons for use in the OpenLayers module.
TileMill
TileMill is part of the MapBox suite of tools. TileMill makes it possible to create custom tilesets from your own data sources. It runs as an application on Mac OS X or Ubuntu, takes in multiple data sources, and uses a CSS-like style language called Carto to create tilesets that can then be exported for use in your maps. TileMill is a great way to make tilesets, but it does not include a way to host them to use in web applications. Serving tilesets is handled by another MapBox product called TileStream, or by configuring your own very fast map tile server.