
Chapter 4. Displaying Maps
Few Drupal sites are built without the Views module, and Views underlies much of the mapping in Drupal. This chapter explores different ways of displaying spatial data, primarily through the Google and OpenLayers JavaScript mapping APIs, but also using lists, tables, and data feeds.
There are two main choices for displaying maps in Drupal: the OpenLayers JavaScript library and the GMap module’s implementation of the Google Maps API. This chapter covers how to create maps with both modules.
The GMap module is the more straightforward to understand. It contains code to pull data from your Drupal website and display it on a Google Map. Continuing our earlier example, this will be a map of Drupal companies.
The OpenLayers module for Drupal does a similar thing, but it uses a different JavaScript API to display the map, and it allows you to choose from several different base tile sets, including sets from Google Maps, OpenStreetMap, Bing, and more. Continuing our earlier example, this will be a map of Drupal user groups.
Mapping with the OpenLayers Module
OpenLayers is a JavaScript library for displaying maps. It is a free, open source project, which means that you can use the maps you create in any way that you want and that, if you’re so inclined, you can help improve the code. At the most basic level, the OpenLayers module allows maps to be displayed on a Drupal website. The module provides a way to configure the appearance of maps and to choose behaviors for the maps. The display of the data on the map is done by integrating with the Views module. Each of these steps is outlined below.
Basic Configuration of OpenLayers
Download the latest release of the OpenLayers module for Drupal 7 to your site’s contributed modules directory. You will also need the Chaos Tools module and the Views module, as they are required by OpenLayers.
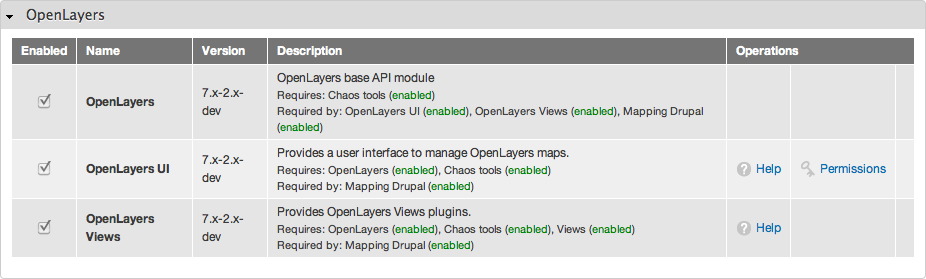
Enable all three modules that come with OpenLayers (Figure 4-1). The OpenLayers UI module provides a user interface for configuring your maps and can be disabled once work is complete on your site. The OpenLayers Views module integrates OpenLayers with the Views module. The Chaos Tools module, Views module, and Views UI module must also be enabled.
Configure permissions for OpenLayers by following the “Permissions” link on the Modules page, or by going directly to the Permissions page at admin/people/permissions. There is only one permission, “Administer OpenLayers,” which should only be given to trusted administrators. You do not want normal users of your site to change the appearance and behavior of the maps on your site.
Setting Up an OpenLayers Map
In the OpenLayers module, a map is a combination of three things: layers of data (such as map tiles or markers), styles that are applied to some of these layers, and behaviors (interactions that are attached to maps). OpenLayers uses the Views module in two ways: first to create data layers to display on the map, as a map is a set of layers, and second to display the final map as a block or page. We start this exercise by creating a layer using Views, and then will use Views again to create the final map.
Note
This is the place where most users get confused with the OpenLayers module, and rightfully so. The module uses Views twice. This means that you will have to go to the Views interface, back to the OpenLayers interface, and back to Views. The goal is to change this in future versions of the OpenLayers module so that the user experience is more intuitive.
OpenLayers layers
Layers can be put into two categories. The base layer contains the underlying map, which is usually the tile set, such as MapQuest’s Open Aerial tiles; there is only one of these displayed at a time. The overlay layers contain all your added data, such as icons marking businesses, compost facilities, or public toilets; there can be multiple overlay layers displayed on one map. The base layer can be thought of as the map layer; the overlay layer can be thought of as the data layer.
The OpenLayers module comes with several map layers, including four types of Google map tiles (normal, satellite, hybrid, and physical), three types of Yahoo! map tiles (satellite, street, and hybrid), three types of Bing map tiles (satellite, street, and hybrid), and four types of OpenStreetMap tiles. You can see these on the Layers Configuration page at admin/structure/openlayers/layers. Other Drupal modules, such as MapBox, add even more map layers. Adding further map layers is discussed in Chapter 6. For the examples in this chapter we are just going to use one of the default map layers.
The data overlays are more critical to understand because this is where you will be able to add your Drupal data and then put it on a map. By utilizing Views, you can create many data overlays to go on a single map. Data overlays can also come from an external source, such as a KML file, but this is managed through the OpenLayers Layers interface.
To summarize, there are four stages in creating a map using the OpenLayers module:
Create a data layer to receive the user-supplied data about Drupal groups.
Create a Map to display this data layer over a map layer.
Create a page to display your Map.
Tweak the Styles and Behaviors to beautify how your data appears on your Map.
The most common way to create a data layer is using the Views module. In Geofield Module we created some Drupal user groups. We will use Views and OpenLayers to display all of these on a map.
From the Views page add a new view, admin/structure/views/add.
For the “View name,” enter
Drupal groups.Tick the “Description” checkbox and enter this description:
Drupalgroupsdatalayer for a map. This description will show up later in the user interface and is helpful there.In the “Show” section, leave “Content” selected from the first drop-down. Change the “type” drop-down to “User Group.” Leave the “sorted by” drop-down set to “Newest first.”
Note
If you do not see the “User Group,” make sure that you created this content type in Geofield Module.
Uncheck the “Create a page” checkbox. At this stage we are creating a data layer, not a page or block.
Click the “Continue & edit” button.
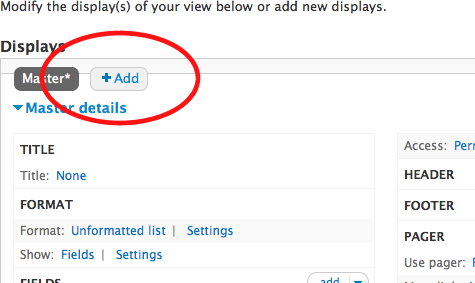
Click the “Add” button (circled in red in Figure 4-2) and click on “OpenLayers Data Overlay” from the list of displays that shows.
Enter a Title for the View, such as
Drupal groups data layer.Note
The Views module allows you to create multiple displays in one View. In this example we are only creating an “OpenLayers Data Overlay” display. Other displays include a Page, Block, or Feed. If you have multiple displays in one view, you need to be aware of whether you are changing a setting for one display or all displays. For simplicity, we will only have one display in this View, so for this and all following settings the changes that you make can be applied to all displays.
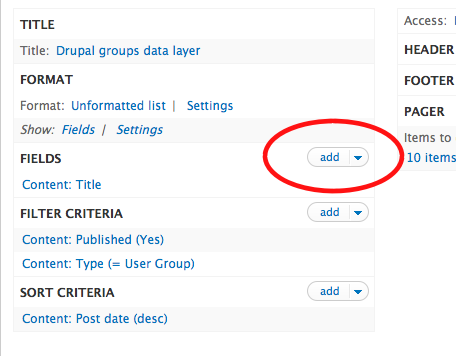
In the “Fields” section of the Views configuration form we need to add the fields that contain the location information for our “User Group” content type. This is the information that OpenLayers is going to extract from our stored data, interpret, and use to display the data layer of our map. Click the “add” button (circled in red in Figure 4-3).
On the list of fields that shows, find the field labelled “Content: Group location” and select it, then click the “Add and configure fields” button, shown in Figure 4-4.
On the “Configure field” screen that comes up next, untick the “Create a label” option. Tick “Exclude from display.” All other settings can stay the same. Click the “Apply (all displays)” button to save the configuration.
Back on the “OpenLayers Data Overlay details” screen we need another field. This time, add the “Content: Body” field. This one will contain the user-supplied descriptions of all our Drupal user groups. Click the “Apply (all displays)” button to save the configuration.
By adding these fields, we now have all the data necessary to create our data layer, but OpenLayers does not yet know which of these fields contain the spatial data and which fields are merely descriptive.
Back on the “OpenLayers Data Overlay details” screen under the “Format” heading, click on the “Unformatted list” link (circled in red in Figure 4-5). Select the only radio button available, “OpenLayers Data Overlay,” and click the “Apply (all displays)” button to save.
On the Style options screen that loads next, change the “Map Data Sources” drop-down to WKT. In the “WKT Field” that appears below, select the field that contains the WKT value, “Group location.” In “Title Field,” choose “Title” in the drop-down. In “Description Field,” select “Body.” Click the “Apply (all displays)” button to save.
Back on the “OpenLayers Data Overlay details” screen again, one last setting to change is the pager. The Views module is normally used to create lists of content, such as “my 10 most recent blog posts.” The pager is used there to let people read through all the older blog posts. For our map, we want to show more than 10 places. Under “Items to display,” click the “10 items” link. On the screen that loads, change “Items to display” to
100. Click the “Apply (all displays)” button to save.Note
See Browser Capabilities on why to avoid displaying an unlimited amount of data.
The View that creates the data layer for the map is now complete. Click the “Save” button on the top right.


There is now a data layer—but as yet, no underlying map! So now, finally, we must choose some mapping to form our map (base) layer and combine it with our data layer to form a Drupal “Map.”
OpenLayers Maps
The next step is to create what the OpenLayers module refers to as a “Map.” To distinguish this from all the other things referred to as maps, however, we will refer to it as a “Map Configuration,” because this is where we will define the combinations of layers, styles, and behaviors that constitute a map. On the OpenLayers Maps page at admin/structure/openlayers/maps there are several default Map Configurations: one that comes with the OpenLayers module, and two that are added by the Geofield module. We will create a new Map Configuration to display our “Drupal user group” data layer.
Note
In OpenLayers in Drupal 6, Map Configurations were called “presets.”
Add a new Map Configuration at admin/structure/openlayers/maps/add.
Enter a name for this Map Configuration. It will be used internally by Drupal to store the Map Configuration, so it should be lowercase characters, numbers, or underscores (e.g.,
user_groups).Enter a title and a description for this Map Configuration. These will be seen by you in other parts of the user interface, so make them descriptive (e.g.,
Drupal user groupsandA map of Drupal user groups around the world).Most of the other values in this “General information” tab should remain with the default values, though change the Height to
500px. It is often useful to leave the width atauto; this will make the map fill the full width of the page. We will cover the use of the “Image Path” and “CSS Path” in The Map Interface.Before clicking the “Save” button, take a look at the configuration options in the other tabs on this page. First click on “Center & Bounds.”
The “Center & Bounds” tab contains the defaults for the centerpoint and zoom level for the map, and provides a map interface to change these values. Leave these at the default values for now.
The “Layers & Styles” tab is where OpenLayers pulls in the data layer that was created in OpenLayers layers. The “Map Projection” and “Display Projection” sections can be left unchanged. From the list of “Base layers” (the map layers), choose “OSM Mapnik” as the default and tick the “Enabled” checkbox.
Still in the “Layers & Styles” tab, go to the “Overlay layers” table. Tick the “Enabled” and “Activated” checkboxes for your “Drupal groups data layer” layer.
Note
You set the title of the “Drupal groups data layer” in Step 8.
Finally, click on the “Behaviors” tab. This configures the interactive elements of the map. We will discuss the various behaviors in more detail in Exploring OpenLayers Behaviors, but for now just tick the Attribution, Popup, Navigation, and PanZoomBar checkboxes. When you click the Popup checkbox, an option will open below to select which layer will contain the data for the pop ups. Here, tick the box labelled “drupal_groups_openlayers_1,” as this is the data layer that was enabled in the previous step.
Note
You may have to save the Map Configuration before the “drupal_groups_openlayers_1” option shows under the Popup behavior. This is because the interface is not AJAX-enabled and does not know yet that you have enabled that layer.
Click the “Save” button to save your Map Configuration. It will now show in the list of OpenLayers maps at admin/structure/openlayers/maps.
We now have a Map Configuration and need a way to display the map on a page of the website.
Using Views to display an OpenLayers map
The simplest way to display an OpenLayers map uses the Views module. The View creates a page that uses the Map Configuration from the previous step .
Add a new View at admin/structure/views/add.
For the “View name,” enter
Map of Drupal groups.Leave the “Create a page” checkbox ticked, and leave the default Page title and Path.
Change the first “Display format” drop-down to “OpenLayers Map”.
Click the “Continue & edit” button.
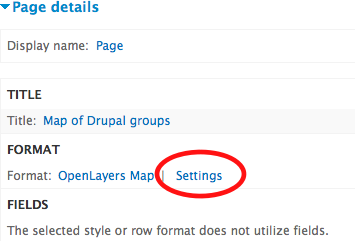
On the “Page details” configuration page, under “Format” (circled in red in Figure 4-6), click on the “Settings” link.
In the “Map” drop-down, select “Drupal user groups.” Click the “Apply (all displays)” button to save.
Click the “Save” button on the top right to save the view and create the map display.
On the right of the page is a “view page” button. Click this to view the map. It should look something like Figure 4-7. You can see an example of this online.
If you click on the marker for one of the Drupal user groups, you will see a pop up open with the name of the group and its description. If the person adding the information has entered a long description, the pop up will be really wide and might go off the edge of the map, as shown in Figure 4-8. If you want a long description, it is possible to make the pop up narrower using CSS. Alternatively, the description can be truncated in the View configuration. Edit the view that contains the data layer at admin/structure/views/view/drupal_groups/edit. Under the “Fields” section, click on “Content: Body (Body).” Expand the “Rewrite results” section. Tick the “Trim this field to a maximum length” checkbox. In the “Maximum length,” enter
60(which will be 60 characters). Leave all other options as their defaults. Click the “Apply (all displays)” button to save. Click the “Save” button on the top right again.


We now have a map that displays Drupal user groups, but an orange dot on the map isn’t a particularly inspiring representation of a Drupal group. The next section will allow customization of styles on the map.
OpenLayers styles
OpenLayers styles provide a way to determine the appearance of geographic data: for example, the color and thickness of lines, the radius of points, or the opacity of polygons. Styles can be icons or markers, as well as simple geometric shapes like a circle. The OpenLayers module comes with some default styles, which can be seen at admin/structure/openlayers/styles. We will add a new style of dot to display the Drupal user groups that are being displayed on our map.
From the OpenLayers module’s “Styles configuration” page, add a new Style at admin/structure/openlayers/styles/add.
Enter a name for this Style. The name will be used internally by Drupal to store this Style, so should be lowercase with underscores instead of spaces (e.g.,
blue_dots).Enter a title for this Style (e.g.,
Blue dots).There are lots of choices for Styles, each explained on the page. Most can be left unchanged for this example. The first one to change is “pointRadius.” Our Drupal user groups show as points on the map, so we need to set the size in pixels for the point. Set it to
5.“fillColor” is the hexadecimal value of the color that will fill the circle where there is a Drupal user group. Enter
#53b0eb, which is the shade of blue used commonly in Drupal’s branding.“strokeColor” is the color of the line surrounding the circle. Enter
#0678be, a darker blue.“strokeWidth” is the thickness of the line surrounding the circle. Leave this at
1.“fillOpacity” determines if the circle that represents the user group location is transparent or opaque. The default value of 1 means that it is opaque. Change this to
0.8to make it slightly transparent.“strokeOpacity” determines the opacity or transparency of the line surrounding the circle. Leave this at
1.Save this new Style. It will show in the list of OpenLayers styles at admin/structure/openlayers/styles.
To use this Style on the map of Drupal user groups, we need to update the Map Configuration from OpenLayers Maps.
From the OpenLayers module’s maps page at admin/structure/openlayers/maps, click the edit link for the “Drupal user groups” map.
Click on the “Layers & Styles” tab.
In the “Overlay Layers” table, find the “Drupal groups data layer.” Change the Style drop-down to the “Blue dots” style that you just created.
Click the “Save” button.
View your map again. You should see a blue dot instead of the orange dot. If you click on the marker, it will switch back to orange. This is because there are three states for a marker:
- Default style
What you see when the map loads
- Select style
What you see when you click on a marker
- Temporary style
What you see when adding a new marker to a map
To change the Select style for this map, edit the “Drupal user groups” Map Configuration again at admin/structure/openlayers/maps/user_groups/edit and go back to the “Layers & Styles” tab. At the very bottom of the page is the “Select style” drop-down. Change this to “Blue dots.” You could also create a new Style and use it here instead.
You have now used the Geofield, OpenLayers, and Views modules to create a map that displays Drupal user groups around the world. The Style of the points of the map has been customized to be more appropriate than the default colors. The configuration of fields has been tidied up so that the pop ups do not fall off the edge of the map.
Exploring OpenLayers Behaviors
We have already explored some behaviors: in OpenLayers Maps four Behaviors were chosen while setting up the Map Configuration. Behaviors in OpenLayers are map interactions such as pop ups, zoom controls, editing, and viewing fullscreen. They can be added via the user interface in Drupal and can be extended by other modules.
Note
Behaviors are a concept for how to use JavaScript in Drupal that has been best practice since Drupal 6. More details can be found on the JavaScript handbook page.
The OpenLayers Behaviors are all described on the Map Configuration page. Edit the User groups map that was created earlier at admin/structure/openlayers/maps/user_groups/edit and click on the “Behaviors” tab. There are lots of really useful Behaviors that come with the OpenLayers module, too many to describe here. Explore all the different Behaviors on your map and see how they work. Some of the most useful ones include:
- Tooltip
This can be used to display the title of a node when someone moves their mouse over a marker on a map.
- Fullscreen
This provides a button that expands the map to the full size of the user’s browser.
- Layer Switcher
Using Views, you can create several layers that show different but related information. When configuring the map, you can enable several such data layers, and several base layers (e.g., a Bing street map and a Google Satellite map). All of these layers will be controlled by a layer-switching widget, and users can turn them on and off.
- Cluster
See Browser Capabilities for a description and rationale for clustering. OpenLayers comes with its own JavaScript clustering script. The OpenLayers examples site provides a good demonstration of how to configure this Behavior.
- Geolocate
The latest version of the OpenLayers library takes advantage of HTML5 geolocation, as supported by most modern browsers, especially on smartphones and tablets. Users are prompted to allow the web page to access their location; then the map is updated to center on that location. A demonstration is on the OpenLayers examples site. This Behavior was added in version 2.11 of OpenLayers, so if you see the warning, “Dependency not found: OpenLayers.Control.Geolocate,” this is because you are using an older version of the OpenLayers JavaScript library. That can be changed at admin/structure/openlayers.
Creating custom Behaviors is covered in Chapter 5.
Advanced OpenLayers Configuration
On the OpenLayers configuration page at admin/structure/openlayers you may have noticed a setting for where the OpenLayers.js file is located. By default the OpenLayers module will use a JavaScript file hosted on openlayers.org. This works, but in most cases it is better to host the file yourself both for speed and reliability.
Download the latest stable release of the OpenLayers JavaScript library from openlayers.org. Alternatively, you can check out the code from the OpenLayers subversion repository.
Extract the .zip or .tar.gz file to your Drupal site, typically to a libraries directory inside the site’s folder.
Update the OpenLayers configuration in your website at admin/structure/openlayers with the new location of the OpenLayers JavaScript file:
sites/all/libraries/OpenLayers-2.10/OpenLayers.js.
While doing the steps above, you may have noticed that the OpenLayers JavaScript library is huge, and the OpenLayers.js file that is loaded to display a map is almost 1 MB. Once you have finished building all of your maps for a site, you can recompile this file to exclude all the Behaviors that are not needed. The library that you downloaded from http://openlayers.org/ contains a Python script and instructions inside the build directory. Further instructions are in the OpenLayers module in docs/CUSTOMIZATION.txt.
Creating an OpenLayers Map Layer from KML
In OpenLayers layers a data layer was created using the Views module. An alternative is to use a static KML file to create the data layer. KML was introduced in Data Types. Using a KML file to generate the data layer will usually be faster than using the Views module because the spatial data does not need to be queried from the database.
Find a KML file that you would like to display on your map; for example the USGS list of the world’s largest earthquakes. Download this file and add it to your site. In this example, we’ve put it inside a custom module called “mappingdrupalexercises.” Because this file will be loaded through JavaScript, most web browsers will block the file if it is not on the same website as the map that you are creating.
From the OpenLayers module’s layers configuration page, add a new layer at admin/structure/openlayers/layers/add.
Click on KML in the list of layer types.
Enter the path of the KML file as the URL:
sites/all/modules/custom/mappingdrupalexercises/LargestWorldEarthquakes.kmlEnter an ID for this layer (for example,
usgs_earthquakes).Enter a title and description, then save your new KML layer. It should show up on the list of layers at admin/structure/openlayers/layers.
Follow the instructions in OpenLayers Maps to create a new Map Configuration, choosing your earthquake layer in the “Layers & Styles” tab.
Follow the instructions in Using Views to display an OpenLayers map to display the map, choosing the Map Configuration that you just created.
You should end up with a map that looks something like Figure 4-9.

Mapping with the GMap Module
The GMap module integrates Drupal with the Google Maps API to display maps. One of its strengths is that it is faster and simpler than using the OpenLayers API to display Google Maps. The drawback is that you are then committed to using just Google Maps. Switching to another source would require big changes to your code and data. Google Maps are not open source; they come with restrictions. However, for many purposes they are free to use.
Note
If you are going to build a site that relies on Google Maps, it is worth reading and understanding the usage limits and terms of service.
Basic Configuration
The basic configuration of the GMap module was covered in Extending the Location module with the GMap module, so if you have been following through the examples, this module should already be installed and enabled.
Integrating with Views
Unlike the OpenLayers module, GMap does not require two separate displays, so creating a map is a little simpler. Just as it was when using the OpenLayers module, the maps are created using the Views module. In this example, we will use the GMap and Views modules to create a map of “Drupal companies.” We created the “Drupal companies” content type earlier in Adding geographic data to a node with the Location module.
Download and install the Views module, including the Views UI module if you do not already have these set up for your site.
From the Views page, add a new view at admin/structure/views/add.
For the “View name,” enter
Drupal companies.Tick the “Description” checkbox and enter the description
MapofDrupalcompanies.In the “Show” section, from the first drop-down leave “Content” selected. Change the “type” drop-down to “Drupal Company.” Leave the “sorted by” drop-down set to “Newest first.”
Note
If you do not see the “Drupal Company” item in the drop-down, make sure that you created this content type in Adding geographic data to a node with the Location module.
Leave “Create a page” checked. This is the page that will contain the map. In the “Display format” section, change the first drop-down to “GMap.” Change the second drop-down to “fields.” Change “Items to display” to
100.Note
See Browser Capabilities on why to avoid displaying an unlimited amount of data.
Click the “Continue & edit” button.
All the basic configuration has been done to create a map. Click the “Save” button on the top right.
Click the “view page” button on the right to see the map, which will be at /drupal-companies. As shown in Figure 4-10, the default map is very small and shows an unhelpful part of the world, unless your Drupal companies are in southern Europe and northern Africa. If you drag the map around, you should see the locations that you added to the map.
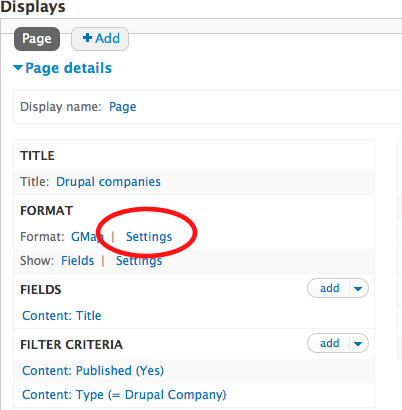
Edit the view again. In the “Format” section, click the “Settings” link next to “Format: GMap” as shown in Figure 4-11.
The reason the map is small and centered on Spain is because of the macro that is being used for this View, which is currently set to
[gmap
          ]
. The concept of a macro in the GMap module was introduced in Extending the Location module with the GMap module. Using the instructions from there, create a macro that will make the map fill the width of the page. It should be something like:[gmap zoom=2 |center=27.9944,4.9218 |width=100% |height=400px |control=Small |type=Map]
Enter this value into the “Macro” field on the Style options screen for the map view.
The next field is “Data source.” For this example, it should be left set to “Location.module,” but it is possible to change this if you need to select specific fields that contain the latitude and longitude. This makes it possible to use the GMap module in conjunction with the Geofield module, or with a content type that has latitude and longitude fields added in some other way.
The “Marker handling” field gives some options to choose which markers will be used on the map. For this example it could be left with the default “Use single marker type.” The other options provide ways to have different markers representing different information on the map:
- By content type
To use markers by content type, configure the markers at admin/config/services/gmap_location. When configuring a location field for a content type at admin/structure/types/manage/drupal-company/fields/field_company_location, a particular style of marker can be chosen. This marker will then be used when a node of that content type is displayed on a map.
- Use marker field
This advanced configuration requires a field on a content type that matches the markername of a marker. The markernames can be found in the .ini files contained in the markers folder inside the GMap module.
With “Use single marker type” selected, the “Marker / fallback marker to use” field defaults to “Drupal.” Change this to whatever marker you like, such as “Small Light Gray.”
There are some more advanced choices on this form, but the last two checkboxes provide some useful Behaviors that can occur when people interact with the map. Tick the “Display a tooltip when hovering over markers” checkbox and select “Content: Title” to have the company name show when the user moves their mouse over a marker. Tick the “Display a popup bubble with additional information when a marker is clicked” checkbox and select “Content: Title” to have the company name show when a user clicks on a marker.
Click the “Apply (all displays)” button to save the configuration.
The view that creates the map is now complete. Click the “Save” button on the top right. The map should look something like Figure 4-12.
Having the same information show up both on hover and in the pop up bubble is not very useful. We can improve this by adding a second field to the view so as to display the body of the node (the description of the Drupal company).
Edit the map view again. In the “Fields” section, click the “add” button. Select “Content: Body” from the list of available fields and click “Add and configure fields.” Click the “Apply (all displays)” button to save the configuration.
Go back to the GMap settings for the view, as described in Step 10. Change the “Bubble pop-up field” drop-down to “Content: Body.” Click the “Apply (all displays)” button to save the configuration. Click the “Save” button on the top right to save these changes to the map. Clicking on a marker on the map should now display a more useful pop up bubble, as shown in Figure 4-13.


We have now used GMap and Views to create a map that displays all content of a particular type (Drupal businesses) with customized markers and useful information when hovering or clicking on a marker.
Other Ways of Displaying Spatial Data
Sometimes a map is not the most useful way to display spatial data. You may want to present information as a list, either on its own or alongside the same data on a map. Or it may be necessary to create an external feed so that your data can be pulled out into another service, such as Google Earth or a different website. Because maps made in Drupal are generally built using the Views module, it is a fairly simple process to output data in other formats.
Spatial Data in Tables and Lists
Foursquare on a mobile device is an example where it is more useful to have a list of nearby venues such as cafes, parks, or airports. Continuing with our example of upcoming Drupal events, it may be useful to see a list of events sorted by date, rather than a map of all of them. With the Views module, both of these are just List Views of the Map Views that we created earlier.
On the Views page, add a new View.
For the “View name,” enter
Upcoming events.Enter a description of
A table of upcoming events.In the “Show” section, leave “Content” selected from the first drop-down. Change the “type” drop-down to “Event.” Change the “sorted by” drop-down to “Unsorted.”
Leave “Create a page” checked. This is the page that will contain the table of events. In the “Display format” section, change the first drop-down to “Table.” Change “Items to display” to
100.Click the “Continue & edit” button.
In the “Fields” section, click the “add” button. From the list of available fields, select “Content: Event date” and click “Add and configure fields.” In the “Choose how users view dates and times” field, select the “Medium” format. You could create custom date formats using the link below that field, but this is not necessary. Click the “Apply (all displays)” button.
In the “Fields” section, click the “add” button. Select “Content: Event location” from the list of available fields and click “Add and configure fields.” Click the “Apply (all displays)” button.
In the “Fields” section, click the “add” button. Select “Content: Body” from the list of available fields and click “Add and configure fields.” Change the “Label” field to
Description. Expand the “Rewrite Results” section. Tick the “Trim this field to a maximum length” checkbox. Enter100as the maximum length. Leave the “Trim only on a word boundary” and “Add an ellipsis” checkboxes ticked. Again, click the “Apply (all displays)” button.Below the view configuration form is a preview of the table that you are creating. The header of the table displays the field labels, but the header for the event name is missing. To fix this, click on the “Content: Title” link in the “Fields” section. Tick the “Create a label” checkbox. Enter
Eventin the “Label” field. Click the “Apply (all displays)” button.To make a more useful interface, we can take advantage of some of the geographic information that is associated with these events. A list of countries will be added to the page, which people can use to find events just in a particular country. From the “Filter criteria” section click the “add” button. From the list of available filters select “Content: Event location (field_event_location:country)” and click the “Add and configure filter criteria” button. Tick the “Expose this filter to visitors, to allow them to change it” checkbox. Change the “Label” field to
Event country. Leave the “Operator” settings with the default values. Click the “Apply (all displays)” button.The events now need to be sorted by their date. From the “Sort criteria” section click the “add” button. Select “Content: Event date (field_event_date)” from the list of available sort criteria and click the “Add and configure sort criteria” button. Leave “Sort ascending” selected. Click the “Apply (all displays)” button.
The user might select a country such as Antarctica that has no events, so we could provide some text for when this happens. The “Advanced” section of the view configuration form has a “No results behavior” section. Here, click the “add” button. Select “Global: Text area” from the available behaviors. Click the “Add and configure” button. In the main text field, enter some text like
There are no events listed in that
          country
. Click the “Apply (all displays)” button.Click the “Save” button on the top right to create the view. It should look something like Figure 4-14.

The example above is a fairly simple one, and there are many other things that can be done with Views. A list or table view can be attached to a map view using a Views attachment, so that users can see a list of locations below the map.
Proximity is a useful piece of data to have. If you are using the Location module, its Views integration includes a proximity field (how close is this place to another place), a proximity filter (show me only things that are within 10 miles of this place), a proximity argument (like a proximity filter that can have the location changed through code), and sort handlers (do you want to see the nearest or furthest places first). There is also support for calculating the proximity to post codes, although this is only supported for a few countries and requires post code data to be loaded into your database. This process is outlined in the INSTALL.txt file of the module and on the Location handbook page.
There is work in progress on an OpenLayers Proximity module for Drupal 7. This will provide an Exposed Filter that will allow a user to enter their location and see a list of nearby content with distances.
Creating Feeds
In Creating an OpenLayers Map Layer from KML, a KML file was taken from an external source and displayed on a map. With Drupal it is easy to create a KML file like this for other sites to use. The KML module integrates with both the Location and Geofield modules; it just requires a latitude and longitude field. This example will extend the View created in Spatial Data in Tables and Lists to create a KML file that includes Drupal events that people have added to the website, such as meetups, happy hours, and conferences.
Download and install the latest stable release of the KML module. There is no permissions change or other configuration needed for this module.
Edit the Upcoming events view at admin/structure/views/view/upcoming_events/edit.
At the top of the page click the “+ Add” button and add a “Feed.”
The fields in this Feed Display will be different from the fields in the Page Display that we created before. The Title field will no longer be a link, because we do not have any particular need to bring people to our event details page. More importantly we need to include the latitude and longitude fields in this Display. Be sure to override the fields, otherwise the Page Display (the table we created earlier) will be changed, too.
In the Fields section, edit the Title field. At the top of that screen, change the “For” drop-down from “All displays” to “This feed (override).” In the “Rewrite results” section, untick the “Output this field as a link” checkbox.
Add a new field, “Content: Event geo.” In the configuration for this field, add a label of
Longitude. In the “Formatter” drop-down, change to “Longitude only.” Leave the “Format” as “Decimal degrees.”Repeat the previous step, setting the label and formatter to Latitude.
On the Feed details page, change the Format from “RSS Feed” to “KML Feed.”
On the “Feed: Style options” screen, the “Field Usage” section is where the XML elements for the KML file are matched with fields in the Drupal View. Set the Name to “Content: Title,” the Description to “Description,” the Longitude to “Longitude,” and the Latitude to “Latitude.” Change the Filename to
drupal-events. Click the “Apply” button to save.In the Feed settings section, update the path to
drupal-events.kml.All of the other view settings will be inherited by the KML feed from the Page display, and can be left unchanged. Save the changes to the View.
You can now download the KML file at /drupal-events.kml (or the path you set for the feed). The KML file can be viewed in Google Earth or uploaded to many different mapping services.
The Views module has caching that can be configured in the Advanced section of the Views interface. One fast and efficient way to display maps in Drupal is to create a KML file in Views, which is automatically cached; pulling that KML file into a map in OpenLayers is outlined in Creating an OpenLayers Map Layer from KML.