
Now that you've had a taste of how to create, change, and operate on geometry, it's time to discuss how we make the geometry appear on the map or scene. Symbology is part of cartography, which is both an art and science. ArcGIS Runtime has the ability to symbolize all of the geometries we have just discussed using cartographic principles, because it is essentially a GIS. With ArcGIS Runtime, you can make the map appear in such a manner that is visually pleasing, while at the same time scientifically correct.
After the geometry is created and validated, you will need to consider the following visual variables for quantitative data: Spacing, Size, Perspective, Height, and Color (hue, lightness, and saturation). For qualitative data, it's necessary to consider Orientation, Shape, Arrangement, and Color (hue). ArcGIS Runtime has the ability to consider all of these when you assign a symbol to a feature or graphic. First, we will go over simple symbols for the geometry we created earlier. Then, we'll discuss how to render entire layers, such as the FeatureLayer class. Finally, we'll discuss special kinds of symbol for military symbology.
For simple symbols, we will utilize Esri.ArcGISRuntime.Symbology. In the examples that follow, we will take some of the geometries we used earlier, create a graphic, and then assign the symbol and geometry to the graphic. Once the graphic is created, we will then add it to GraphicsLayer or GraphicOverlays so that it will be shown. We can also assign geometry to a Feature class, and then add that to FeatureLayer, but we will reserve editing the FeatureLayer class for Chapter 9, Editing Feature (Online and Offline). Here is the symbology object model diagram:
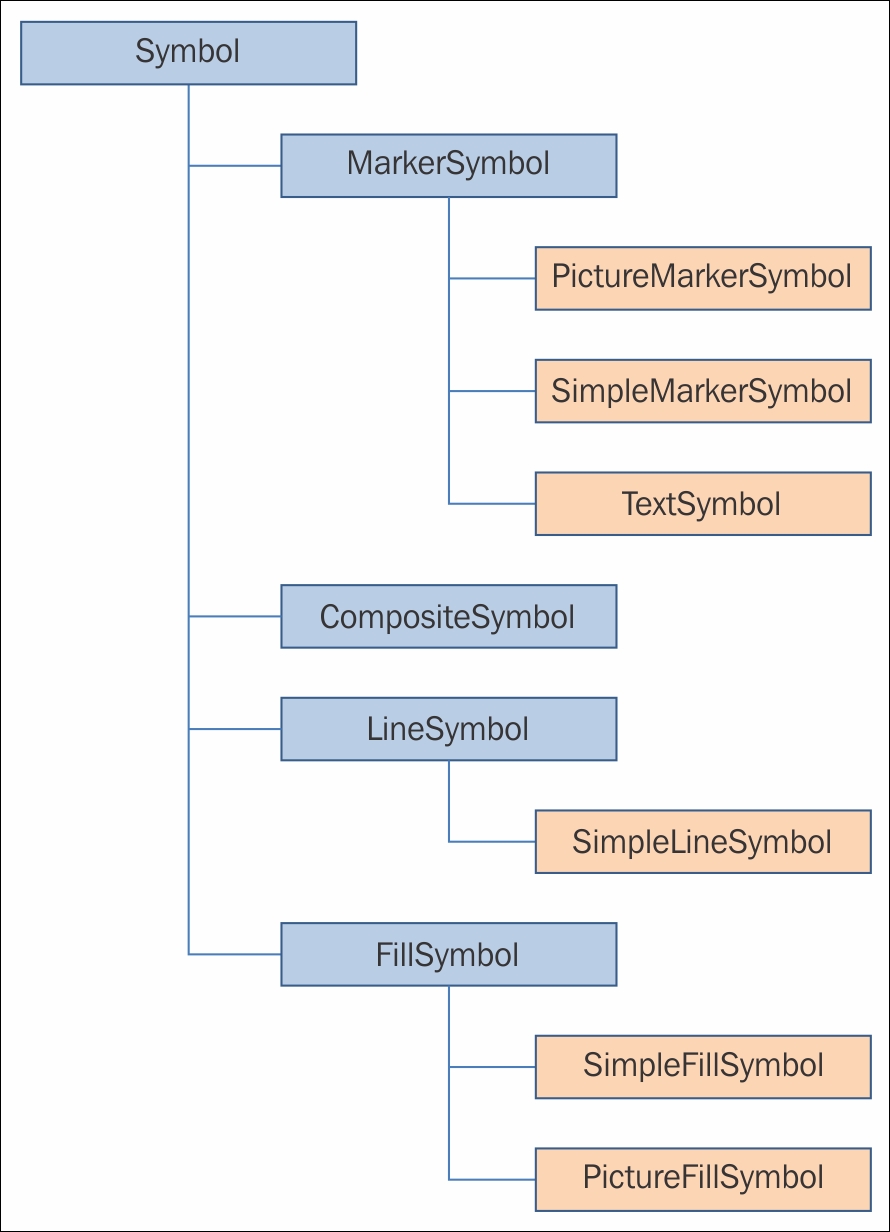
Symbol is an abstract class that all subclasses inherit from. From this point, each kind of symbol under Symbol applies to certain kinds of geometry. For example, a MarkerSymbol subclass applies to MapPoint, LineSymbol applies to the Polyline geometry, and FillSymbol applies to the Polygon geometry. A Symbol class has some useful methods, such as CreateSwatchAsync, which returns an image of the symbol. It has three overloads. Just like Geometry, there's also a FromJson and a ToJson method.
A MarkSymbol subclass is a subclass of Symbol and a base class of PictureMarkerSymbol, SimpleMarkerSymbol, and TextSymbol. The MarkerSymbol subclass has four properties worth noting: Angle, AngleAlignment, XOffset, and YOffset. With these properties, you can set the angle of the symbol, the angle alignment type, and the offset of the symbols in x and y coordinates. With AngleAlignment, you have the option to set whether the MarkerSymbol subclass rotates depending on how GraphicsLayer is configured with GraphicsLayer.RenderingMode.
The most basic kind of marker symbol you will apply to point geometry is the SimpleMarkerSymbol class. With this class, you can set the color, outline color, size, and style. Here's an example of creating a Graphic class, creating a MapPoint class, setting MapPoint to Graphic, creating SimpleMarkerSymbol, setting that to the Graphic class, and then adding the Graphic class to the GraphicsLayer class, which is then added to Scene:
// create a graphics layer
GraphicsLayer graphicsLayer = new GraphicsLayer();
graphicsLayer.ID = "My Layer";
graphicsLayer.InitializeAsync();

// Create a new Graphic.
Graphic myGraphic = new Graphic();

// Create a new MapPoint using the data from the text file and set it // to the Graphics geometry.

MapPoint myMapPoint = new MapPoint(0, 0, 10000,
    Geometry.SpatialReferences.Wgs84);
myGraphic.Geometry = myMapPoint;

// Create the symbol
SimpleMarkerSymbol myMarkerSymbol = new SimpleMarkerSymbol();
myMarkerSymbol.Size = 25;
myMarkerSymbol.Color = Colors.Red;
myMarkerSymbol.Style = SimpleMarkerStyle.Diamond;
myGraphic.Symbol = myMarkerSymbol;

// Add the Graphic to the GraphicLayer.
graphicsLayer.Graphics.Add(myGraphic);
this.sceneView.Scene.Layers.Add(graphicsLayer);
The Style class can be set using SimpleMarkerStyle, which has these options: circle, cross, diamond, square, triangle, and an X.
A PictureMarkerSymbol class is used to add a picture on a graphic's or feature's point geometry. The most important methods in this class are SetSource and SetSourceAsync. An example of its use is provided here:
System.Uri myPictureUri = new System.Uri("http://static.arcgis.com/images/Symbols/Transportation/SkullandCrossbones.png");

// Create a new PictureMarkerSymbol based on the static image and set // a few properties.
PictureMarkerSymbol pictureMarkerSymbol = new
    PictureMarkerSymbol();
pictureMarkerSymbol.SetSourceAsync(myPictureUri);
pictureMarkerSymbol.Angle = 30;
pictureMarkerSymbol.Height = 30;
pictureMarkerSymbol.Width = 30;
In this example, the image comes from an online image source, but it could easily have come from an image in your Visual Studio project.
The TextSymbol class allows you to place text on a graphic or feature. Of interest with this class are Font and
Text. Obviously, you need to give the TextSymbol class a string with the Text property, but you also need to provide a font. Here is an example using a graphic:
TextSymbol textSymbol = new TextSymbol();
textSymbol.Text = "Some Text";
textSymbol.Color = System.Windows.Media.Colors.Black;

SymbolFont symbolFont = new SymbolFont();
symbolFont.FontFamily = "Courier New";
symbolFont.FontSize = 25;
symbolFont.FontStyle = SymbolFontStyle.Normal;
symbolFont.FontWeight = SymbolFontWeight.Bold;
textSymbol.Font = symbolFont;

Graphic graphic = new Graphic();
graphic.Geometry = myMapPoint;
graphic.Symbol = textSymbol;
graphicsLayer.Graphics.Add(graphic);
The LineSymbol class is a base class that allows you to apply symbols to polylines and the outlines of polygon features and graphics. It contains one subclass called SimpleLineSymbol, which can be used like this:
SimpleLineSymbol sls = new SimpleLineSymbol()
{
    Color = Colors.Black, Style = SimpleLineStyle.Solid, Width = 2
};The FillSymbol class is a base class of SimpleFillSymbol. It is implemented like so:
SimpleFillSymbol sfs = new SimpleFillSymbol()
{
   Color = Colors.Red,
   Style = SimpleFillStyle.Solid
};
With this symbol, you can set the style to BackwardDiagonal, Cross, DiagonalCross, ForwardDiagonal, Horizontal, Null, Solid, and Vertical. You can also set the outline of the polygons using a SimpleLineSymbol, by way of the Outline property.
As the name implies, CompositeSymbol allows you to combine symbols of any kind to form a new symbol. Here is an example:
CompositeSymbol compositeSymbol = new CompositeSymbol();
compositeSymbol.Symbols.Add(markerSymbol);
compositeSymbol.Symbols.Add(textSymbol);
For 3D, there are several additional symbols in Esri.ArcGIS.Runtime.SceneSymbology. At the end of the previous chapter, we discussed ModelMarkerSymbol but didn't provide any details on how it works. As a refresher, here's the code snippet:
ModelMarkerSymbol mms = new ModelMarkerSymbol();
mms.SourceUri = "Data/M-14/M-14.obj";
mms.Scale = 1000;
The first thing that you have to do is set the source, which in this case is a Wavefront Object file, using a relative path. The Data directory must be located where your .exe file is located. The ModelMarkerSymbol class supports the following 3D model formats:
- Collada (
.dae) - Blender 3D (
.blend) - 3ds Max 3DS (
.3ds) - 3ds Max ASE (
.ase) - Wavefront Object (
.obj) - Industry Foundation Classes (IFC/step) (
.ifc) - XGL (
.xgl,.zgl) - Stanford Polygon Library (
.ply) - AutoCAD DXF (
.dxf) - LightWave (
.lwo) - LightWave Scene (
.lws) - Modo (
.lxo) - Stereolithography (
.stl) - DirectX X (
.x) - AC3D (
.ac) - Milkshape 3D (
.ms3d) - TrueSpace (
.cob,.scn)
You can also create the simple 3D marker symbols with BoxMarkerSymbol, ConeMarkerSymbol, DiamondMarkerSymbol, SphereMarkerSymbol, and TetrahedronMarkerSymbol. For lines, you can create SceneLineSymbol and TubeLineSymbol. All of these symbols inherit from SceneSymbol. The 3D marker symbols allow you to set the heading, pitch, and roll. Here is an example of BoxMarkerSymbol:
BoxMarkerSymbol box = new BoxMarkerSymbol();
box.Width = 10000;
box.Height = 10000;
box.Depth = 10000;
So far, we've been creating symbols for single graphics, but if you have a FeatureLayer class with thousands or even millions of records (features) in it, you obviously won't create a graphic for each object you want on the map. A renderer allows you to apply the same symbol to all features in the layer in one go, and it is much faster. See the following diagram:
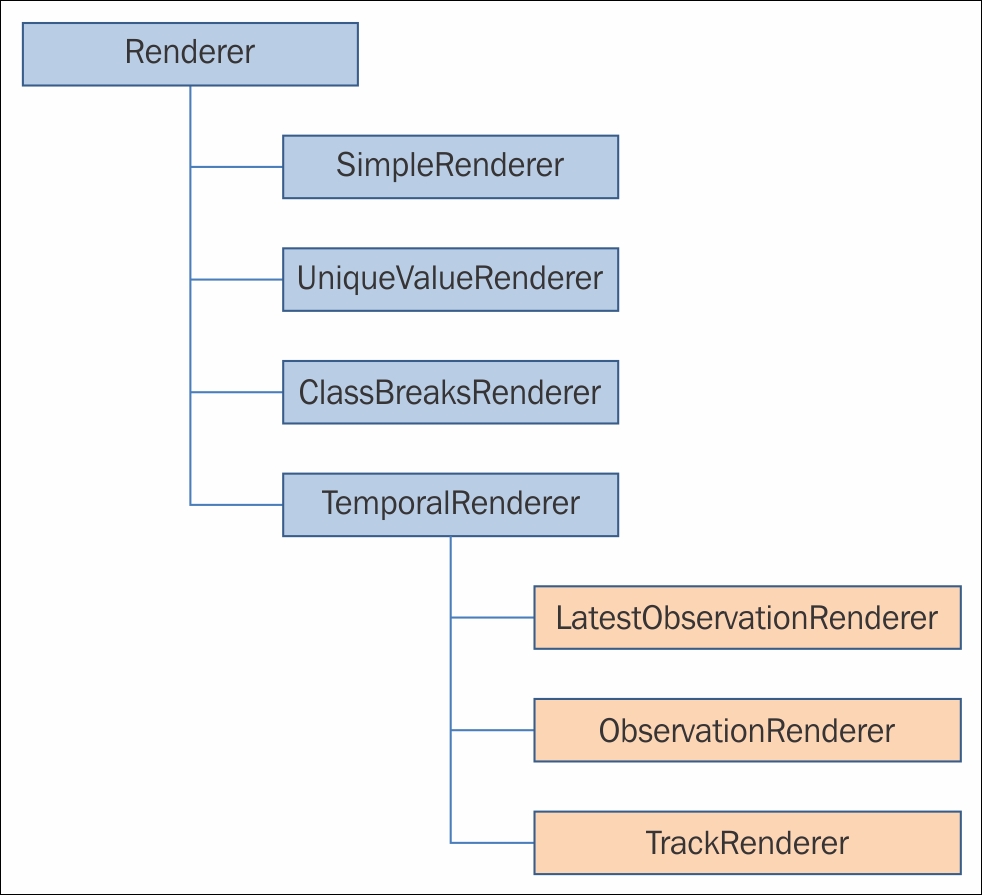
The preceding diagram shows the object model diagram for renderers. The Renderer class is the base class and like other abstract classes in this chapter, it has the ability to convert to and from JSON. It also has the ability to set SceneProperties.
If you want to apply the same symbol to every feature in the layer, SimpleRenderer is the solution. Here is an example that will show the locations of all the offices of Esri around the world:
Uri uri = new Uri("https://services.arcgis.com/P3ePLMYs2RVChkJx/ArcGIS/rest/services/Esri_Offices/FeatureServer/0");

FeatureLayer featureLayer = new FeatureLayer(uri);
featureLayer.InitializeAsync();

SimpleMarkerSymbol markerSymbol = new SimpleMarkerSymbol();
markerSymbol.Size = 25;
markerSymbol.Color = Colors.Red;
markerSymbol.Style = SimpleMarkerStyle.X;

SimpleRenderer simpleRenderer = new SimpleRenderer();
simpleRenderer.Symbol = markerSymbol;

featureLayer.Renderer = simpleRenderer;
this.sceneView.Scene.Layers.Add(featureLayer);In order to use
UniqueValueRenderer, you will need to know something about your data. For example, take a look at the following service:
Scroll down the page and note that it has a field named SUB_REGION. This field divides the U.S. into a set of regions. In order to classify this layer based on a unique value, we first need to know the name of the subregions. Scroll down to the bottom of the page and click on the Query link. Next, in the Where clause, enter 1=1. Then, in Out Fields, enter SUB_REGION. Lastly, at the bottom of the page, click on Query (GET). You will now see the SUB_REGION names. There are nine distinct names, which we can now use to build a renderer for this layer. The following lines show the code in its entirety:
Uri uri = new Uri("https://services.arcgis.com/P3ePLMYs2RVChkJx/ArcGIS/rest/services/USA_States_Generalized/FeatureServer/0");

FeatureLayer featureLayer = new FeatureLayer(uri);
featureLayer.InitializeAsync();

UniqueValueRenderer uniqueValueRenderer = new UniqueValueRenderer();
uniqueValueRenderer.Fields.Add("SUB_REGION");

// Define the outline Symbol
SimpleLineSymbol blackSolidOutline = new SimpleLineSymbol();
blackSolidOutline.Color = System.Windows.Media.Colors.Black;
blackSolidOutline.Style = SimpleLineStyle.Solid;
blackSolidOutline.Width = 1;

// Group #1
UniqueValueInfo uiqueValueInfo1 = new UniqueValueInfo();
uiqueValueInfo1.Values.Add("Pacific");
SimpleFillSymbol smpleFillSymbol1 = new SimpleFillSymbol();
smpleFillSymbol1.Color = System.Windows.Media.Colors.Yellow;
smpleFillSymbol1.Outline = blackSolidOutline;
smpleFillSymbol1.Style = SimpleFillStyle.Solid;
uiqueValueInfo1.Symbol = smpleFillSymbol1;
uniqueValueRenderer.Infos.Add(uiqueValueInfo1);

// Group #2
UniqueValueInfo uniqueValueInfo2 = new UniqueValueInfo();
uniqueValueInfo2.Values.Add("West North Central");
SimpleFillSymbol smpleFillSymbol2 = new SimpleFillSymbol();
smpleFillSymbol2.Color = System.Windows.Media.Colors.Blue;
smpleFillSymbol2.Outline = blackSolidOutline;
smpleFillSymbol2.Style = SimpleFillStyle.Solid;
uniqueValueInfo2.Symbol = smpleFillSymbol2;
uniqueValueRenderer.Infos.Add(uniqueValueInfo2);

// Group #3
UniqueValueInfo uniqueValueInfo3 = new UniqueValueInfo();
uniqueValueInfo3.Values.Add("West South Central");
SimpleFillSymbol smpleFillSymbol3 = new SimpleFillSymbol();
smpleFillSymbol3.Color = System.Windows.Media.Colors.Red;
smpleFillSymbol3.Outline = blackSolidOutline;
smpleFillSymbol3.Style = SimpleFillStyle.Solid;
uniqueValueInfo3.Symbol = smpleFillSymbol3;
uniqueValueRenderer.Infos.Add(uniqueValueInfo3);

// Group #4
UniqueValueInfo uniqueValueInfo4 = new UniqueValueInfo();
uniqueValueInfo4.Values.Add("East North Central");
SimpleFillSymbol smpleFillSymbol4 = new SimpleFillSymbol();
smpleFillSymbol4.Color = System.Windows.Media.Colors.White;
smpleFillSymbol4.Outline = blackSolidOutline;
smpleFillSymbol4.Style = SimpleFillStyle.Solid;
uniqueValueInfo4.Symbol = smpleFillSymbol4;
uniqueValueRenderer.Infos.Add(uniqueValueInfo4);

// Group #5
UniqueValueInfo uniqueValueInfo5 = new UniqueValueInfo();
uniqueValueInfo5.Values.Add("Mountain");
SimpleFillSymbol smpleFillSymbol5 = new SimpleFillSymbol();
smpleFillSymbol5.Color = System.Windows.Media.Colors.Brown;
smpleFillSymbol5.Outline = blackSolidOutline;
smpleFillSymbol5.Style = SimpleFillStyle.Solid;
uniqueValueInfo5.Symbol = smpleFillSymbol5;
uniqueValueRenderer.Infos.Add(uniqueValueInfo5);

// Group #6
UniqueValueInfo uniqueValueInfo6 = new UniqueValueInfo();
uniqueValueInfo6.Values.Add("New England");
SimpleFillSymbol smpleFillSymbol6 = new SimpleFillSymbol();
smpleFillSymbol6.Color = System.Windows.Media.Colors.Cyan;
smpleFillSymbol6.Outline = blackSolidOutline;
smpleFillSymbol6.Style = SimpleFillStyle.Solid;
uniqueValueInfo6.Symbol = smpleFillSymbol6;
uniqueValueRenderer.Infos.Add(uniqueValueInfo6);

// Group #7
UniqueValueInfo uniqueValueInfo7 = new UniqueValueInfo();
uniqueValueInfo7.Values.Add("East South Central");
SimpleFillSymbol smpleFillSymbol7 = new SimpleFillSymbol();
smpleFillSymbol7.Color = System.Windows.Media.Colors.Green;
smpleFillSymbol7.Outline = blackSolidOutline;
smpleFillSymbol7.Style = SimpleFillStyle.Solid;
uniqueValueInfo7.Symbol = smpleFillSymbol7;
uniqueValueRenderer.Infos.Add(uniqueValueInfo7);

// Group #8
UniqueValueInfo uniqueValueInfo8 = new UniqueValueInfo();
uniqueValueInfo8.Values.Add("Middle Atlantic");
SimpleFillSymbol smpleFillSymbol8 = new SimpleFillSymbol();
smpleFillSymbol8.Color = System.Windows.Media.Colors.Gray;
smpleFillSymbol8.Outline = blackSolidOutline;
smpleFillSymbol8.Style = SimpleFillStyle.Solid;
uniqueValueInfo8.Symbol = smpleFillSymbol8;
uniqueValueRenderer.Infos.Add(uniqueValueInfo8);

// Group #9
UniqueValueInfo uniqueValueInfo9 = new UniqueValueInfo();
uniqueValueInfo9.Values.Add("South Atlantic");
SimpleFillSymbol simpleFillSymbol9 = new SimpleFillSymbol();
simpleFillSymbol9.Color = System.Windows.Media.Colors.Orange;
simpleFillSymbol9.Outline = blackSolidOutline;
simpleFillSymbol9.Style = SimpleFillStyle.Solid;
uniqueValueInfo9.Symbol = simpleFillSymbol9;
uniqueValueRenderer.Infos.Add(uniqueValueInfo9);

featureLayer.Renderer = uniqueValueRenderer;
this.sceneView.Scene.Layers.Add(featureLayer);
In this code sample, a FeatureLayer class was created and the UniqueValueRenderer class was instantiated with the field name. After that, a SimpleLineSymbol subclass was created to give the states a solid black outline. Next, each region was symbolized using a UniqueValueInfo class by adding value names to it. There are nine unique regions in total. The UniqueValueInfo class allows us to assign a SimpleFillSymbol class, and then add that to the Infos collection of UniqueValueRenderer. The last step was then just to apply the renderer to the layer, and then add the layer to SceneView.
The ClassBreaksRenderer class renderer allows you to render data based on numerical data groups. For example, if you are trying to render the states layer based on income, you would create a ClassBreakInfo class for each range of the values. For example, to create a ClassBreakInfo class for a range of $50,000 to $100,000, you'd do something like this:
ClassBreakInfo classBreakInfo = new ClassBreakInfo();
classBreakInfo.Minimum = 50000;
classBreakInfo.Maximum = 100000;
SimpleFillSymbol simpleFillSymbol2 = new.SimpleFillSymbol();
simpleFillSymbol2.Color = System.Windows.Media.Colors.Green;
simpleFillSymbol2.Outline = blackSolidOutline;
simpleFillSymbol2.Style = SimpleFillStyle.Solid;
classBreakInfo.Symbol = simpleFillSymbol2;
classBreaksRenderer.Infos.Add(classBreakInfo);
ArcGIS is ideal for military applications because it provides support for military symbols. Located in Esri.ArcGISRuntime.Symbology.Specialized, these classes allow you to render both the
Department of Defense (DoD) MIL-STD-2525C and
North Atlantic Treaty Organization (NATO) APP-6B symbols. These symbols are used for situation awareness and command and control, which support secure communications. Troops can send messages by either voice or data transmission over a network using a message, which can then be displayed on a map.
Here's an example of adding MessageLayer, and then sending a message using a unique Symbol ID Code (SIC):
private async void DisplayMilitaryMessage()
{
    MessageLayer messageLayer = new
        MessageLayer(SymbolDictionaryType.Mil2525c);
    messageLayer.ID = "Military Messages";
    await messageLayer.InitializeAsync();
    this.mapView.Map.Layers.Add(messageLayer);

    // create a dictionary to hold message properties
    var messageProps = new Dictionary<string, string>();

    // define message properties (property name, value)
    messageProps.Add("_type", "position_report");
    messageProps.Add("_action", "update");
    messageProps.Add("_id", "e0ba16ac-cddd-4595-845e-32ca4177d080");
    messageProps.Add("_control_points", "71.753904, 36.588076");
    messageProps.Add("_wkid", "4326");
    messageProps.Add("sic", "SHGP-----------");
    messageProps.Add("uniquedesignation", "TARGET2");

    // create the message using the properties
    var message = new Message(messageProps);
    // make sure it's loaded before using it
    await  this.mapView.LayersLoadedAsync(new[] { messageLayer });
    bool success = messageLayer.ProcessMessage(message);
}
The resulting symbol would look something like this:

As you can see in the code, the message has to be in a certain format, which includes the _type, _action, _id, _control_points, _wkid, sic, and uniquedesignation formats. The _type format is a position report, the _action format is an update, the _id format is a GUID, the _control_points format is the location, the spatial reference (_wkid) is latitude/longitude, the SIC is "SHGP-----------", which is a set of codes for the symbol, and lastly, the uniquedesignation format is a unique name for the message. In this example, it's a generic target. For more information about the SIC, see http://www.dtic.mil/doctrine//doctrine/other/ms_2525c.pdf. Once the message properties are created, they are passed into a message, which is then processed by the message processor. In a production-level app, these messages would come in at random times, individually or in bulk, and then be processed. The primary benefit of using the message processor is that it can process messages very quickly, which means it can display lots of messages on the map or scene. As a result, it is ideal for situation awareness and command and control applications.