
Chapter 32
Introducing Apple's Xcode and Developer Tools
The very tools that are used by software engineers, both inside and outside Apple, to develop applications for Mac OS X and iOS are available to you to download and use. Some of these tools are behemoth environments whose brambles are crisscrossed with the narrow paths cut by tutorials. Some are utilities useful to programmers and nonprogrammers alike. And some of these tools defy a simple explanation yet invite exploration. Whether you've bought your Mac to write the next big iPhone game or whether you're an avid novice looking for more toys to play with, the developer tools for Mac OS X are ready to flex your imagination.
In this chapter, we will cover the following:
- Downloading and installing Xcode (and related tools)
- An overview of the big four Apple developer apps: Xcode, Instruments, Dashcode, and Quartz Composer
- A quick description of some of the many additional utilities and application included with Xcode
Getting and Installing Xcode
With all previous versions of Mac OS X, Xcode was included either on the Mac OS X install DVD or on an included CD. Beginning with Lion, however, there is no media to include Xcode with. So, beginning with Lion to install Xcode, you will have to download it first.
Xcode is available from two places, Apple's developer web site and the App Store. The easiest path to downloading Xcode is to open the App Store, search for Xcode, and download it. Now, unlike most other apps you get from the App Store, with Xcode you aren't actually downloading the Xcode app but an installer (Figure 32–1) that will allow you to install Xcode.
Figure 32–1. When you download Xcode from the App Store, you are actually downloading the Xcode installer that must be run before you can use Xcode.
NOTE: Downloading from the App Store will always provide you with the current version of Xcode and tools. When a new version is released, it will show up as an update for you to install. If you sign up for either the iOS or Mac developer programs and are working on prerelease versions of either iOS or Mac OS X, then you may need a prerelease version of Xcode as well, and for this you will likely need to go to http://developer.apple.com to download the version of Xcode you need.
Once you have the Xcode installer from the App Store (or from http://developer.apple.com if you downloaded it directly from there), then you will click it to start the installation. A dialog box will walk you through the installation (Figure 32–2). Depending on whether you are installing Xcode for the first time or upgrading an older version, just follow along to get Xcode and all the associated apps, utilities, SDKs, and documentation you will need to develop for Mac OS X and iOS installed.
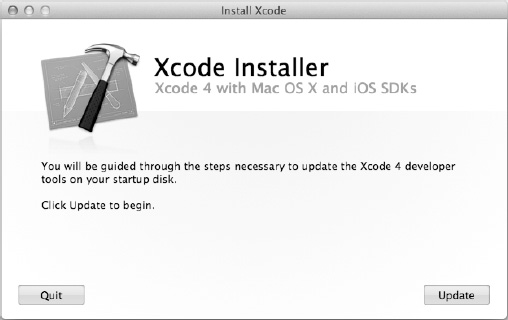
Figure 32–2. A dialog will guide you through the installation or update of Xcode and associated tools.
Once the installation is complete, the four primary developer apps—Dashcode, Instruments, Quartz Composer, and Xcode—will show up in Launchpad under the Developer folder (Figure 32–3). On your disk you will find these as well as many other utilities and tools installed in the Developer folder in the root of your primary disk. Let's now take a look at the big four developer apps beginning with Xcode.
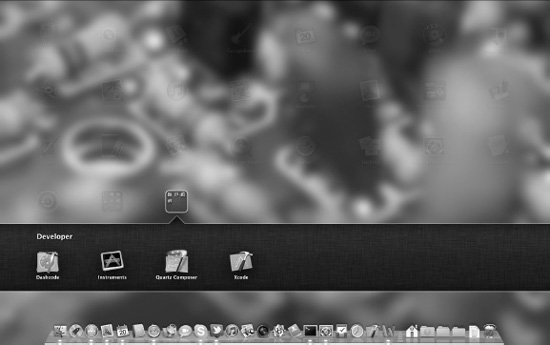
Figure 32–3. Once installed, Dashcode, Instruments, Quartz Composer, and Xcode will show up in the Developer folder in Launchpad.
Welcome to Xcode
Xcodeis Apple's main integrated development environment (IDE) for Mac OS X and iOS native development. Xcode combines text editing, graphical UI tools (which prior to Xcode 4 were part of a separate application named Interface Builder), source code repository management, build tools, debugging tools, and more, into a single application.
When you first launch Xcode, you are presented with the Welcome to Xcode window (Figure 32–4) that will either allow you to quickly start a new project, open a recent project, connect to a repository (a local or remote collection of project files), browse development documentation, or head over to Apple's developer web site.

Figure 32–4. The Welcome to Xcode window provides a good starting point for working with Xcode.
Usually at this point the first thing you'll want to do is get started creating a new project, so we will look at that first.
NOTE: Although jumping in and getting started is the most temping thing to do, it may not be a bad idea to click the “Learn about using Xcode” option. This will open the Organizer window to the included documentation that not only covers all the features of Xcode but also provides extensive detailed documentation on all facets of Mac OS X and iOS development.
Creating a New Project in Xcode
Clicking the “Create a new Xcode project” option in the Welcome to Xcode window (or selecting File > New > New Project... or pressing Shift-Command-M) will open a new workspace window with a new Project Template dialog (Figure 32–5), allowing you to select the type of project you want to develop. As you can see, there are a wide range of options to choose from (more than we could adequately explain in the space we have here).
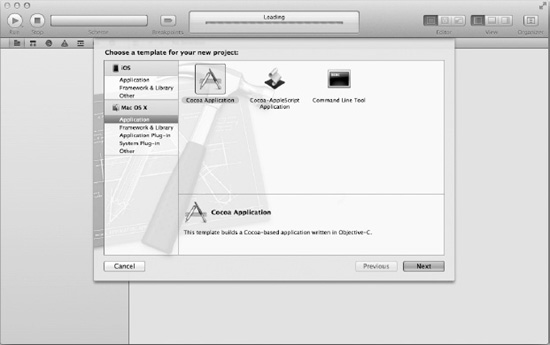
Figure 32–5. When you start a new project, you are presented with a number of templates for possible project types to get you started.
Once you select the type of project you are building, click the Next button where you will be prompted to fill out some basic information about your project (Figure 32–6). The options listed here will depend on the type of the project.
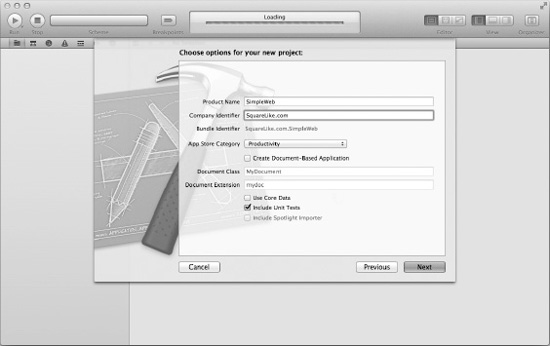
Figure 32–6. After you select your project type, you will be asked to fill in some basic information about your project. Here we see the information requested for a Mac OS X Cocoa application.
Once you fill out the requested information and click Next, you will be prompted for a location to create your project and store all project-related files (Figure 32–7). By default Xcode will create a git repository for your project.
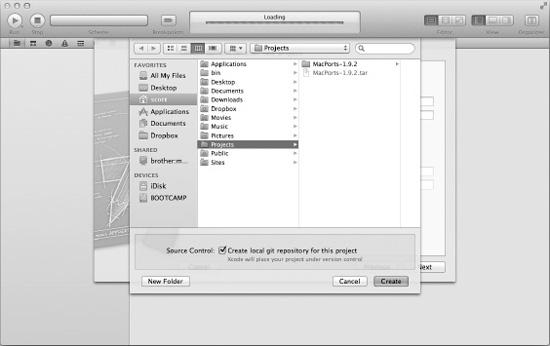
Figure 32–7. After you fill in the basic details for your project, you will need to select a location to store your project files.
NOTE: Git is a type of distributed version control system that helps organize projects, as well as tracks changes to the project. More importantly is that it facilitates the organization and tracking in a way that allows multiple developers to work on the same project efficiently. For more information on Git, take a look at http://git-scm.com.
NOTE: Prior to adding support for Git, Xcode used Subversion as its default source control repository. Xcode still supports Subversion if you have a need or preference for it.
After selecting the location for your project, Xcode will create a folder in that location and populate it with a number of sensible files to get you started with your project. Then Xcode will close the dialog and open your new project in a new workspace (Figure 32–8), which will provide you with the interface to accomplish most of your development needs.
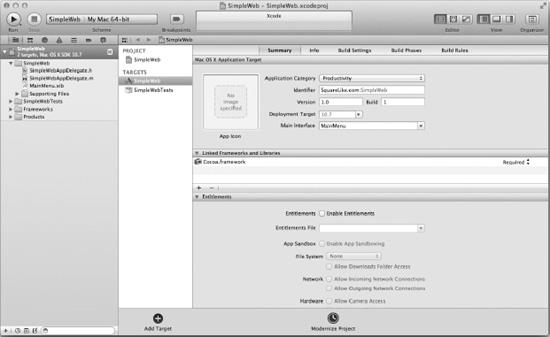
Figure 32–8. A default workspace is showing a summary of the selected project.
The Workspace
The workspace in Xcode is designed to provide you with all the features and tools you need to develop and build your project. The workspace is divided into four primary areas: the navigator, the editor, the utilities, and the debug area (Figure 32–9). While the editor area is always visible, the other three areas' visibility can be toggled using the View controls on Xcode's toolbar. You can access more control over the visibility, as well as the content, of each of these areas from Xcode's View menu and via its associated keyboard shortcuts.
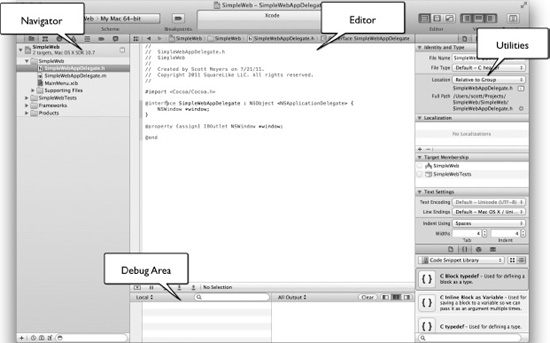
Figure 32–9. Xcode's workspace with all four main areas visible
Each of these areas has one or more specific purposes, so we will look at them one at a time.
The Navigator
The navigator (Figure 32–10) that appears on the far left of Xcode workspace provides a number of ways to navigate through your project, source code, debugging information, and more.
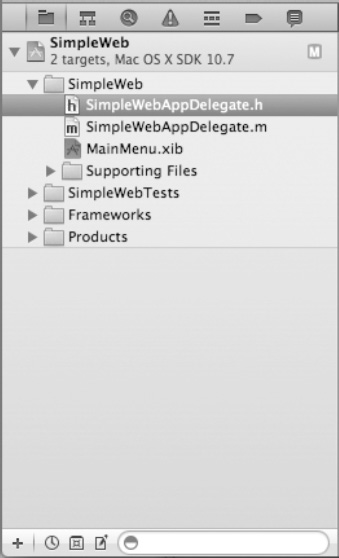
Figure 32–10. The navigator provides tools for navigating through your project in various ways. The Project navigator shown here is the most common view.
Along the top of the navigator area is a small toolbar that allows you to view different navigators in the navigator area. The navigators available are as follows:
- The Project navigator: The Project navigator allows you to view the various components that make up your project in an adaptable, hierarchical form.
- The Symbol navigator: The Symbol navigator allows you to browse for specific symbols in Xcode. In this case, a symbol is a specific type of code feature such as a specific class, function, or variable.
- The Search navigator: The Search navigator does what you think it does; you enter some text in the field on the top, and Xcode will search for that text in the current project and provide matches below.
- The Issue navigator: When you first attempt to build you project, it's not uncommon for the build to fail the first time (or second time...). When a build fails, Xcode will attempt to identify the issue preventing the project from building and list the identified issues here.
- The Debug navigator: The Debug navigator allows you to select specific threads and symbols during a debugging session to view and control some details of that specific item.
- The Breakpoint navigator: When you are building a complex application, it's often useful to stop the execution of the program at certain points to see what's going on. That's what breakpoints are; they will stop a program so you can peek at the debugging information to see whether everything is working correctly. Here you can view and edit any breakpoints in a project.
- The Log navigator: The Log navigator will allow you to view logs created during a project's development.
Often whatever you select from the navigator will appear in the editor view so you may immediately work with the item you selected.
The Editor
The editor area, as the name implies, is where you do the editing of your source files, nibs, and project information. The editor itself will adapt and present itself in a manner most appropriate for the type of item that requires editing. For example, if you have the main project file selected in the navigator, then the editor will provide forms allowing you fill out project information ranging from including an application icon to fine-tuning the build processes and adding linked frameworks and libraries (Figure 32–8). If you have a source file selected, then the editor will display a text editor to edit the file. If you have a nib file selected, then the editor will provide the Interface Builder view to design and hook together your interface (Figure 32–11).

Figure 32–11. The editor area in Xcode will adapt itself to provide the most appropriate features needed for editing the selected item. For a nib file, it will take on the features of the old Interface Builder application.
NOTE: Nib files are files with the extension .xib, which stands for Xcode Interface Builder. Not so long ago these files were given the .nib extension, which stood for NextStep Interface Builder, and they are still commonly referred to by that historic name.
NOTE: A nib file is a special resource file that contains an archive of the objects in an interface. They were traditionally created in Interface Builder, which beginning with Xcode 4 no longer exists as a separate application, but rather its functions are now part of Xcode.
Besides taking on different roles for different types of project items, there are three distinct editor modes available from the toolbar (or the View menu):
- The Standard editor: The Standard editor view is what we have seen so far up to this point; it presents a single area ready for editing.
- The Assistant editor: The Assistant editor divides the editing area into multiple areas so that multiple related items can be shown at once. For example, if you have a header file open, then the Assistant editor will also display the source files that import it. This is handy to make sure that your
@interfacesand@implementationsmatch up.
NOTE: In Objective-C, an @interface provides a class declaration or defines a class and sets it up. A class is like a blueprint for an object. An @implementation is where you create a specific object to use in your project from the class.
- The Version editor: The Version editor compares different versions of the same item, so if you are working on a file all day, but accidentally change something you shouldn't have, you can compare the results of your edited file from a previously saved file to discover what was changed and correct any destructive edits.
The Utilities Area
The utilities area in Xcode provides two separate panes, the Inspector pane on top and the Library pane on the bottom.
NOTE: The utilities area is hidden by default. To show it click the Hide or Show the Utilities button in the View controls on the toolbar. Other buttons there will toggle the visibility of the navigator and the debug area.
The Inspector pane provides editable details about a selected item that can be very different depending upon the item. For example, if you have a source file selected, then a File inspector will appear that provides information about the source file, and a Quick Help inspector will be available that will provide any available help on the selected text in the file. If a nib file is selected, though, the inspector will provide many additional inspectors (Figure 32–12) to deal with customizing the behavior of the objects used in the nib.
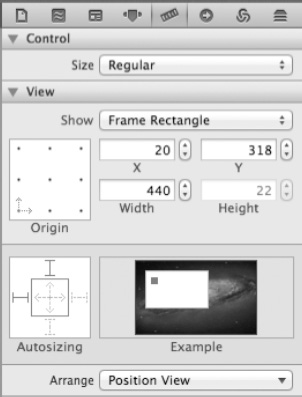
Figure 32–12. The Inspector pane on the utilities area provides various inspectors for getting information or customizing various project items. The Size inspector, shown here, determines the size of an object relative to its container in a nib file.
Unlike the Inspector pane, the Library pane is fairly static, presenting four different libraries:
- The File Template Library makes a number of different file templates available. You can drag a file template from the File Template Library into the Project navigator to add a file to your project.
- The Code Snippet Library provides code snippets that you can drag into your source files to simplify the addition of common code segments.
- The Object Library provides common objects that you can use to construct interfaces. This is essentially the same Object Library that was part of Interface Builder.
- The Media Library provides a list of all media (images, movies, and so on) imported into your project.
The Debug Area
The final area we'll talk about here is the debug area that opens below the editor area. The debug area displays detailed information about what's happening inside your program when it's running. Whenever a program reaches a breakpoint or you manually pause execution of a program running from Xcode, the debug area will automatically appear.
The debug area is divided into two side-by-side panes: the Variable pane and the Console pane. The Variable pane will display all the program's variables and their current values. If a program seems to be running fine but it's presenting the wrong (or odd) output, this is a good place to see whether a variable is picking up some wrong information (or not picking up the right information) during the program's execution.
The Console pane displays the raw debugger output. Xcode has two debuggers: GDB and LLDB. LLDB is part of the LLVM compiler project (LLVM is the default compiler in Mac OS X). Depending on which debugger you choose, the output here will be similar butdifferent.
NOTE: Debugging is as an important topic because it a big topic. Luckily, it's a topic that you can ease into. As you start developing, usually you begin with simple projects where the errors are fairly easy to track down. As your projects increase in size and complexity, though, your reliance on the debugger grows. As you become more reliant on the debugger, you can gradually learn more and more about it.
The Organizer
The Organizer (Figure 32–13) is another important part of Xcode. The Organizer provides five tabs to help you keep track of resources of great value to a developer.
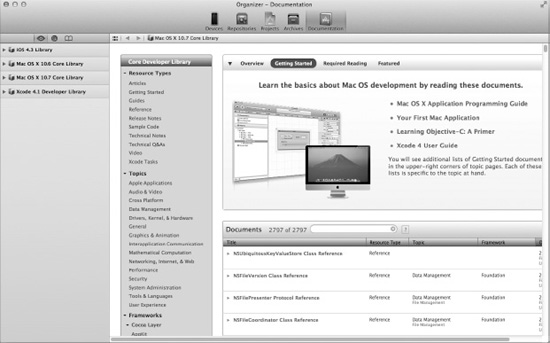
Figure 32.13. The Organizer keeps track of documentation, repositories, projects, archives, and devices.
- The Devices tab in the Organizer keeps track of devices such as iPhones and iPads that you use for development, as well as some important profile information that you'll need to distribute iOS applications. Besides keeping track of your devices, you can view lots of information from them including crash reports and console data.
- The Repositories tab lets you manage your source code repositories. This includes any local projects you've created with the Source Control option checked, but it also allows you to add remote Git or Subversion repositories to work with.
- The Projects tab provides a list of all your local projects.
- The Archives tab allows access to application archives. Once you've successfully developed and built an application in Xcode, the next step is to archive it (using Product > Archive from the menu). Once archived, the application will show up here where you can save you app for sharing or submit it to the App Store (provided you are a registered developer).
- The Documentation tab provides an easy way to search for and read the developer documentation included with Xcode.
NOTE: Much of what we've covered here is covered in this documentation, along with a whole lot more. A good starting point if you are really interested in Mac OS X development is selecting Mac OS X 10.7 Core Library in the Documentation tab and selecting Getting Started.
This concludes our brief overview of Xcode for the moment. (We will return to Xcode in the next chapter where we build a simple application just to get a taste for Mac OS X development.)
Instruments
When developing programs for Mac OS X and iOS, the debugger in Xcode can be a fantastic help; however, it has its limits. To push your debugging capabilities further, you can use Instruments (Figure 32–14),which is included with Xcode.
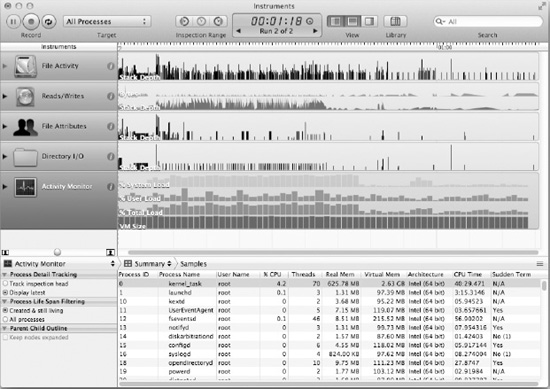
Figure 32–14. Instruments provides tracing tools that allow you to study specific traits of a program while it is running.
Instruments provides a wide selection of tracinginstruments, or tools that can log specific information about the behavior of a running program, all wrapped together in a single program.
Each individual instrument traces a specific trait in a single process program or in the system on a whole. There are all types of instruments available ranging from “Leaks” and “Allocations,” which together help discover memory leaks in a single process, to “Read/Writes,” which provides details of disk activity.
Besides providing tracing on your Mac, Instruments can be used on connected iOS devices and the iOS simulator, so you can get details on the performance of your iOS apps and identify areas where your app's performance and behaviors can be improved.
When you are just getting started in development, it's often a victory just to get your app to run. Once you've gotten beyond that stage, though, learning to use tools like Instruments to further improve the end user's experience makes the difference between an app and a great app.
Dashcode
While Xcode is used primarily for developing native Mac OS X and iOS programs, Dashcode (Figure 32–15) is an IDE for creating web-based applications and widgets. First released along with the developer tools included with Mac OS X Leopard, Dashcode was primarily designed for developing dashboard widgets.

Figure 32–15. Dashcode is an IDE for creating web-based application and widgets for Dashboard, Safari, or Mobile Safari.
As Dashcode evolved, it has grown beyond a tool just for creating dashboard widgets (though it still of course can be used for that) and into a tool that can be used for creating full-fledged web applications for both Safari and Mobile Safari.
Quartz Composer
The final main app included with Xcode is Quartz Composer (Figure 32–16). Quartz Composer is an interesting application used for processing and rendering graphical data.

Figure 32–16. Quartz Composer provides a visual programming environment for rendering and processing graphical data.
NOTE: Quartz is the name given to Mac OS X's graphics layer. Quartz uses a combination of other rendering technologies including OpenGL, Quartz 2D, Core Image, Core Animation, Core Video, Color Sync, and QuickTime.
Unlike traditional programming, a developer does not write code to build projects in Quartz Composer; rather, patches, special elements used for building compositions, are added from a library to the editor and then configured and connected to create graphical scenes.
In addition to being a fun way to learn about some of the graphical capabilities in Mac OS X, Quartz Composer can be used to create screen savers, iTunes music visualizers, and custom image filters.
Other Developer Utilities and Tools
Besides the four apps that show up in Launchpad, when you install Xcode, a number of additional tools and utilities are installed. To explore them, take a look in the /Developer/Applications folder. There, in addition to Xcode, Instruments, Dashcode, and Quartz Composer, are four additional folders containing other programs that may come in handy for developers.
The Audio folder contains two applications: AU Lab and HALlab. AU Lab can be used for testing audio units (a plug-in technology provided by Core Audio), and HALlab is used for testing audio hardware.
The Graphics Tools folder contains a number of applications for monitoring and working with OpenGL and Quartz as well as Core Image Fun House, which is an application that allows you to apply Core Image filters to an image, and Pixie, a screen area magnifier.
The Performance Tools folder contains Quartz Debug, a tool that provides a number of ways to help debug graphic issues with your applications, and Spin Doctor, which can help identify where applications may throw up the dreaded spinning rainbow wait cursor.
The Utilities folder contains a number of useful developer utilities for handling specific tasks such as creating icons from images and making traditional Mac OS installer packages.
Summary
Although this chapter by no means provided a complete look at Xcode and the included developer tools, it gave you a passing familiarity with the development environment that Apple provides. Apple's developer documentation provides a significant amount of additional information about all of these tools and how they are used. However, the best way to learn is to start using the tools and then discover new features as a need arises. In the next (and final) chapter, we are going to give you a taste of actual Mac OS X development to get you started on your path.