
Most machine learning algorithms are dependent on various parameters. When we train a model, we need to provide values for those parameters. The efficacy of the trained model is dependent on the model parameters that we choose. The process of finding out the optimal set of parameters is known as model selection.
When performing machine learning using Python's scikit-learn library or R, you can often get a reasonably predictive performance by using out-of-the-box settings for your models. However, the payoff can be huge if you invest some time in tuning models to your specific problem and data set.
However, we also need to consider other issues like overfitting, cross-validation, and bias-variance trade-off. These ideas are central to doing a good job at optimizing the hyperparameters of algorithms.
In this section, we will explore the concepts behind Hyperparameter optimization and demonstrate the process of tuning and training a logistic regression classifier for the famous Spam Filtering dataset. The goal is to tune and apply a logistic regression to these features in order to predict whether a given email/SMS is spam or not-spam:
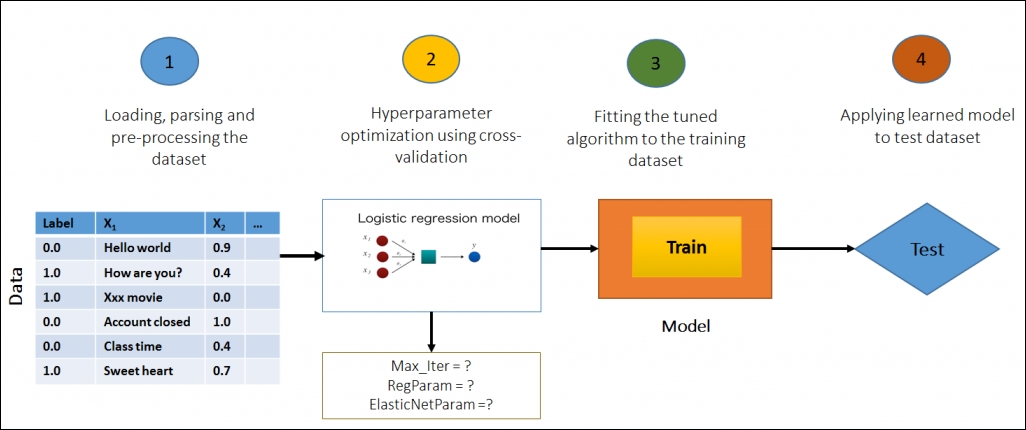
Figure 4: Model selection via cross-validation
Pipelines enable model selection by tuning an entire Pipeline at once, rather than tuning each element in the Pipeline unconnectedly. See the API documentation at http://spark.apache.org/docs/latest/ml-guide.html.
The current implementation of Spark ML supports model selection using the CrossValidator class. It takes an Estimator, a set of ParamMaps, and an Evaluator. The model selection task begins with splitting the dataset (that is, splitting it into a set of folds) the folds of which are then used as separate training and test datasets.
For example, with K=10 folds, the CrossValidator will generate 10 (training, test) dataset pairs. Each of these uses two thirds (2/3) of the data for the training, and the other third (1/3) for the testing. After that, the CrossValidator iterates through the set of ParamMaps. For each ParamMap, it trains the given Estimator and evaluates it using the available Evaluator. The Evaluator can be a related ML task for example:
RegressionEvaluatorfor regression related problemsBinaryClassificationEvaluatorfor binary data and its related problemsMultiClassClassificationEvaluatorfor a multiclass problem
When it comes to the best ParamMap selection, a default metric is used. Note that the ParamMap can be also be overridden by the setMetric() method in each of these evaluators. In contrast, when it comes to the best model selection:
- The
ParamMapproduces the best evaluation metric - The evaluations metrics are then averaged over the K folds
- Finally, the best model is selected
Once the best ParamMap and model are selected, the CrossValidator fits the Estimator using them for the entire dataset.
To get a clearer insight into the CrossValidator and to select from a grid of parameters, Spark uses the ParamGridBuilder utility to construct the parameter grid. For example, suppose the parameter grid has a value of 4 as the hashingTF.numFeatures and a value of 3 for the LR.regParam. Also, lets say that the CrossValidator uses 10 folds.
Once, these values are multiplying results to 120 (that is, 4*3 *10 = 120), this signifies that a significant amount of different models (that is, 120) are being trained. Therefore, using the CrossValidator sometimes can be very expensive. Nevertheless, it is also a well-established method for choosing associated performance and hyperparameters that are sounder statistically compared to the heuristic-based hand tuning.
Tip
Interested readers may refer to the following three books for more insight:
Evan R. Sparks et al., Automating Model Search for Large-Scale Machine Learning, ACM, 978-1-4503-3651-2/15/08, http://dx.doi.org/10.1145/2806777.2806945.
Cawley, G. C. & Talbot, N. L on over-fitting in model selection and subsequent selection bias in performance evaluation, The Journal of Machine Learning Research, JMLR. org, 2010, 11, 2079-2107.
N. Japkowicz and M. Shah, Evaluating learning algorithms: a classification perspective, Cambridge University Press, 2011.
In the next sub-section, we will show how to perform cross-validation on a dataset for model selection using Spark ML API.
In this sub-section, we will show you how to perform cross-validation on the e-mail spam dataset for model selection. We will use logistic regression in the first place then we will move forward for other models. Finally, we will recommend the most suitable model for e-mail spam classification.
Step 1: Import necessary packages/libraries/APIs
Here is the code to import necessary packages/libraries/APIs:
import java.io.Serializable;
import java.util.Arrays;
import java.util.logging.Level;
import java.util.logging.Logger;
import org.apache.spark.api.java.JavaPairRDD;
import org.apache.spark.api.java.JavaRDD;
import org.apache.spark.api.java.function.Function;
import org.apache.spark.ml.Pipeline;
import org.apache.spark.ml.PipelineStage;
import org.apache.spark.ml.classification.LogisticRegression;
import org.apache.spark.ml.evaluation.BinaryClassificationEvaluator;
import org.apache.spark.ml.feature.HashingTF;
import org.apache.spark.ml.feature.Tokenizer;
import org.apache.spark.ml.param.ParamMap;
import org.apache.spark.ml.tuning.CrossValidator;
import org.apache.spark.ml.tuning.CrossValidatorModel;
import org.apache.spark.ml.tuning.ParamGridBuilder;
import org.apache.spark.sql.Dataset;
import org.apache.spark.sql.Row;
import org.apache.spark.sql.SparkSession;
import scala.Tuple2;
Step 2: Initialize the necessary Spark environment
The following code helps us to initialize the necessary Spark environment:
  static SparkSession spark = SparkSession
        .builder()
        .appName("CrossValidationforSpamFiltering")
        .master("local[*]")
        .config("spark.sql.warehouse.dir", "E:/Exp/")
        .getOrCreate();
Here we set the application name as cross-validation, the master URL as local[*], and the Spark session as the entry point of the program. Please set these parameters accordingly. Most importantly, set the warehouse directory as E:/Exp/ and replace it with the appropriate path.
Step 3: Prepare a Dataset from the SMS spam dataset
Take the e-mail spam data as your input, prepare a dataset out of the data, using it as raw text, and check if the data was read properly by calling the show() method:
Dataset<Row> df = spark.read().text("input/SMSSpamCollection.txt");
df.show();

Figure 5: The top 20 rows
To learn more about the data, please refer to the section Pipeline - an example with Spark ML, in Chapter 4, Extracting Knowledge through Feature Engineering, and the description for the dataset exploration. As you can see in Figure 5, The top 20 rows, there are only two labels - spam or ham (that is, it is a binary classification problem) associated along with the text values (that is, each row).
However, there is no numeric label or ID. Therefore, we need to prepare the dataset (training set) such that the data frame also contains the ID, and labels along with text (that is, value) so that we can prepare a test set and predict the corresponding labels using any classification algorithm (that is, logistic regression) and can decide if our model selection is appropriate.
However, for doing so we need to prepare the training dataset first. As you can see, the data frame shown above has only one column and, as mentioned previously, we do need to have three columns. If we prepare an RDD from the previous Dataset (that is, df), it would be easier for us to make that transformation.
Step 4: Create Java pairs of RDDs to store the rows and indices
Create a Java pair of RDDs by converting (transforming) the DataFrame (that is, df) to Java RDD and by zipping the index:
JavaPairRDD<Row, Long> rowRDD = df.toJavaRDD().zipWithIndex();
Step 5: Create LabeledDocument RDDs
Create LabeledDocument Java RDDs by splitting the dataset based on two labels and converting the text label to a numeric label (that is, 1.0 if ham otherwise 0.0). Note that the LabeledDocument is a user-defined class that is discussed in step 6:
JavaRDD<LabeledDocument> splitedRDD = rowRDD.map(new Function<Tuple2<Row, Long>, LabeledDocument>() {
@Override
public LabeledDocument call(Tuple2<Row, Long> v1) throws Exception {
  Row r = v1._1;
  long index = v1._2;
  String[] split = r.getString(0).split("	");
  if(split[0].equals("ham"))
    return new LabeledDocument(index,split[1], 1.0);
  else
    return new LabeledDocument(index,split[1], 0.0);
      }
    });
Step 6: Prepare the training dataset
Prepare the training dataset from the LabeledDocument RDDs using the createDataFrame() method and by specifying the class. Finally, see the data frame structure using the show() method as follows:
Dataset<Row> training = spark.createDataFrame(splitedRDD, LabeledDocument.class);
training.show(false);

Figure 6: The newly created label and ID from the dataset; where ID is the number of row.
From Figure 6, The newly created label and ID from the dataset; where ID is the number of rows, we can see that the new training dataset has three columns: ID, test, and label. It can actually be done by adding a new ID against each row (that is, each line) of the original document. Let's create a class, called Document for our purpose, that should set a unique ID against each line of text. The structure of the class can be something like the following:
public class Document implements Serializable {
  private long id;
  private String text;
  //Initialise the constructor that should take two parameters: id and text//
  Set the id
  Get the id
  Set the text
  Get the text
  }
Now let's look at the structure of the class constructor:
  public LabeledDocument (long id, String text) {
      this.id = id;
           this.text = text;
  }
The setter and getter for the ID could be something like this:
  public void setId(long id) {
    this.id = id;
  }
  public long getId() {
    return this.id;
  }
Similarly the setter and getter methods for the text could be something like this:
  public String getText() {
    return this.text;
  }

  public void setText(String text) {
    this.text = text;
  }
Therefore, if we summarize, the Document class could be something like this:
import java.io.Serializable;
public class Document implements Serializable {
  private long id;
  private String text;
  public Document(long id, String text) {
    this.id = id;
    this.text = text;
  }
  public long getId() {
    return this.id;
  }
  public void setId(long id) {
    this.id = id;
  }
  public String getText() {
    return this.text;
  }
  public void setText(String text) {
    this.text = text;
  }
}
The structure of the LabeledDocument class, on the other hand, can be as follows and that can be extended from the Document class (to be discussed later):
Now let's look at the structure of the class constructor:
  public LabeledDocument(long id, String text, double label) {
    this.label = label;
  }
However, we're not done yet since we will be extending the Document class we need to inherit the constructor from the Document class using the super() method as follows:
  public LabeledDocument(long id, String text, double label) {
    super(id, text);
    this.label = label;
  }
Now the setter method can be something like this:
  public void setLabel(double label) {
    this.label = label;
  }
And of course the getter method for the label could be something like this:
  public double getLabel() {
    return this.label;
  }
Therefore, in a nutshell, the LabelDocument class is as follows:
import java.io.Serializable;
public class LabeledDocument extends Document implements Serializable {
  private double label;
  public LabeledDocument(long id, String text, double label) {
    super(id, text);
    this.label = label;
  }
  public double getLabel() {
    return this.label;
  }
  public void setLabel(double label) {
    this.label = label;
  }
}
Step 7: Configure an ML pipeline
Configure an ML pipeline, which consists of three stages: tokenizer, hashingTF, and lr:
Tokenizer tokenizer = new Tokenizer().setInputCol("text").setOutputCol("words");
HashingTF hashingTF = new HashingTF().setNumFeatures(1000).setInputCol(tokenizer.getOutputCol()).setOutputCol("features");
LogisticRegression lr = new LogisticRegression().setMaxIter(10).setRegParam(0.01);
Pipeline pipeline = new Pipeline().setStages(new PipelineStage[] { tokenizer, hashingTF, lr });
Step 8: Construct a grid of parameters to search over
Currently, Spark uses a ParamGridBuilder to construct a grid of parameters to search over. In this regard, suppose we have three values for hashingTF.numFeatures and two values for lr.regParam, this grid will have 3 x 2 = 6 parameter settings for the CrossValidator to choose from:
ParamMap[] paramGrid = new ParamGridBuilder()
.addGrid(hashingTF.numFeatures(), new int[] { 10, 100, 1000 }).addGrid(lr.regParam(), new double[] { 0.1, 0.01 })
 .build();
We now treat the pipeline as an estimator, wrapping it in a CrossValidator instance. This will allow us to jointly choose parameters for all Pipeline stages. A CrossValidator requires an Estimator, a set of Estimator ParamMaps, and an Evaluator. Note that the evaluator here is a BinaryClassificationEvaluator and its default metric is areaUnderROC.
Step 9: Create a CrossValidator instance
Here is the code to create a CrossValidator instance:
    CrossValidator cv = new CrossValidator()
        .setEstimator(pipeline)
        .setEvaluator(new BinaryClassificationEvaluator())
        .setEstimatorParamMaps(paramGrid)
        .setNumFolds(5); // 5-fold cross validation
Step 10: Run cross-validation
Run the cross-validation and choose the best set of parameters. Just use the following code segments:
CrossValidatorModel cvModel = cv.fit(training);
Now your CrossValidator model is ready to perform the prediction. However, before that, we need a test set or validation set. Now let's prepare a sample test set. Just create a dataset using the following code segment:
    Dataset<Row> test = spark.createDataFrame(Arrays.asList(
      new Document(4L, "FreeMsg CALL j k"),
      new Document(5L, "Siva  hostel"),
      new Document(6L, "darren now"),
     new Document(7L, "Sunshine Quiz! Win a super Sony")),Document.class);
Now let's see the structure of the test set by calling the show() method in Figure 7:

Figure 7: The test set
Step 11: Create a dataset to collect the prediction parameters
The following code illustrates how to create a dataset:
Dataset<Row> predictions = cvModel.transform(test);
Step 12: Display the prediction parameters for each text in the test set
With the help of the following code, we can display the prediction parameters:
for (Row r : predictions.select("id", "text", "probability", "prediction").collect())
    {
System.out.println("(" + r.get(0) + ", " + r.get(1) + ") --> prob=" + r.get(2) + ", prediction=" + r.get(3));
    }

Figure 8: Prediction against each text and ID
Therefore, if you compare the results shown in Figure 6, The newly created label and ID from the dataset; where ID is the number of rows, you'll find that the prediction accuracy increases from more sophisticated methods for measuring predictive accuracy that can be used to identify places where the error rate can be optimized depending on the costs of each type of error.
According to the API documentation provided by Spark at http://spark.apache.org/docs/latest/ml-guide.html, Spark also offers a TrainValidationSplit for hyperparameter tuning along with the CrossValidator. The idea of the TrainValidationSplit is it only evaluates each combination of the parameters compared to cross-validation that iterates to k times. It is, therefore, computationally less expensive and produces the result more quickly. The results, however, will not be as reliable as the CrossValidator. There is an exception: if the training dataset is sufficiently large then it can also produce reliable results.
The theory behind the TrainValidationSplit is that it takes the following three as inputs:
- An Estimator
- A set of
ParamMapsprovided in theestimatorParamMapsparameter - An Evaluator
Consequently, it begins the model selection by splitting the dataset into two parts using the trainRatio parameter. The trainRatio parameter, on the other hand, is used for separate training and test datasets.
For example, with trainRatio = 0.75 (the default value is also 0.75), the TrainValidationSplit algorithm generates a training and testing pair. In that case, 75% of the total data is used for training the model. Consequently, the rest of the 25% is used as the validation set.
Similar to the CrossValidator, the TrainValidationSplit also iterates through a set of ParamMaps as mentioned earlier. For each combination of the parameters, it trains the given Estimator in each iteration.
Consequently, the model is evaluated using the given Evaluator. After that, the best model is selected as the best option, since the ParamMap produces the best evaluation metric and thereby eases the model selection. The TrainValidationSplit finally fits the Estimator using the best available ParamMap and for the entire dataset.
In this sub-section, we will show how to perform train validation split tuning for OCR data. The logistic regression will be used in the first place; then we will move forward for other models. Finally, we will recommend the most suitable parameters for the OCR data classification.
Step 1: Import necessary packages/libraries/APIs:
import org.apache.spark.ml.evaluation.MulticlassClassificationEvaluator;
import org.apache.spark.ml.param.ParamMap;
import org.apache.spark.ml.regression.LinearRegression;
import org.apache.spark.ml.tuning.ParamGridBuilder;
import org.apache.spark.ml.tuning.TrainValidationSplit;
import org.apache.spark.ml.tuning.TrainValidationSplitModel;
import org.apache.spark.sql.Dataset;
import org.apache.spark.sql.Row;
import org.apache.spark.sql.SparkSession;
Step 2: Initialize necessary Spark environment
  SparkSession spark = SparkSession
          .builder()
          .appName("TrainSplitOCR")
              .master("local[*]")
               .config("spark.sql.warehouse.dir",
                 "E:/Exp/")
              .getOrCreate();
Here we set the application name as TrainValidationSplit, the master URL as local[*], and the Spark Context is the entry point of the program. Please set these parameters accordingly.
Step 3: Prepare the OCR data as a libsvm format
If you recall Figure 19 in Chapter 6, Building Scalable Machine Learning Pipelines, you will remember the data as follows in Figure 9, A snapshot of the original OCR dataset as a Data Frame:

Figure 9: A snapshot of the original OCR dataset as a Data Frame
However, the current implementation of the TrainValidationSplitModel API only works on datasets that are already in libsvm format.
Tip
Interested readers should refer to the following research article for more in depth knowledge: Chih-Chung Chang and Chih-Jen Lin, LIBSVM - A Library for Support Vector Machines. ACM Transactions on Intelligent Systems and Technology, 2:27:1--27:27, 2011. The software is available at http://www.csie.ntu.edu.tw/~cjlin/libsvm.
Therefore, we do need to convert the dataset from the current tab separated OCR data to a libsvm format.
Tip
Readers should use the dataset provided with Packt packages or can convert the CSV/CSV file to the corresponding libsvm format. Interested readers can refer to our public script provided on GitHub at https://github.com/rezacsedu/CSVtoLibSVMConverterinR that directly converts a CSV file to libsvm format. Just properly show the input and output file path and run the script on your RStudio.
Step 4: Prepare the OCR data set and also prepare the training and test set
We are assuming that readers already have downloaded the data or have converted the OCR data using our GitHub script or using their own script. Now, take the OCR libsvm format data as input and prepare the Dataset out of the data as raw texts and check if the data was read properly by calling the show() method as follows:
Dataset<Row> data = spark.read().format("libsvm").load("input/Letterdata_libsvm.data");
data.show(false);

Figure 10: The top 20 rows
// Prepare training and test data.
Dataset<Row>[] splits = data.randomSplit(new double[] {0.9, 0.1}, 12345);
Dataset<Row> training = splits[0];
Dataset<Row> test = splits[1];
To learn more about the data, please refer to the section Pipeline - An Example with Spark ML, in Chapter 4, Extracting Knowledge through Feature Engineering, and the description of dataset exploration. As you can see in Figure 2, Spark ML pipeline model using logistic regression estimator (dash lines only happen during pipeline fitting), there are only two labels (spam or ham) associated along with the text values (that is, each row). However, there is no numeric label or ID.
Therefore, we need to prepare the dataset (training set) so that the Dataset also contains the ID, and labels along with text (that is, value) so that we can prepare a test set and predict their corresponding labels for any classification algorithm (that is, logistic regression) and can decide if our model selection is appropriate.
However, in order to do so we first need to prepare the training dataset. As you can see, the data frame shown above has only one column and as previously mentioned we do need to have three columns. If we prepare an RDD from the above Dataset (that is, df) it would be easier for us to make that transformation.
Step 5: Configure an ML pipeline using linear regression
LinearRegression lr = new LinearRegression();
Step 6: Construct a grid of parameters to search over
Currently, Spark uses a ParamGridBuilder to construct a grid of parameters to search over. In this regard, then, with three values for hashingTF.numFeatures and two values for lr.regParam, this grid will have 3 x 2 = 6 parameter settings for the CrossValidator to choose from:
ParamMap[] paramGrid = new ParamGridBuilder()
.addGrid(hashingTF.numFeatures(), new int[] { 10, 100, 1000 }).addGrid(lr.regParam(), new double[] { 0.1, 0.01 })
.build();
We now treat the pipeline as an Estimator, wrapping it in a CrossValidator instance. This will allow us to jointly choose parameters for all pipeline stages. As already discussed, a CrossValidator requires an Estimator, a set of Estimator ParamMaps, and an Evaluator.
Step 7: Create a TrainValidationSplit instance:
TrainValidationSplit trainValidationSplit = new TrainValidationSplit()
    .setEstimator(lr)
    .setEvaluator(new MulticlassClassificationEvaluator())
    .setEstimatorParamMaps(paramGrid)
    .setTrainRatio(0.7);
In this case the estimator is simply the linear regression that we created in Step 4. A TrainValidationSplit requires an Estimator, a set of Estimator ParamMaps, and an Evaluator. In this case, 70% of the data will be used as training and the remaining 30% for the validation.
Step 8: Run TrainValidationSplit, and chooses parameters
Run the TrainValidationSplit and choose the best set of parameters for your problem using
the training set. Just use the following code segment:
TrainValidationSplitModel model = trainValidationSplit.fit(training);
Step 9: Making a prediction on the test set
Make predictions on the test data where model is the model with the combination of parameters that performed best. Finally, to show the predictions, use the following code segment:
Dataset<Row> per_param = model.transform(test);
per_param.show(false);

Figure 11: Prediction against each feature and label
In Figure 11, we showed the row prediction against the actual label. The first column is the actual label, the second column signifies the feature vector, and the third column shows the raw prediction based on the feature vectors the TrainValidationSplitModel created.
In this sub-section, we will show how to perform train validation split tuning for OCR data. We will use the logistic regression in the first place; then we will move forward for other models. Finally, we will recommend the most suitable parameters for the OCR data classification.
Step 1: Import the necessary packages/libraries/APIs
import org.apache.spark.api.java.JavaRDD;
import org.apache.spark.api.java.function.Function;
import org.apache.spark.ml.classification.LogisticRegression;
import org.apache.spark.ml.evaluation.RegressionEvaluator;
import org.apache.spark.ml.feature.LabeledPoint;
import org.apache.spark.ml.linalg.DenseVector;
import org.apache.spark.ml.linalg.Vector;
import org.apache.spark.ml.param.ParamMap;
import org.apache.spark.ml.tuning.ParamGridBuilder;
import org.apache.spark.ml.tuning.TrainValidationSplit;
import org.apache.spark.ml.tuning.TrainValidationSplitModel;
import org.apache.spark.rdd.RDD;
import org.apache.spark.sql.Dataset;
import org.apache.spark.sql.Row;
import org.apache.spark.sql.SparkSession;
Step 2: Initialize the necessary Spark environment
static SparkSession spark = SparkSession
  .builder()
  .appName("CrossValidationforSpamFiltering")
  .master("local[*]")
  .config("spark.sql.warehouse.dir", "C:/Exp/").
  getOrCreate();
Here we set the application name as CancerDiagnosis, the master URL as local[*] and the Spark Context as the entry point of the program. Please set these parameters accordingly.
Step 3: Create the Java RDD
Parse the cancer diagnosis data and prepare the Java RDDs for strings:
String path = "breastcancer/input/wdbc.data";
RDD<String> lines = spark.sparkContext().textFile(path, 3);
Step 4: Prepare the cancer diagnosis LabeledPoint RDDs
As already discussed in Chapter 6, Building Scalable Machine Learning Pipelines, the cancer diagnosis dataset contains two labels B and M for Benign and Malignant. However, we need to convert them into a numeric label. Just use the following code to convert all of them from label transforming to LabeledPoint RDDs preparation:
JavaRDD<LabeledPoint> linesRDD = lines.toJavaRDD().map(new Function<String, LabeledPoint>() {
      public LabeledPoint call(String lines) {
      String[] tokens = lines.split(",");
      double[] features = new double[30];
      for (int i = 2; i < features.length; i++) {
          features[i - 2] =
                 Double.parseDouble(tokens[i]);
        }
           Vector v = new DenseVector(features);
           if (tokens[1].equals("B")) {
      return new LabeledPoint(1.0, v); // benign
    } else {
    return new LabeledPoint(0.0, v); // malignant
    }
      }
    });

Figure 12: The Label Point RDDs snapshot
As you can see in Figure 9, The top 20 rows, the labels B and M have been converted into 1.0 and 0.0. Now we need to create a data frame out of the label point RDDs.
Step 5: Create a Dataset and also prepare the training and test set
Create a Dataset from the previous RDDs (that is, linesRDD) by specifying the Label Point class:
Dataset<Row> data = spark.sqlContext().createDataFrame(linesRDD, LabeledPoint.class);
data.show();

Figure 13: The created Dataset showing the top 20 rows.
Dataset<Row>[] splits=data.randomSplit(new double[] {0.8, 0.2});
Dataset<Row> training = splits[0];
Dataset<Row> test = splits[1];
Note, that you will have to set the ratio of the random split based on your data and problem type accordingly.
Step 6: Configure an ML pipeline using logistic regression:
LogisticRegression lr = new LogisticRegression();
Step 7: Construct a grid of parameters to search over
Currently, Spark uses a ParamGridBuilder to construct a grid of parameters to search over. In this regard, suppose we have three values for hashingTF.numFeatures and two values for lr.regParam, this grid will have 3 x 2 = 6 parameter settings for CrossValidator to choose from:
ParamMap[] paramGrid = new ParamGridBuilder()
.addGrid(lr.regParam(), new double[] {0.1, 0.01})
.addGrid(lr.fitIntercept())
.addGrid(lr.elasticNetParam(), new double[] {0.0, 0.5, 1.0})
.build();
Note, that you will have to set the values of above parameters based on your data and problem type accordingly.
Step 8: Create a TrainValidationSplit instance:
TrainValidationSplit trainValidationSplit = new TrainValidationSplit()
.setEstimator(lr)
.setEvaluator(new RegressionEvaluator())
.setEstimatorParamMaps(paramGrid)
.setTrainRatio(0.8);
In this case, the estimator is simply the linear regression that we created in Step 4. Prepare the cancer diagnosis LabeledPoint RDDs. A TrainValidationSplit requires an Estimator, a set of Estimator ParamMaps, and an Evaluator that supports binary classification since our dataset has only two classes where 80% is used for the purpose of training and the remaining 20% for the validation.
Step 9: Run the TrainValidationSplit and choose the parameters
Run the TrainValidationSplit, and choose the best set of parameters for your problem using the training set. Just use the following code segments:
TrainValidationSplitModel model = trainValidationSplit.fit(training);
Step 10: Make predictions on the test set
Make predictions on the test data where the model is the model with a combination of parameters that performed the best. Finally, show the predictions. Just use the following code segment for doing so:
Dataset<Row> per_param = model.transform(test);
per_param.show();

Figure 14: Prediction against each feature and label
Therefore, if you compare these results with those shown in Figure 6, The newly created label and ID from the dataset; where ID is the number of rows, you find that the prediction accuracy increases for more sophisticated methods of measuring predictive accuracy that can be used to identify places where the error rate can be optimized depending on the costs of each type of error.