Chapter 2
Mastering the Basics of International Finance
In This Chapter
![]() Defining exchange rates
Defining exchange rates
![]() Understanding the difference between different types of exchange rates
Understanding the difference between different types of exchange rates
![]() Mastering the correct terminology related to changes in exchange rates
Mastering the correct terminology related to changes in exchange rates
![]() Figuring out the simple math of conversions, cross rates, and spreads
Figuring out the simple math of conversions, cross rates, and spreads
Exchange rates are the cornerstone of international finance. An exchange rate tells you the relative price of one currency in terms of another. In this chapter, you get familiar with the different types of exchange rates, such as nominal, real, and effective exchange rates. Additionally, although this chapter doesn’t discuss why exchange rates change (turn to Chapters 5, 6, and 7 for that information), it talks about the proper terminology to use when exchange rates change. The chapter also includes a little math, showing both how to convert an amount of money from one currency into another one and how to calculate the percent change in exchange rates, cross rates, and bid–ask spreads.
Making the Exchange: Exchange Rates
An exchange rate is nothing but a relative price — for example, how many apples you need to buy one orange. In fact, how many Mexican pesos you need to buy one U.S. dollar indicates the Mexican peso–dollar exchange rate. It implies the relative price of the dollar in terms of Mexican pesos.
Understanding exchange rates as the price of currencies
You pay $5 for a sandwich or $1 for a soda. It’s not surprising that we pay for goods and services with money. Everything has a price. Currencies are also exchanged, so they have a price as well. An exchange rate indicates the price of a currency in terms of another currency. If the dollar–euro exchange rate is $1.31, then you need $1.31 to buy one euro. In other words, the price of a euro in dollars is $1.31.
You can also look at an exchange rate as the relative price of a currency in terms of another currency. Consider a barter economy, where people exchange goods for other goods. In this situation, the price of a good is expressed in terms of the units of another good, which implies the relative price. Suppose you have only two goods, apples and oranges. The price of apples is expressed in terms of oranges — that is, the number of oranges you give up to buy one apple. If the answer is 2, then the price of an apple is two oranges. Conceptually, there’s no difference between the price of an apple (two oranges) and the price of a euro ($1.31).
Applying relative price to exchange rates
An exchange rate is a relative price because it represents the price of one currency in terms of another currency.
Assume that the dollar is the domestic currency and the euro is the foreign currency. The exchange rate between these two currencies implies how many dollars, the domestic currency, are necessary to buy one euro. However, because an exchange rate is a relative price, you can also define it as the number of euros necessary to buy one unit of the domestic currency (the dollar).
 If you define the exchange rate as the amount of domestic currency necessary to buy one euro, this definition implies the price of the euro in dollars. If you define the exchange rate as the number of euros necessary to buy one dollar, this definition indicates the price of the dollar in euros.
 Section C4 of the Wall Street Journal (WSJ) of September 10, 2012, listed the euro–dollar exchange rate as €0.7048. This rate means that you need €0.7048 to buy one dollar. This particular exchange rate implies the price of dollars in euros.
Although the WSJ doesn’t list the dollar–euro exchange rate or the price of euros in dollars, you can easily calculate it. Inverting the current exchange rate yields the dollar–euro exchange rate. If
![]()
then
![]()
Therefore, the dollar–euro exchange rate implies that you need $1.42 to buy one euro, which indicates the price of a euro in dollars.
Taking on Different Exchange Rates
This section explains the three main types of exchange rates and the information each type conveys. Nominal exchange rates are the ones the financial media quotes most commonly, but real and effective exchange rates are mentioned as well.
Nominal exchange rates
All reported exchange rates in financial media are nominal exchange rates, unless indicated otherwise. The nominal exchange rate reflects the relative price of two currencies.
Consider the previous euro–dollar exchange rate that was taken directly from the WSJ of September 10, 2012: €0.7048. This is an example of a nominal exchange rate. The only information the nominal exchange rate provides is the amount of one currency necessary to buy one unit of the other currency. Therefore, this exchange rate means that you need €0.7048 to buy one dollar.
Real exchange rates
You may be interested in getting more information than the relative price of two currencies, or the nominal exchange rate. For example, you may want to know what one dollar can buy in the Euro-zone countries or what one euro can buy in the United States. In this case, you’re interested in the real exchange rate (RER). The RER compares the relative price of two countries’ consumption baskets. Therefore, to calculate the RER, you need to know two things: the nominal exchange rate and the price of the two countries’ consumption baskets.
A country’s consumption basket tells you what the average consumer buys, and its price indicates how much consumers pay for it. For example, in the U.S., the Consumer Price Index (CPI) is calculated based on a consumption basket consisting of about 80,000 goods and services. Each country’s consumption basket is expressed in its domestic currency. If you know the nominal exchange rate and the prices of two countries’ consumption baskets, you can express the price of one country’s consumption basket in the other country’s currency. This information enables you to calculate the RER. In other words, you can compare the prices of two countries’ consumption baskets in the same currency.
Suppose you know the dollar–euro nominal exchange rate, the euro price of the European consumption basket, and the dollar price of the U.S. consumption basket. You may think, “Hey, I know! I can divide the two!” Nope! You can’t divide the price of the European consumption basket by that of the U.S. consumption basket because the prices of these consumption baskets are denominated in different currencies. Therefore, follow this concept:
RER = (Nominal exchange rate × Price of the foreign basket) / (Price of the domestic basket)
The next equation reflects this concept:
![]()
Here, RER, PE, and PUS indicate the real exchange rate, the price of the Euro-zone’s consumption basket, and the price of the U.S. consumption basket, respectively.
Consider a numerical example for the RER. Assume that the dollar–euro exchange rate is $1.42 per euro, PE (the price of the Euro-zone’s consumption basket) is €100, and PUS (the price of the U.S. consumption basket) is $142. In this case, the real exchange rate is 1:
![]()
In the previous equation, first note that, in the numerator, you multiply the dollar–euro exchange rate with a euro amount. Doing so changes the European basket so that it’s expressed in dollars. Second, note that you have the dollar price of the American basket in the denominator. Because now the price of both consumption baskets is expressed in dollars, you can compare them.
Suppose that the dollar–euro exchange rate increases to $1.52, but the prices of the Euro-zone and U.S. consumption baskets remain the same. In this case, the real exchange rate increases to 1.07:
![]()
This increase in the real exchange rate implies that the dollar price of the Euro-zone’s consumption basket increases, or the dollar’s purchasing power over the Euro-zone’s consumption basket falls. Alternatively, you can increase the price of the Euro-zone’s consumption basket or decrease the price of the U.S. basket to achieve an increase in the real exchange rate.
Suppose that the nominal exchange rate decreases to $1.35, with the prices of the Euro-zone and U.S. consumption baskets remaining the same. In this example, the real exchange rate decreases to 0.95:
![]()
A decline in the real exchange rate indicates that the dollar price of the Euro-zone’s consumption basket decreases, or the dollar’s purchasing power over the Euro-zone’s consumption basket increases. Again, you can also decrease the price of the Euro-zone’s consumption basket or increase the price of the U.S. basket to achieve a decline in the real exchange rate.
Effective exchange rates
Effective exchange rates compare a country’s currency to a basket of other countries’ currencies. The most common way to identify the basket of currencies is to consider a country’s major trade partners. In this case, the effective exchange rate is called the trade-weighted index because the weights attached to other countries’ currencies reflect the relevance of the home country’s trade with these countries.
The effective exchange rate measures the value of the domestic currency against the weighted value of a basket of foreign currencies, where the weights reflect the foreign countries’ share in the domestic country’s trade. Therefore, you use the effective exchange rate if you’re interested in the domestic currency’s performance compared to the country’s most important trade partners.
The effective exchange rate is usually expressed as an index number out of 100. An increase in the effective exchange rate indicates a strengthening of the home currency with respect to other currencies considered in its calculation. Conversely, a decline in the effective exchange rate means a weakening of the home currency.
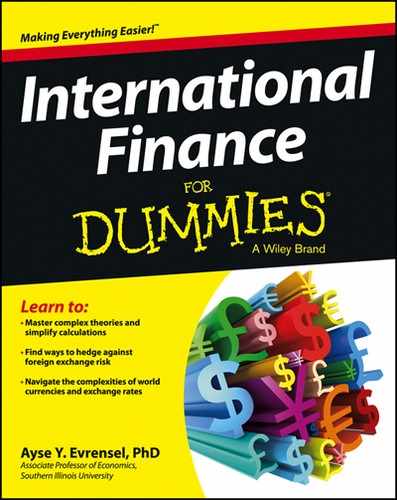
Figure 2-1 shows that, during the early 1980s and the late 1990s, the trade-weighted index for the dollar increased, indicating a strengthening of the dollar against its major trade partners. But the overall trend since 1973 shows a weakening of the dollar.
Notes: FRED, St. Louis Federal Reserve Bank. The data are available at http://research.stlouisfed.org/fred2/series/TWEXMMTH?cid=95. The index includes the Euro-zone, Canada, Japan, the United Kingdom, Switzerland, Australia, and Sweden. March 1973 =100.
Figure 2-1: Monthly trade-weighted U.S. dollar index.
Tackling Terminology: Changes in Exchange Rates
This section is all about calculating the changes in the exchange rate and using the correct terminology to express these changes. For now, don’t worry about why they change: Chapters 5, 6, and 7 discuss exchange rate determination and explain the reasons for the changes in exchange rates.
Also keep in mind that the change in exchange rates involves whether the currencies in question are freely exchanged in international foreign exchange markets, with minimum restrictions and interventions by governments or central banks. Chapter 14 examines government restrictions and central bank interventions.
Calculating the percent change
The percent change formula is a basic but useful tool. You can apply it to any variable that’s observed at various points in time. For all variables for which you want to measure the percent change, use the following formula:
![]()
Because the subject here is the exchange rate, suppose that X denotes the exchange rate. Also:
![]() %Δ is the percent change.
%Δ is the percent change.
![]() Xt is the exchange rate in the current period (t).
Xt is the exchange rate in the current period (t).
![]() Xt – i is the exchange rate in the previous period (t – i), where i can be yesterday, last month, last year, or ten years ago.
Xt – i is the exchange rate in the previous period (t – i), where i can be yesterday, last month, last year, or ten years ago.
To find the percent change in the exchange rate, start with the current exchange rate minus the previous exchange rate, divide that answer by the previous exchange rate, and then multiply by 100 to express the change as a percent.
Table 2-1 shows the monthly dollar–euro exchange rates as of the first of every month between January and August 2012.

 Even though the table title doesn’t explicitly indicate it, the exchange rates in Table 2-1 are nominal exchange rates. Remember that all exchange rates provided are the nominal exchange rates unless otherwise noted.
Table 2-1 lists the percent change in the exchange rate in the third column and the associated terminology in the fourth column. Focus on the percent change column for now. You don’t see any entry for January (the first observation) because you lose the first observation in percent change calculations. Take the percent change for February 1, 2012, which is +2.54 percent. Apply the percent change formula to the exchange rates (E) in January and February:
![]()
Another example is the percent change in the exchange rate in July 2012, which is a 2.1 percent decline:
![]()
All other percent changes in the third column are calculated similarly.
Defining appreciation and depreciation
The fourth column of Table 2-1 states the terminology associated with each change in the exchange rate. When you use the term appreciation or depreciation, make sure you’re referring to currencies that are traded in foreign exchange markets with no government interventions. As Chapter 14 explains, a country may unilaterally peg its currency for various reasons. In the absence of such government interventions, the exchange rate or the relative price of two currencies is determined mainly in foreign exchange markets through the buying and selling of currencies by market participants. Because the example exchange rate in Table 2-1 is the dollar–euro exchange rate, and both currencies are traded in international foreign exchange markets, you can use appreciation or depreciation to describe the changes in the exchange rate.
Table 2-1 shows that the dollar–euro exchange rate increased in February and August 2012 . Compared to the previous period, the changes in both months imply that more dollars were needed to buy one euro. Therefore, the fourth column refers to these months as depreciation in the dollar. In February and August 2012, there was a 2.54 and 1.04 percent depreciation in the dollar from their respective previous periods.
Because the example exchange rate is the dollar–euro rate, depreciation in the dollar means appreciation in the euro. You can invert the exchange dollar–euro rates in Table 2-1 and express them as euro–dollar rates. You can see that, in February and August 2012, the euro appreciated.
The following equations show that, from January to February 2012, fewer euros were needed to buy a dollar, which indicates the appreciation of the euro:
![]()
![]()
All other observation points in Table 2-1 (March, April, May, June, and July) indicate a negative percent change in the exchange rate, meaning that fewer dollars were needed to buy one euro. Therefore, Table 2-1 refers to these changes as appreciation of the dollar against the euro.
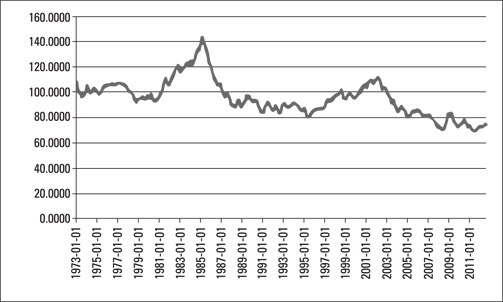
Check out the graph in Figure 2-2 and apply the terminology for changes in the exchange rates. Figure 2-2 shows changes in the monthly dollar–euro exchange rate since the introduction of the euro in 1999. Note that the dollar appreciates following the euro’s introduction until 2001, and then the dollar depreciates until early 2008.
Notes: FRED, St. Louis Federal Reserve Bank. The data are available at http://research.stlouisfed.org/fred2/series/EXUSEU?cid=95.
Figure 2-2: The dollar–euro monthly exchange rate.
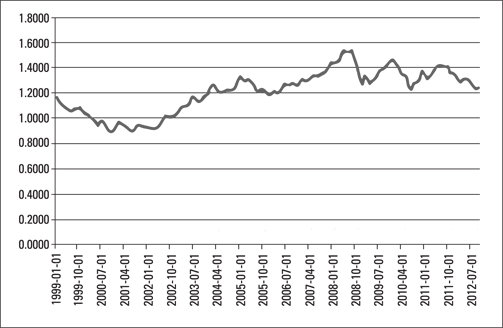
Note that Figure 2-2 illustrates the change in the nominal dollar–euro exchange rate, which indicates only the number of dollars necessary to buy one euro. Figure 2-3, on the other hand, shows the nominal effective exchange rates (NEER) for the euro and the dollar, which compare currencies with those of their respective trade partners.

Notes: The data are available at www.imf.org. NEER-E and NEER-D denote the nominal effective exchange rates for the euro and the dollar, respectively.
Figure 2-3: Nominal effective exchange rate (NEER) index for the euro and the dollar (2005 = 100).
Figure 2-3 shows an increase in the NEER for the dollar until 2001. This movement indicates an appreciation of the dollar compared to the currencies of major trade partners of the U.S. Then the NEER declines until 2008, indicating a depreciation of the dollar. After a slight appreciation until late 2009, the NEER for the dollar indicates depreciation again.
Figure 2-3 also shows the NEER for the euro. Compared to the currencies of the Euro-zone’s major trade partners, the euro depreciates following the introduction of the new currency in 1999. But between 2001 and 2009, the euro appreciates compared to the currencies of the Euro-zone’s major trade partners.
Finding revaluation and devaluation
When you read any financial newspaper, you note that a weakening in the dollar is reported as depreciation of the dollar. But if the same happens to the Chinese yuan, it’s phrased as the yuan being devalued. Professional people use a certain language, and it’s important to understand and use this language.
The terms revaluation and devaluation are used instead of appreciation and depreciation, respectively. However, to use the terms revaluation or devaluation, you need substantial government interventions in the exchange rate. The Chinese yuan is a good example for a currency whose value with respect to other currencies is determined by the Chinese government. This section doesn’t explain why China intervenes in the value of its currency in terms of other currencies; Chapter 14 examines these issues in detail. For now, the goal is to identify devaluation and revaluation, for example, on a graph.
Figure 2-4 shows the yuan–dollar annual exchange rate for the period 1981– 2011. The yuan–dollar exchange rate was CNY1.71 per dollar in 1981 and then steadily increased until 1994, when it reached CNY8.6397. Between 1994 and 2005, the yuan–dollar exchange rate remained above CNY8 per dollar. Beginning in 2005, the exchange rate declined, from CNY8.1936 in 2005 to CNY6.4630 in 2011. In the graph, you can use this information to calculate the percent change in the Chinese yuan and apply your knowledge of the terminology associated with the change in the exchange rate.
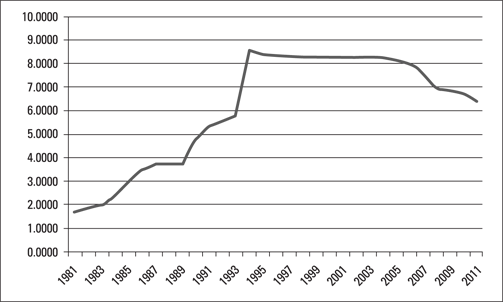
Notes: FRED, St. Louis Federal Reserve Bank. The data are available at http://research.stlouisfed.org/fred2/series/AEXCHUS?cid=32219.
Figure 2-4: The yuan–dollar exchange rate (1981–2011).
Consider the period of 1981–1994:
![]()
Here, E stands for the yuan–dollar exchange rate. A 405 percent increase in the yuan–dollar exchange rate is shown over a period of 14 years, which translates into an average annual devaluation of the yuan of almost 29 percent (405 ÷ 14).
Now apply the percent change formula to the 2005–2011 period:
![]()
This result indicates an average annual decline in the number of yuan necessary to buy one dollar of about 3.02 percent in the past seven years (21.12 ÷ 7), which is called a revaluation.
Grasping Exchange Rate Conversions
One of the most frequently used functions of exchange rates is to convert an amount of money denominated in one currency into another currency.
Exchange rate as the price of foreign currency
The dollar–euro exchange rate implies the price of the euro in dollars. You can use this exchange rate to convert a dollar amount into euros, or vice versa.
Suppose you’re an American exporter of backpacks. The importing firm in Germany wires a payment of €135,000 to your bank for the August 2012 shipment of backpacks. The bank deposits the money in your account as dollars, at an exchange rate of $1.24. What’s the total number of dollars deposited into your account?
The exchange rate is defined as $/€, and the amount of money is denominated in euros. You cancel the euros to find the amount in dollars by multiplying the euro payment by the dollar–euro exchange rate:
![]()
or
![]()
In this case, your bank deposits $167,400 into your account.
Suppose you’re an American importer of French cheese. You receive a new shipment for which you have to pay the French firm $185,000. If the French firm’s bank applies the dollar–euro exchange rate of $1.24, how many euros does the French firm receive?
Again, the exchange rate is defined as $/€, and the amount is denominated in dollars. You cancel the dollars to find the amount in euros by dividing the dollar payment by the dollar–euro exchange rate:
![]()
or
![]()
The German firm receives €149,194 from this transaction.
Exchange rate as the price of domestic currency
In this case, you work with the euro–dollar exchange rate, which implies the price of the dollar in euros. You can use this exchange rate to convert a dollar amount into euros, or vice versa.
Using the same example of the American exporter of backpacks who expects €135,000 as a payment for its latest shipment, this time you have the euro–dollar exchange rate of €0.80645 (the inverse of $1.24, or 1 ÷ 1.24; try to keep more than two decimals so that the amounts are the same as in the previous example). The exchange rate is defined as €/$, and the amount is denominated in euros. You cancel the euros to get the amount in dollars by dividing the euro total by the euro–dollar exchange rate:
![]()
or
![]()
Therefore, the American exporter receives $167,400, as in the previous example.
In the example of the American importer of French cheese, the French exporter is paid $185,000. The French firm’s bank applies the euro–dollar exchange rate of €0.80645 and deposits the dollar amount as euros.
This time the exchange rate is defined as €/$, and the amount is denominated in dollars. You cancel the dollars to get the amount in euros by multiplying the dollar amount by the euro–dollar exchange rate:
![]()
or
![]()
The French firm receives €149,193 from this transaction. (Note that the small discrepancy between this total and the previous result is due to rounding.)
Calculating Cross Rates
Financial media provide information only about the most frequently used exchange rates. Therefore, you may not have all the exchange rate information you need. No worries — the concept of cross rates helps you here. You can deduce information about other exchange rates based on the given exchange rates. The idea of cross rates implies two exchange rates with a common currency, which enables you to calculate the exchange rate between the remaining two currencies.
For example, you can easily find, say, the euro–dollar or the yen–dollar exchange rates in financial media. However, the euro–yen exchange rate may not be listed. Because the dollar is the common currency in this example, you can calculate the euro–yen (and also the yen–euro) exchange rate.
Section C4 of the WSJ of Monday, September 10, 2012, listed the yen–dollar and euro–dollar rates as ¥78.56 and €0.7802, respectively. Suppose you want to know the euro–yen exchange rate. In this case,
![]()
and
![]()
and you want to know what the following is:
![]()
Because the dollar is the common currency here, cancel it. Think in terms of the currencies involved: When you divide the euro–dollar exchange rate by the yen–dollar exchange rate, the dollars cancel and you get the euro–yen exchange rate:
![]()
Therefore, if you divide the euro–dollar exchange rate by the yen–dollar exchange rate,
![]()
the euro–yen exchange rate turns out to be €0.0099.
Figuring the Bid–Ask Spread
The bid–ask spread is important for two reasons. First, it gives you another opportunity to have more numerical exercises with exchange rates. Second, and most important, if you’re an international traveler, it helps when you exchange currencies. Otherwise, you’ll be surprised to find that the exchange rate at which you buy euros is different than the rate at which you sell euros on the same day and at the same bank.
Everybody has to make a living! This section describes the banks’ attempts to make a living by buying foreign currency at a lower price and selling it at a higher price, which is essentially what the bid–ask spread is all about. The bid and ask quotes or rates are essentially exchange rates at which the bank buys foreign currency from you and sells foreign currency to you.
Gaining insight at an international airport
You may have seen banks or exchange offices at airports. Usually, they have displays at their windows indicating their bid–ask rates for various currencies. Next time you see their displays, look closely: Their bid and ask rates differ.
Say you’re at Lambert International Airport in St. Louis and you observe the bid–ask rates indicated in Table 2-2. On this table, the ask rate refers to the rate you receive when you sell currency. The bid rate refers to the rate you pay when you buy currency. If the exchange office or the bank at the airport is to make money on this transaction, you pay more when you buy currency than when you sell the same amount of currency.

In Table 2-2, you buy euros at €0.6948 per dollar. If you want to buy €100, you pay $143.93 (€100 ÷ €0.6948). But if you want to sell €100, you sell them at €0.9021 per dollar and receive only $110.85 (€100 ÷ 0.9021).
In terms of the Turkish lira (TRY), if you buy TRY100, the rate of TRY1.5376 is applied so that you pay $65.04 (TRY100 ÷ TRY1.5376). If you sell TRY100, the rate of TRY2.0663 is applied and you receive $48.40 (TRY100 ÷ TRY2.0663). If you look at the buying and selling rates associated with the British pound and the Mexican peso, the results are similar: You pay more to buy foreign currency than you receive when selling it.
Finding the spread
The bid–ask spread (S) calculates the difference between the selling (ask) and buying price (bid) of a currency, in terms of percentage based on the following formula:
![]()
Here, Eask and Ebid refer to the exchange rate associated with selling and buying a currency, respectively.
Table 2-2 indicates the spreads associated with the currencies on the table. You can use the previous formula to calculate these spreads.
To calculate the spread on the euro–dollar exchange rate:
![]()
You can use the same formula for other bid and ask rates in Table 2-2 and calculate the spreads. As you can see in Table 2-2, bid–ask spreads vary among exchange rates. Various factors affect bid–ask spreads. First, trade volume associated with a currency is negatively related to spreads, in that currencies with higher trade volumes tend to have smaller spreads. Spreads associated with heavily traded currencies, such as the euro, pound, and yuan, tend to be smaller. Second, spreads increase with the volatility or the riskiness of a currency. If a currency exhibits relatively frequent and larger changes compared to other currencies, the bid–ask spread increases. You can see this in Table 2-2: The bid–ask spreads associated with the euro and the British pound are smaller than the spreads associated with the Turkish lira and the Mexican peso.