
Troubleshooting and logging are very much related; you start analyzing the Event, Service and System logs when you experience problems.
Troubleshooting problems and fixing the problems found in a cloud environment can be different from troubleshooting in more classic deployments. This chapter explains the differences, the challenges, and the new possibilities of troubleshooting Linux workloads in the Azure environment.
By the end of this chapter, you'll be able to:
- Achieve performance analysis in a Linux system using different tools.
- Monitor metrics such as CPU, memory, storage, and network details.
- Use Azure tooling to identify and fix problems.
- Use Linux tooling to identify and fix problems.
Technical Requirements
For this chapter, you'll need one or two VMs running a Linux distribution. You can use the smallest size if you want. The audit daemon must be installed and, for the purpose of having audit system logs to analyze and understand, it's a good idea to install Apache and a MySQL/MariaDB server.
Here is an example in CentOS:
sudo yum groups install ''Basic Web Server''
sudo yum install mariadbmariadb-server
sudo yum install setroubleshoot
sudosystemctl enable --now apache2
sudosystemctl enable --now mariadb
auditd gives in-depth details about your server performance and activity by using audit rules that can be modified based on your needs. To install audit daemon, use the following:
sudo yum list audit audit-libs
On executing the preceding command, you'll get the following output:

Figure 11.1: Installing the audit daemon
If you can see the list of installed audit packages as shown previously, then it's installed already; if not, then run the following command:
sudo yum install audit audit-libs
After installing auditd successfully, you need to start the auditd service to start collecting audit logs and then store the logs:
sudo systemctl start auditd
If you want to start auditd at boot time, then you have to use the following command:
sudo systemctl enable auditd
Now let's verify whether auditd is successfully installed and has started collecting logs using the following command:
tail -f /var/log/audit/audit.log

Figure 11.2: Verifying the successful installation of auditd and collection of logs
In this chapter, we will cover general Azure management and Azure Monitor. The Log Analytics agent for Linux, which is needed to collect information from the VM, is not supported in every Linux distribution; please visit https://docs.microsoft.com/en-us/azure/virtual-machines/extensions/oms-linux before making a decision about which distribution you want to use in this chapter.
Note
Operations Management Suite (OMS) in general was retired and transitioned to Azure and the name ''OMS'' is not used anywhere anymore, except in some variable names. It is now known as Azure Monitor. For more information on naming and terminology changes, please refer to https://docs.microsoft.com/en-gb/azure/azure-monitor/terminology, or you can also get detailed information about the transition at https://docs.microsoft.com/en-us/azure/azure-monitor/platform/oms-portal-transition.
Accessing Your System
Learning to troubleshoot your workloads will help you in your daily job. Troubleshooting in Azure is not different from doing so in other environments. In this section, we are going to see some tips and tricks that will help you in your daily job.
No Remote Access
When you don't have access to your Azure VM via SSH, you can run commands via the Azure portal.
To run a command on your Azure VM from the Azure portal, log in to your Azure portal, navigate to your VM and select Run Command:

Figure 11.3: Navigating to the VM section within the Azure portal
Alternatively, you can use the command line, as follows:
az vm run-command invoke --name <vm name>
--command-id RunShellScript
--scripts hostnamectl
--resource-group <resource group>
The az vm run command can be used to run shell scripts in your VM for general machine or application management and to diagnose issues.
Whether you are doing it via the command line or via the Azure portal, the az vm command only works if the Microsoft Azure Linux agent is still running and reachable.
Note
You can get the latest Microsoft Azure PowerShell repository at https://github.com/Azure/azure-powershell, which has the installation steps and its usage. az is replacing AzureRM and all the new Azure PowerShell features will be available only in az going forward.
As per the security best practice, you need to change the password by logging in to your Azure account and using az vm user to reset the password as follows:
az vm user update
--resource-group myResourceGroup
--name myVM
--username linuxstar
--password myP@88w@rd
This only works if you have a user that is configured with a password. If you deployed your VM with SSH keys, then you are lucky: the Reset password option in the same section will do the job.
This option uses the VMAccess extension (https://github.com/Azure/azure-linux-extensions/tree/master/VMAccess). Like the Run command option discussed earlier, it needs the Azure VM Agent.
Working on the Port
The reason that you don't have remote access may be network-related. In Chapter 5, Advanced Linux Administration, the ip command was briefly introduced in the Networking section. You can use this command to verify the IP address and the route table.
On the Azure site, the network and the network security groups must be checked, as covered in Chapter 3, Basic Linux Administration. In the VM, you can use the ss command, such as ip, which is a part of the iproute2 package to list the UPD (-u) and TCP (p) ports in a listening state, together with the process ID (-p) that opened the port:
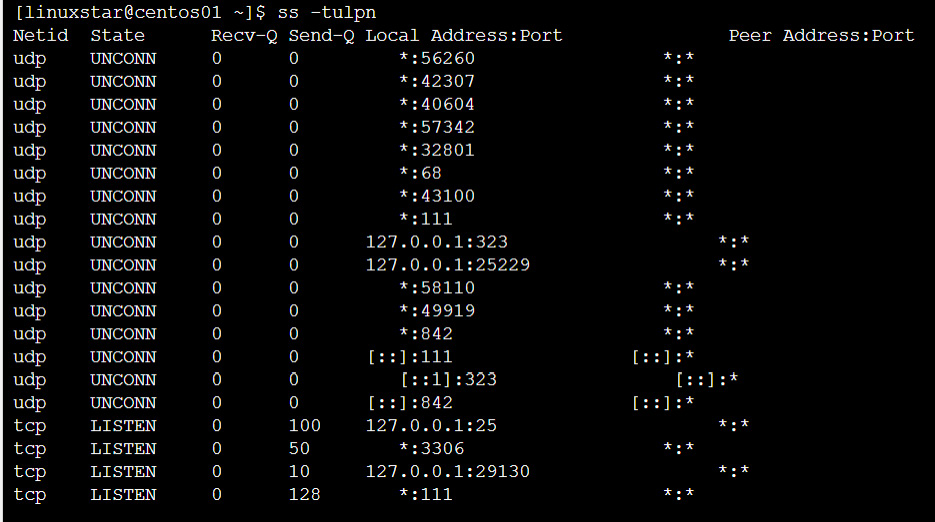
Figure 11.4: Using the ss -tulpn command to check the ports
A quick check on the firewall rules can be done with firewall-cmd --list-all --zone=public; if you have multiple zones and interfaces, you need to execute this for every zone. To include the rules created by Azure Service Fabric, iptables-save can help:
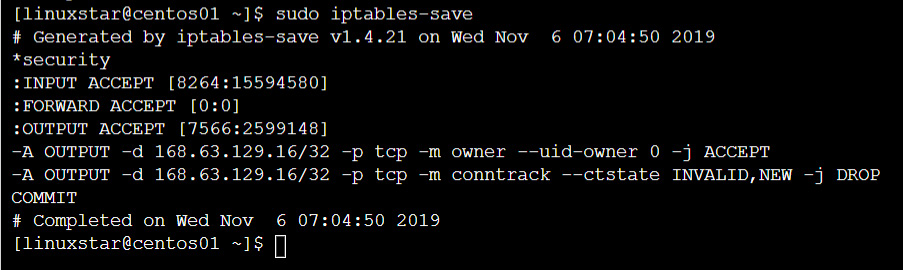
Figure 11.5: Including the rules created by Azure Service Fabric
Unfortunately, there is no comment available to see all the access rules configured at the systemd unit level. Don't forget to verify them, as discussed in Chapter 6, Managing Linux Security and Identities.
Using nftables
nftables is easier to use than iptables and it combines the whole iptables framework with a simple syntax. nftables is built on a kernel netfilter subsystem that can be used to create grouped, complex filtering rules. nftables has many advantages over iptables. For instance, it allows you to perform multiple actions using a single rule. It uses the nft command-line tool, which can be used in interactive mode as well by using the nft -i command:
- Install nftables using the following command:
sudo apt install nftables
- Then install compat, which loads the compatibility with the nftables kernel subsystem:
apt install iptables-nftables-compat
- Finally, enable the nftables service using the following command:
sudo systemctl enable nftables.service
- You can view the current nft configuration using this:
nft list ruleset
- Also, you can log into nft interactive mode using the following command:
nft –i
- Now you can list the existing ruleset by using the following list command:
nft> list ruleset
- Let's create a new table, rule_table1:
nft>add table inet rule_table1
- Now we will need to add the chain command to accept inbound/outbound traffic as follows:
nft>add chain inet rule_table1 input { type filter hook input priority 0 ; policy accept; }
nft>add chain inet rule_table1 output { type filter hook input priority 0 ; policy accept; }
- You can use the following command to add rules to accept TCP (Transmission Control Protocol) ports:
nft>add rule inet rule_table1 input tcpdport { ssh, telnet, https, http } accept
nft>add rule inet rule_table1 output tcpdport { https, http } accept
- Here is the output of our new nftables configuration:
nft> list ruleset
table inet rule_table1 {
chain input {
type filter hook input priority 0; policy accept;
tcpdport { ssh, telnet, http, https } accept
}
chain output {
type filter hook input priority 0; policy accept;
tcpdport { http, https } accept
}
}
Boot Diagnostics
Let's say you've created your VM, probably orchestrated, and most likely it's your own VM, but it doesn't boot.
Before enabling the boot diagnostics on your VMs, you'll need a storage account to be able to store the data. You can list the storage accounts that are already available with the az storage account list and, if needed, you can create one with the az storage account create command.
Now let's enable the boot diagnostics by entering the following command in the Azure CLI:
az vm boot-diagnostics enable --name <vm name>
--resource-group <resource group>
--storage <url>
The difference is that you don't need the name of the storage account, but the name of the storage blob, which can be found with the az storage account list command as a property of the storage account.
Execute the following in the Azure CLI to receive the boot log:
az vm boot-diagnostics get-boot-log
--name <virtual machine>
--resource-group <resource group>
The output is also automatically stored in a file; in the Azure CLI, it's a good idea to pipe it through less or redirect it to a file.
Logging in Linux
Many processes, services, and applications run on typical Linux systems, which produce different logs, such as application, event, service, and system logs, that can be used for auditing and troubleshooting. In earlier chapters, we encountered the journalctl command, which is used for querying and displaying logs. In this chapter, we'll discuss this command in much more detail and look at how you can slice and dice your logs using the journalctl utility.
In Linux distributions, such as the latest versions of RHEL/CentOS, Debian, Ubuntu, and SUSE, which use systemd as their init system, the systemd-journald daemon is used for logging. This daemon collects the standard output of a unit, a syslog message, and (if the application supports it) directs messages from the application to systemd.
The logs are collected in a database that can be queried with journalctl.
Working with journalctl
If you execute systemctl status <unit>, you can see the last entries of the log. To see the full log, journalctl is the tool that you need. There is a difference with systemctl: you can view the status on other hosts using the -H parameter. You can't use journalctl to connect to other hosts. Both utilities have the –M parameter to connect to the systemd-nspawn and Rkt containers.
To view the entries in the journal database, execute this:
Sudo journalctl --unit <unit>

Figure 11.6: Viewing the entries in the journal database
By default, the log is paged with less. If you want another pager, such as more, then you can configure it via the /etc/environment file. Add the following line:
SYSTEMD_PAGER=/usr/bin/more
Here is an example of the output:

Figure 11.7: Using the journalctl command to get the log entries of the processes
Let's examine the output:
- The first column is the timestamp. In the database, it's defined in EPOCH time, so if you change your time zone, no problem: it will be translated.
- The second column is the hostname, as shown by the hostnamectl command.
- The third column contains an identifier and the process ID.
- The fourth column is the message.
You can add the following parameters to filter the logs:
- --dmesg: Kernel messages, a replacement for the old dmesg command
- --identifier: Identifier string
- --boot: Messages during the current boot process; you can also select previous boots if the database is persistent across reboots
Filters
Of course, you can grep on the standard output, but journalctl has some parameters that really help to filter out the information you want:
- --priority: Filter on alert, crit, debug, emerg, err, info, notice, and warning. The classification of these priorities is the same as in the syslog protocol specification.
- --since and --until: Filter on timestamp. Refer to man systemd.time to see all the possibilities.
- --lines: Number of lines, similar to tail.
- --follow: Similar behavior to tail -f.
- --reverse: Puts the last line first.
- --output: Changes the output format to formats such as JSON, or adds more verbosity to the output.
- --catalog: Adds an explanation of the message if one is available.
All the filters can be combined, as here:
sudo journalctl -u sshd --since yesterday --until 10:00
--priority err
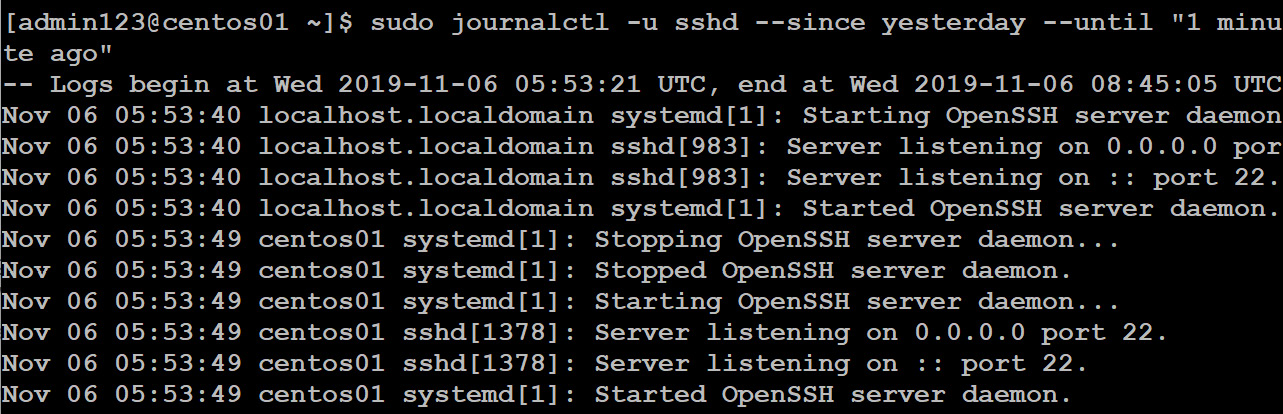
Figure 11.8: Filtering the log entries by using multiple filters with journalctl
Filtering Based on Fields
We can also filter on fields. Type this:
sudojournactl _
Now press Ctrl + I twice; you'll see all the available fields. The same principle applies to these filters; that is, you can combine them:
sudo journalctl _UID=1000 _PID=1850
You can even combine them with normal filters:
sudo journalctl _KERNEL_DEVICE=+scsi:5:0:0:0 -o verbose
Database Persistence
Now you may need to store the logs for a certain period of time for compliance reasons or audit requirements. So, you can use an Azure Log Analytics agent to collect logs from different sources. By default, the logging database is not persistent. To make it persistent, for any audit- or compliance-related reason (though it is not a best practice to store the logs in localhost), you have to edit the configuration file, /etc/systemd/journald.conf.
Change the #Storage=auto line to this:
Storage=persistent
Restart the systemd-journald daemon with force:
sudo systemctl force-reload systemd-journald
Use this to view the recorded boots:
sudo journalctl --list-boots

Figure 11.9: Viewing the recorded boots
You can add the boot ID as a filter using the --boot parameter:
journalctl --priority err --boot <boot id>
By this means, the output of hostnamectl shows the current boot ID.
The journal database is not dependent on the daemon. You can view it using the --directory and --file parameters.
Syslog Protocol
Logging in Linux and other members of the Unix family was enabled during the implementation of the syslog protocol. It is still used to send logging to remote services.
It is important to understand that this protocol uses facilities and severity. Both are standardized in RFC 5424 (https://tools.ietf.org/html/rfc5424). Here, a facility specifies the type of program that is logging the message; for instance, the kernel or cron. The severity label is there to describe the impact, such as informational or critical.
The programmers' man page for syslog (man 3 syslog) also gives a good insight into these facilities and severities and shows how a program can use this protocol. The bad news about syslog is that it only works if the application supports it and the application runs long enough to provide this functionality. journald is able to get everything regarding the output of a program.
Adding Log Entries
You can manually add entries to a log. For syslog, the logger command is available:
logger -p <facility.severity> "Message"
For journald, there is systemd-cat:
systemd-cat --identifier <identifier> --priority <severity><command>
Let's look at an example:
systemd-cat --identifier CHANGE --priority info
echo "Start Configuration Change"
As an identifier, you can use free strings or syslog facilities. Both logger and systemd-cat can be used to generate entries in your log. You can use this if the application doesn't have syslog support; for instance, in an Apache configuration, you can use this directive:
errorlog "tee -a /var/log/www/error/log | logger -p local6.info"
You can also use this as a part of change management.
Integrating journald with RSYSLOG
To collect your data for your own monitoring service, your monitoring service needs syslog support. Good examples of these monitoring services are available as a ready-to-go VM in Azure: Splunk and the Elastic Stack.
RSYSLOG is the most commonly used syslog protocol implementation nowadays. It's already installed by default in Ubuntu-, SUSE-, and Red Hat–based distributions.
RSYSLOG can work very well together with the journal database using the imjournal module. In SUSE- and Red Hat–based distributions, this is already configured; in Ubuntu, you have to make a modification to the /etc/rsyslog.conf file:
# module(load="imuxsock")
module(load="imjournal")
After the modification, restart RSYSLOG:
sudo systemctl restart rsyslog
Using the settings in /etc/rsyslog.d/50-default.conf, it logs to plain text files.
To send everything coming from the local syslog to a remote syslog server, you have to add the following to this file:
*. * @<remote server>:514
Note
This is the name of the file in Ubuntu. In other distributions, use /etc/rsyslog.conf.
Use @@ if you want TCP instead of the UDP protocol.
Other Log Files
You can find log files of applications that don't support syslog or systemd-journald in the /var/log directory structure. One important file to notice is the /var/log/waagent.log file, which contains the logging from the Azure Linux VM agent. There is also the /var/log/azure directory, which contains logging from other Azure agents (such as Azure Monitor) and VM extensions.
Azure Log Analytics
Azure Log Analytics is a part of Azure Monitor that collects and analyzes log data and takes the appropriate actions. It is a service in Azure that collects log data from multiple systems in a single data store in a central place. It consists of two important components:
- The Azure Log Analytics portal, with alerts, reports, and analysis features
- The Azure Monitor agent, which needs to be installed on a VM
There is also a mobile app available (in the iOS and Android store, you can find it under the name Microsoft Azure) if you want to view the state of your workloads while you are on the go.
Configuring the Log Analytics Service
In the Azure portal, select All Services from the left-hand bar and search for Log Analytics. Select Add and create a new Log Analytics workspace. At the time of writing, it is not available in all regions. Using the service is not limited to the region; if a VM is in another region, you can still monitor it.
Note
There is no upfront cost for this service and you pay for what you use! Read http://aka.ms/PricingTierWarning for more details.
Another way to create the service is with the Azure CLI:
az extension add -n application-insights
After the creation of the service, there is a pop-up that allows you to navigate to the newly created resource. Alternatively, you can search again in All Services.
Please note, at the top-right of the resource pane, Azure Monitor and the workspace ID; you'll need this information later on. Navigate to Advanced settings to find the workspace key.
In the Azure CLI, you can collect this information using the following:
az monitor app-insights component create --app myapp
--location westus1
--resource-group my-resource-grp
To list all the workspaces of your Azure subscription, you can use the following Azure CLI command:
az ml workspace list
You can get detailed information about a workspace in JSON format using the following Azure CLI command:
az ml workspace show -w my-workspace -g my-resource-grp
Installing the Azure Log Analytics Agent
Before installing the Azure Monitor agent, make sure that the audit package (in auditd) is installed.
To install the Azure Monitor agent in a Linux VM, you have two possibilities: enable the VM extension OMSAgentforLinux, or download and install the Log Analytics Agent in Linux.
First, set some variables to make the scripting easier:
$rg = "<resource group>"
$loc = "<vm location>"
$omsName = "<OMS Name>"
$vm = "<vm name">
You need the workspace ID and key. The Set-AzureVMExtension cmdlet needs the keys in JSON format, so a conversion is needed:
$omsID = $(Get-AzOperationalInsightsWorkspace '
-ResourceGroupName $rg -Name $omsName.CustomerId)
$omsKey = $(Get-AzOperationalInsightsWorkspaceSharedKeys '
-ResourceGroupName $rg -Name $omsName).PrimarySharedKey
$PublicSettings = New-Object psobject | Add-Member '
-PassThruNotePropertyworkspaceId $omsId | ConvertTo-Json
$PrivateSettings = New-Object psobject | Add-Member '
-PassThruNotePropertyworkspaceKey $omsKey | ConvertTo-Json
Now you can add the extension to the VM:
Set-AzureVMExtension -ExtensionName "OMS" '
-ResourceGroupName $rg -VMName $vm '
-Publisher "Microsoft.EnterpriseCloud.Monitoring"
-ExtensionType "OmsAgentForLinux" -TypeHandlerVersion 1.0 '
-SettingString $PublicSettings
-ProtectedSettingString $PrivateSettings -Location $loc
The previous procedure is pretty complex and takes a while. The download method is easier, but you have to log in to your VM via SSH as a guest. Of course, both methods can be automated/orchestrated:
cd /tmp
wget
https://github.com/microsoft/OMS-Agent-for-Linux
/blob/master/installer/scripts/onboard_agent.sh
sudo -s
sh onboard_agent.sh -w <OMS id> -s <OMS key> -d
opinsights.azure.com
If you have problems during the installation of the agent, look in the /var/log/waagent.log and /var/log/azure/Microsoft.EnterpriseCloud.Monitoring.OmsAgentForLinux/*/extension.log configuration files.
The installation of the extensions also creates a configuration file for rsyslog,/etc/rsyslogd.d/95-omsagent.conf:
kern.warning @127.0.0.1:25224
user.warning @127.0.0.1:25224
daemon.warning @127.0.0.1:25224
auth.warning @127.0.0.1:25224
syslog.warning @127.0.0.1:25224
uucp.warning @127.0.0.1:25224
authpriv.warning @127.0.0.1:25224
ftp.warning @127.0.0.1:25224
cron.warning @127.0.0.1:25224
local0.warning @127.0.0.1:25224
local1.warning @127.0.0.1:25224
local2.warning @127.0.0.1:25224
local3.warning @127.0.0.1:25224
local4.warning @127.0.0.1:25224
local5.warning @127.0.0.1:25224
local6.warning @127.0.0.1:25224
local7.warning @127.0.0.1:25224
It basically means that the syslog messages (facility.priority) are sent to the Azure Monitor agent.
At the bottom pane of the new resource, there is a section entitled Get started with Log Analytics:

Figure 11.10: Get started with Log Analytics section in Azure Portal
Click on Azure virtual machines (VMs). You'll see the VMs that are available in this workspace:
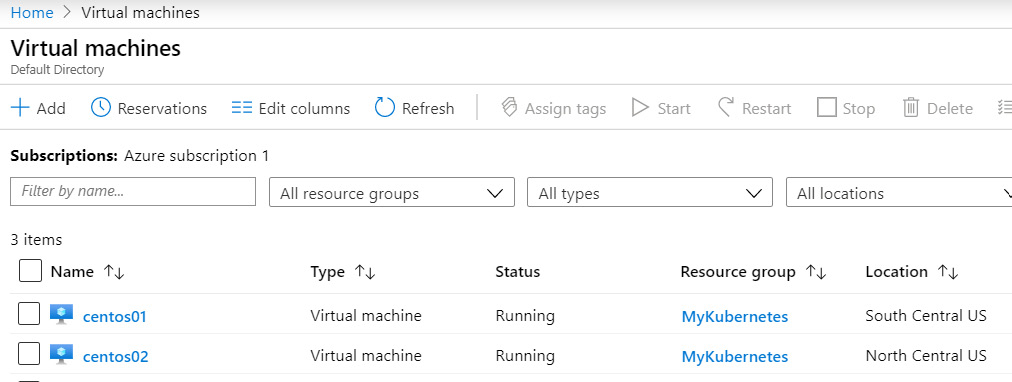
Figure 11.11: Available VMs in the workspace
The preceding screenshot represents the available VMs in the workspace. It also shows that we have connected to the data source.
Getting the Data
In the Advanced settings section of this resource, you can add performance and syslog data sources. You can access all the data via the log search using a special query language. If you are new to this language, you should visit https://docs.loganalytics.io/docs/Learn/Getting-Started/Getting-started-with-queries and https://docs.loganalytics.io/index.
For now, just execute this query:
search *
To see whether there is data available, limit the search to one VM:
search * | where Computer == "centos01"
Alternatively, to get all the syslog messages, as a test, you can reboot your VM, or play with this:
logger -t <facility>. <priority> "message"
Execute the following query in syslog to view the results:
Syslog | sort
There are also many examples available if you click on the Saved searches button.
Monitoring solutions provide a very interesting add-on to make this process even easier. In the Resource pane, click on View solutions:

Figure 11.12: Navigating to the monitoring solutions option
Select the desired option and click on Add:
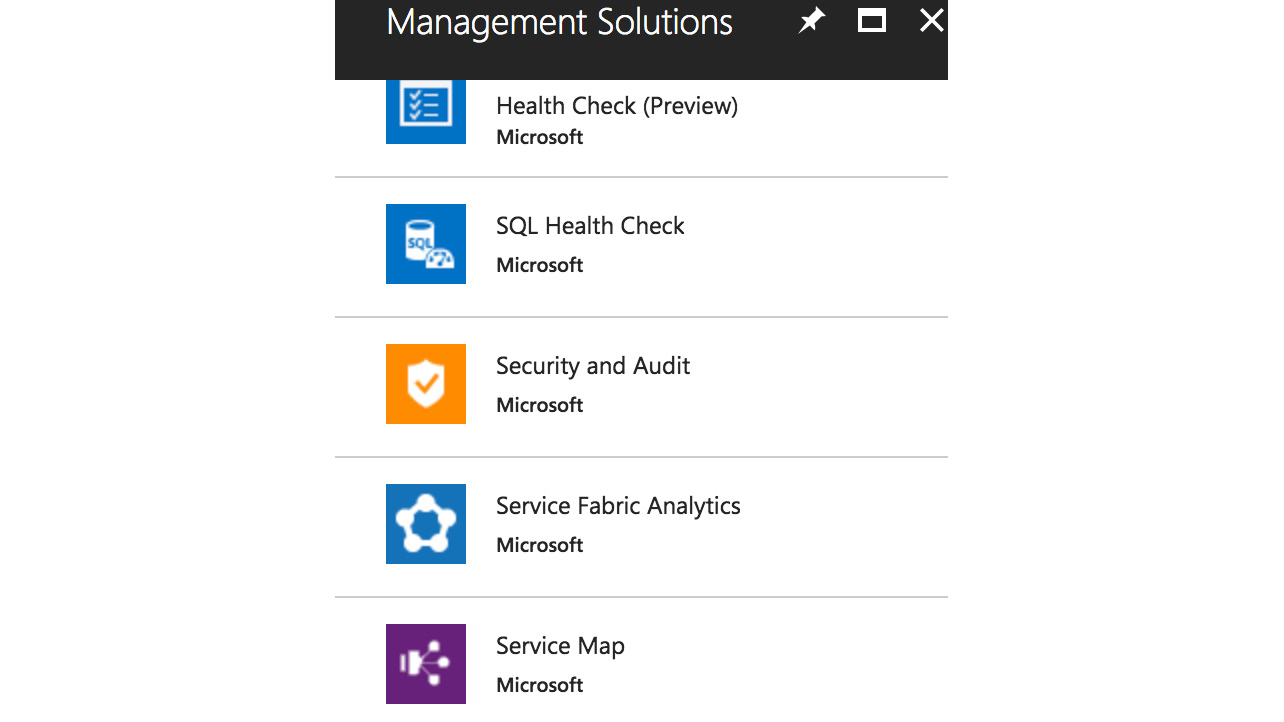
Figure 11.13: Management Solutions within Log Analytics
Service Map is an important service. It gives a great overview of your resources and provides an easy interface for logs, performance counters, and so on. After installing Service Map, you have to install an agent in the Linux machine, or you can log in to the portal and navigate to the VM, which will install the agent automatically for you:
cd /tmp
wget --content-disposition https://aka.ms/dependencyagentlinux
-O InstallDependencyAgent-Linux64.bin
sudo sh InstallDependencyAgent-Linux64.bin -s
After the installation, select Virtual Machines > Monitoring > Insights > Service Map.
Now, click on Summary:

Figure 11.14: The Summary section of the Service Map
You can monitor your applications, view the log files, and so on:

Figure 11.15: Service Map overview
Log Analytics and Kubernetes
In order to manage your containers, you need detailed insights into CPU, memory, storage, and network usage and performance information. Azure Monitor can be used to view Kubernetes logs, events, and metrics, allowing for container monitoring from a single location. You can enable Azure Monitor for containers for your new or existing AKS deployments using the Azure CLI, Azure PowerShell, the Azure portal, or Terraform.
To create a new AKS (Azure Kubernetes Service) cluster, use the az aks create command:
az aks create --resource-group MyKubernetes --name myAKS --node-count 1 --enable-addons monitoring --generate-ssh-keys
To enable Azure Monitor for your existing AKS cluster, use the az aks command with this modification:
az aks enable-addons -a monitoring -n myAKS -g MyKubernetes
You can enable monitoring for your AKS cluster from the Azure portal by selecting Monitor and then selecting Containers. Here, select the Non-monitored clusters, then choose the container and click Enable:

Figure 11.16: Monitoring AKS cluster from the Azure portal
Log Analytics for Your Network
Another solution in Azure Log Analytics is Traffic Analytics. It visualizes network traffic to and from your workloads, including open ports. It is able to generate alerts for security threats, for instance, if an application tries to reach a network that it's not allowed to access. Also, it provides detailed monitoring options with log export options.
If you want to use Traffic Analytics, first you have to create a network watcher for every region you want to analyze:
New-AzNetworkWatcher -Name <name> '
-ResourceGroupName<resource group> -Location <location>
After that, you have to reregister the network provider and add Microsoft Insights so the network watcher can hook into it:
Register-AzResourceProvider -ProviderNamespace '
"Microsoft.Network"
Register-AzResourceProvider -ProviderNamespaceMicrosoft.Insights
You can't use this solution with other providers, such as Microsoft.ClassicNetwork.
The next step involves using network security group (NSG), which controls the flow of logging by allowing or denying the incoming traffic. At the time of writing, this is only possible using the Azure portal. In the left-hand bar of the Azure portal, select Monitor>Network watcher and then select NSG flow logs. Now you are able to select the NSG that you want to enable an NSG flow log for.
Enable it, select a storage account, and select your Log Analytics workspace.
It will take some time before the information comes in and is collected. After about 30 minutes, the first information should be visible. Select Monitor in the left-hand bar of the Azure portal, go to Network watcher, and then Traffic Analytics. Alternatively, start from your Log Analytics workspace:

Figure 11.17: Viewing the network traffic flow distribution with Traffic Analytics
Performance Monitoring
In Azure Monitor, there are many options available for monitoring. For instance, performance counters give you a lot of insight into your workload. There are also application-specific options.
Even if you don't use Azure Monitor, Azure can provide all kinds of metrics for each VM, but not in one central place. Just navigate to your VM. In the Overview pane, you can see performance data for CPU, memory, and storage. Detailed information is available in the Metrics section, under Monitoring. All kinds of data are available, such as CPU, storage, and networking data:
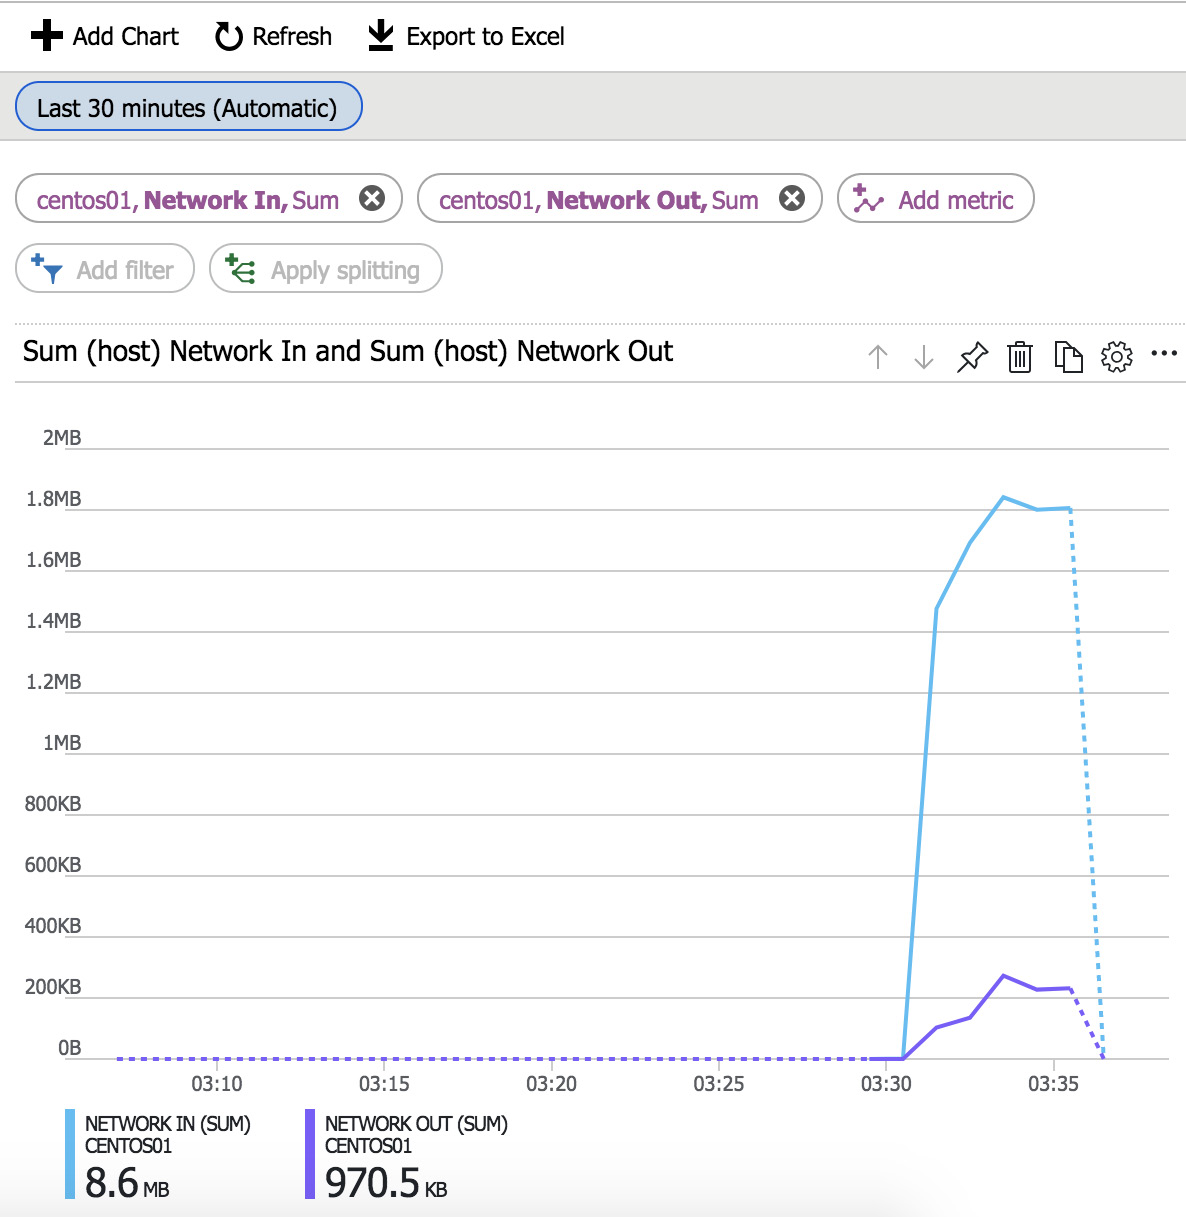
Figure 11.18: Viewing the performance data of the VM
The problem with many of these solutions is that they are application-specific, or you are looking at the end result without knowing what the cause is. If you need information about the general performance of the resources utilized by the virtual machine(s), use the information provided by Azure. If you need information on the web server or database you're running, look and see whether there is an Azure solution. But in many scenarios, it is very helpful if you can do performance troubleshooting in the VM as well. In a way, we're going to start where the Process management section in Chapter 3, Basic Linux Administration, left off.
Before we start, there are multiple methods and ways of doing performance troubleshooting. Can this book provide the only method you should use, or tell you the one tool you'll need? No, unfortunately not! But what it can do is make you aware of the tools that are available and cover at least their basic usage. For more specific needs, you can always dive into the man pages. In this section, we're especially looking into what the load is and what is causing it.
And one last thing: this section is called Performance monitoring, but that may not be the perfect title. It's balancing monitoring, troubleshooting, and analysis. However, isn't that often the case in the daily life of every system engineer?
Not all the tools mentioned are available by default in the Red Hat/CentOS repository. You'll need to configure the epel repository: yum install epel-release.
Displaying Linux processes with top
If you look into a topic such as performance monitoring and Linux, top is always mentioned. It is the number-one command to use to quickly get an idea of what is running on a system.
You can display many things with top, and it comes with a good man page explaining all the options. Let's focus on the most important ones, starting at the top of the screen:
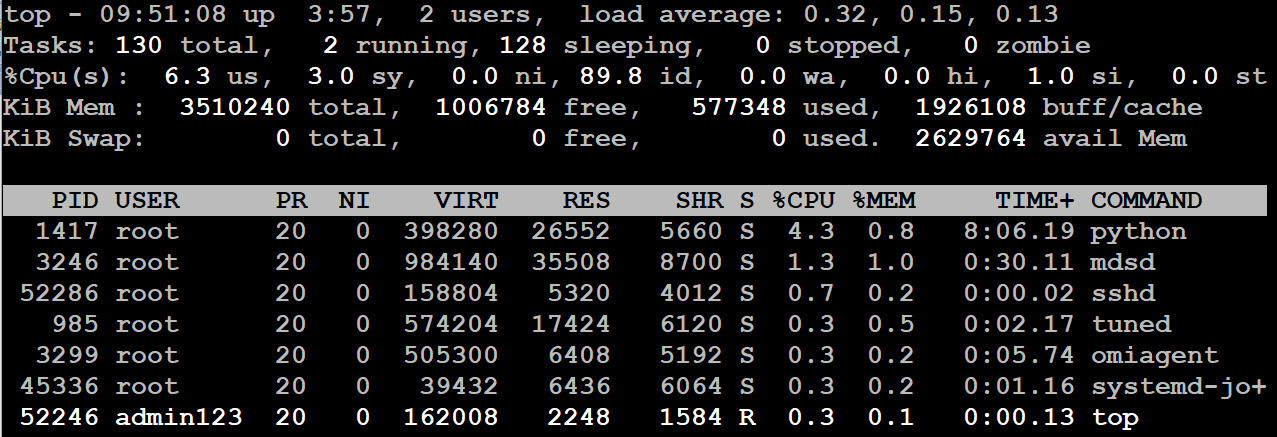
Figure 11.19: Displaying resource usage using the top command
Let's take a look at the options mentioned in the preceding screenshot:
- Wait IO (wa): If this value is continuously above 10%, this means that the underlying storage is slowing down the server. This parameter shows the CPU waiting time for I/O processes. Azure VMs use HDDs instead of SSDs, and using multiple HDDs in a RAID configuration can help, but it's better to migrate to SSDs. If that is not enough, there are premium SSD solutions available as well.
- Userspace CPU (us): CPU utilization by applications; please note that the CPU utilization is totaled across all CPUs.
- System CPU (sy): The amount of time the CPU spends on kernel tasks.
- Swap: Memory paged out caused by having not enough memory for your applications. It should be zero most of the time.
The bottom of the top screen also has some interesting columns:

Figure 11.20: The bottom entries of the output obtained from the top command
Personally, we wouldn't advise worrying about the priority and nice values for now. The effect on the performance is minimal. The first interesting field is VIRT (virtual memory). This refers to the amount of memory the program can access at present. It includes memory shared with other applications, video memory, files that are read into memory by the application, and more. It also includes idle memory, swapped memory, and residential memory. Residential memory is memory that is physically in use by this process. SHR is the amount of memory that is shared between applications. This information can give you an idea of the amount of swap you should configure on your system: take the top five processes, add up VIRT, and subtract RES and SHR. It's not perfect, but it's a good indicator.
The S column in the preceding screenshot is the status of the machine:
- D is uninterruptible sleep, most of the time caused by waiting on storage or network I/O.
- R is running—consuming CPU.
- S is sleeping—waiting on I/O, no CPU usage. Waiting for a trigger by a user or another process.
- T is stopped by the job control signal, most of the time because the user pressed Ctrl + Z.
- Z is zombie—the parent process has died. It's labeled as a zombie by the kernel while the kernel is busy cleaning up. On physical machines, it can also be an indication of failing CPUs (caused by temperature or shoddy bios); in that scenario, you may see many zombies. In Azure, this won't happen. Zombies don't hurt, so don't kill them; the kernel takes care of them.
Top Alternatives
There are many utilities similar to top, such as htop, which looks fancier and is easier to configure.
Very similar but even more interesting is atop. It contains all the processes and their resource usage, even for processes that died between screen updates of atop. This comprehensive accounting is very helpful for understanding problems with individual short-lived processes. atop is also able to gather information about running containers, networking, and storage.
Another one is nmon, which is similar to atop, but is more focused on statistics and gives more detailed information, especially for memory and storage:

Figure 11.21: Performance details of memory, CPU and storage
nmon can also be used to collect data:
nmon -f -s 60 -c 30
The preceding command collects 30 rounds of information every minute in a comma-separated file format that is easy to parse in a spreadsheet. On the IBM's developers website, http://nmon.sourceforge.net/pmwiki.php?n=Site.Nmon-Analyser, you can find an Excel spreadsheet that makes this a very easy job. It even offers some extra data-analyzing options.
glances is also gaining a lot of popularity lately. It is Python-based and provides current information about the system, uptime, CPU, memory, swap, network, and storage (disk I/O and file):

Figure 11.22: Using the glances utility to view the performance
glances is the most advanced alternative to top. It offers all the features of the alternatives, and, on top of that, you can use it remotely. You need to provide the username and password of your server to launch glances:
glances --username <username> --password <password> --server
Execute the following on the client too:
glances --client @<ip address>
By default, port 61209 is used. If you use the –webserver parameter instead of --server, you don't even need a client. A complete web interface is available on port 61208!
glances is able to export logs in many formats and can be queried using an API. Experimental support for the SNMP (Simple Network Management Protocol) protocol is on the way as well.
Sysstat – a Collection of Performance-Monitoring Tools
The sysstat package contains utilities for performance monitoring. The most important ones in Azure are sar, iostat, and pidstat. If you are also using Azure Files, cifsiostat can be very handy as well.
sar is the main utility. The main syntax is this:
sar -<resource> interval count
For instance, use this command to report CPU statistics 5 times with an interval of 1 second:
sar -u 1 5
To monitor cores 1 and 2, use this:
sar -P 1 2 1 5
(If you want to monitor all the cores individually, you can use the ALL keyword.)
Here are some other important resources:
- -r: Memory
- -S: Swap
- -d: Disk
- -n <type>: Network types, such as these:
DEV: Displays network devices statistics
EDEV: Displays network devices failure (error) statistics
NFS: Displays NFS (Network File System) client activities
SOCK: Displays sockets in use for IPv4
IP: Displays IPv4 network traffic
TCP: Displays TCPv4 network traffic
UDP: Displays UDPv4 network traffic
ALL: Displays all of the preceding information
pidstat can collect CPU data from a specific process by its process ID. In the next screenshot, you can see that 2 samples are shown every 5 seconds. pidstat can do the same for memory and disk:
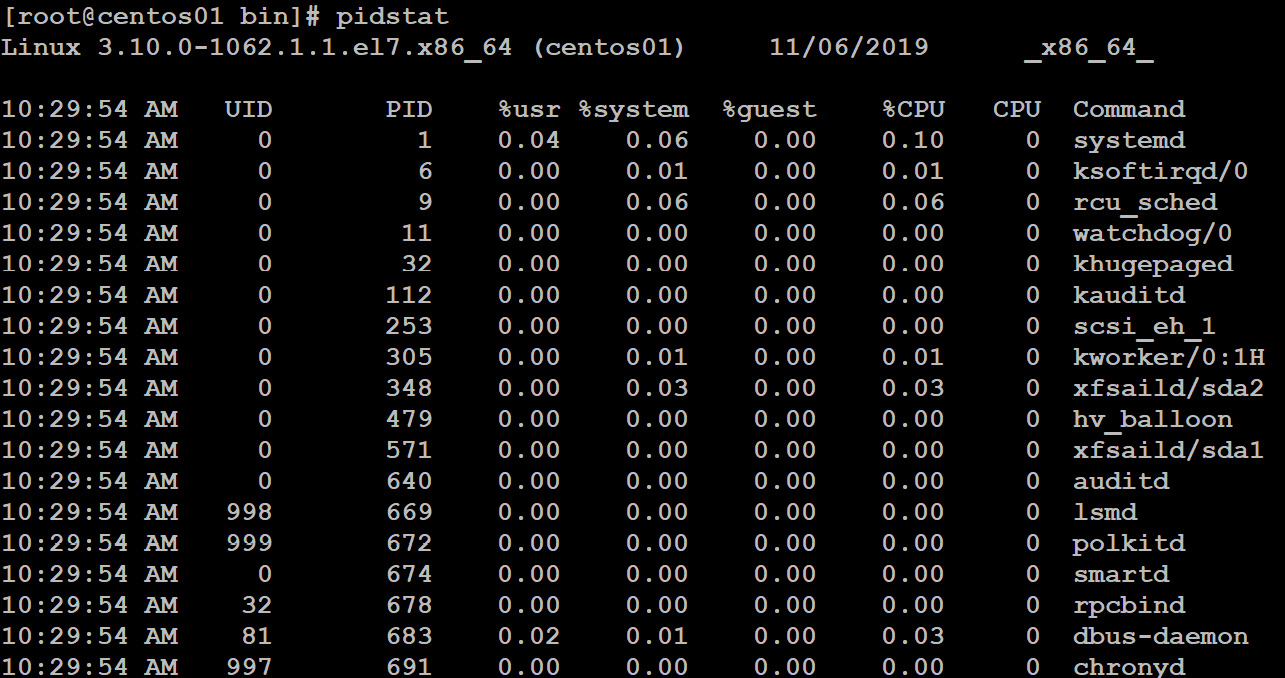
Figure 11.23: Displaying CPU statistics using pidstat
iostat is a utility, as the name suggests, that can measure I/O, but it also creates reports for CPU usage:
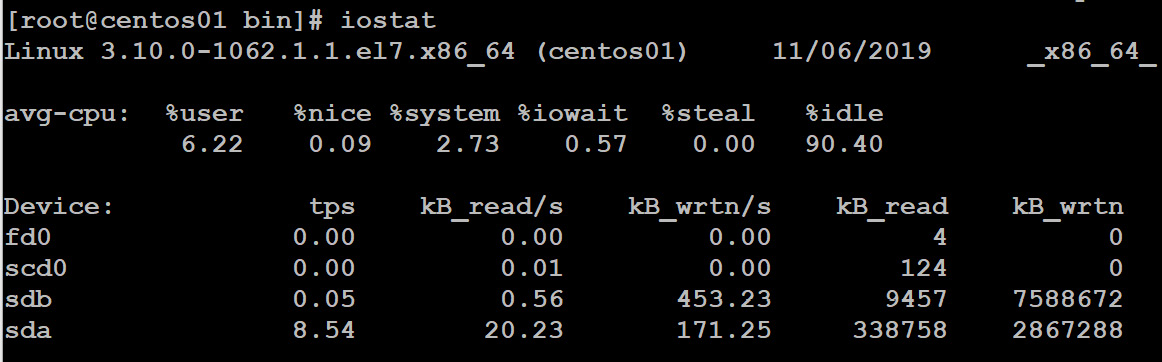
Figure 11.24: Getting the CPU and Device report and statistics using iostat
tps means the number of transfers per second issued to the device. kb_read/s and kB_wrtn/s are the numbers of kilobytes measured during 1 second; the avg-cpu column in the preceding screenshot is the total number of statistics since the time of your Linux system startup.
During the installation of the sysstat package, a cron job was installed in the /etc/cron.d/sysstat file.
Note
In modern Linux systems, both systemd-timers and the old method using cron are available. sysstat still uses cron. To check whether cron is available and running, go to systemctl | grep cron.
cron runs the sa1 command every 10 minutes. It collects system activity and stores it in a binary database. Once a day, the sa2 command is executed to generate a report. The data is stored in the /var/log/sa directory. You can query that database with sadf:
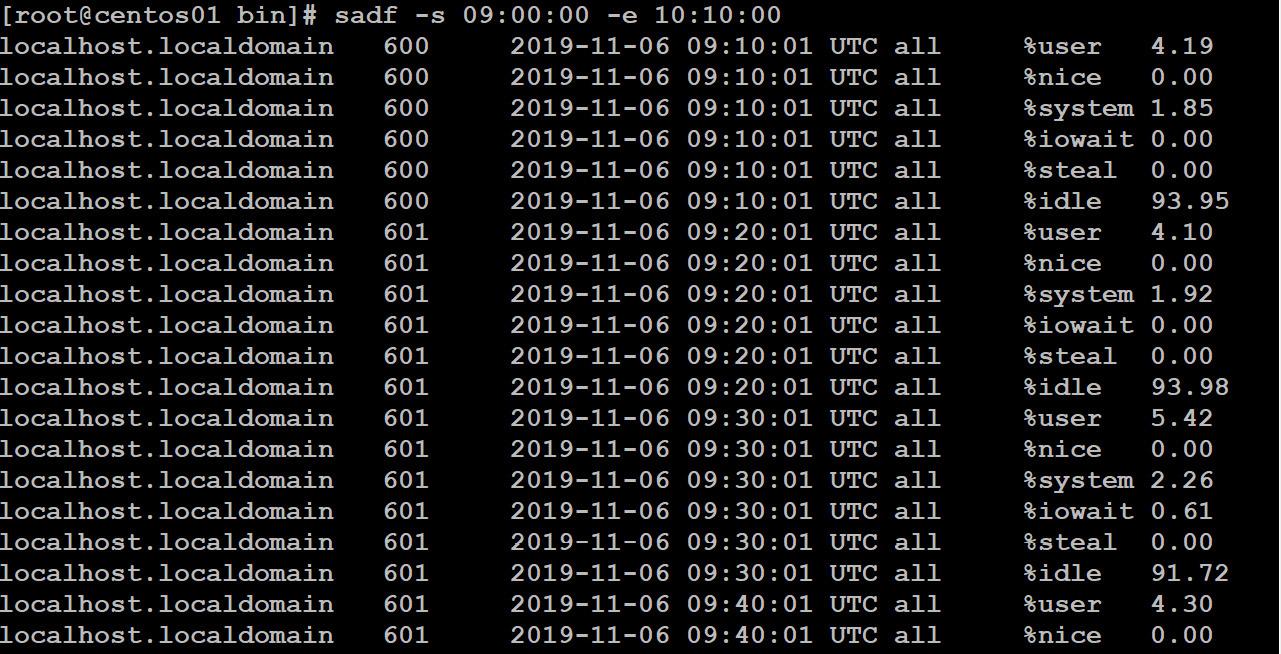
Figure 11.25: Querying the database with sadf for system activity
This screenshot shows the data from November 6, between 09:00:00 and 10:10:00. By default, it's displaying CPU statistics, but you can customize it using the same parameters as sar:
sadf /var/log/sa/sa03 -- -n DEV
This displays the network stats of every network interface on November 6.
dstat
sysstat is available for historical reports, while dstat is for real-time reports. While top is the monitoring version of ps, it's dstat that is the monitoring version of sar:

Figure 11.26: Getting real-time reports with dstat
If you don't want to see it all at once, you can use the following parameters:
- c: CPU
- d: Disk
- n: Network
- g: Paging
- s: Swap
- m: Memory
Network stats with iproute2
Earlier in this chapter, we talked about ip. This command also provides an option to get statistics for the network interface:
ip -s link show dev eth0

Figure 11.27: Getting the statistics for the network interface
It parses information from the /proc/net directory. Another utility that can parse this information is ss. A simple summary can be requested with this:
ss -s
Using the -t parameter not only shows you the ports in a listening state but also the incoming and outgoing traffic on this specific interface.
If you need more details, the iproute2 package provides another utility: nstat. Using the –d parameter, you can even run it in interval mode:
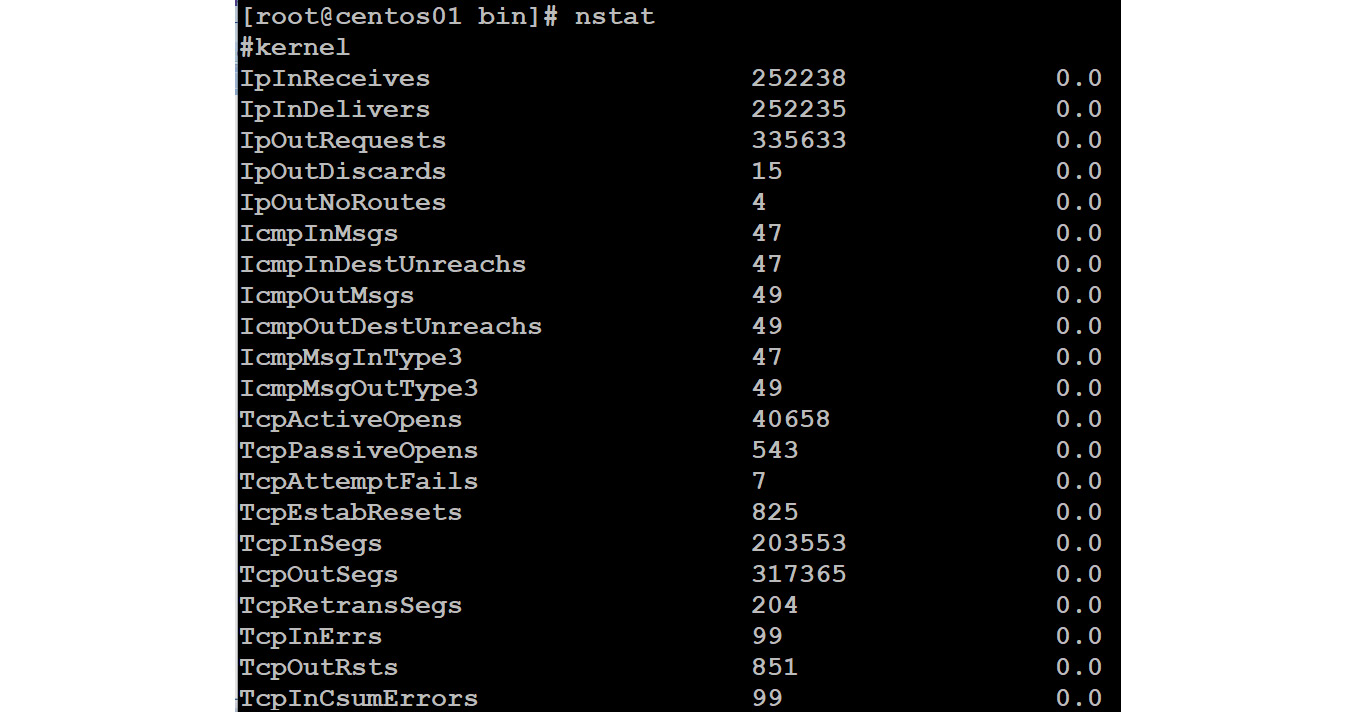
Figure 11.28: Getting a detailed report about the ports in a listening state
That's already much more than a simple summary of ss. But the iproute2 package has more to offer: lnstat.
This is the command that provides network statistics such as routing cache statistics:
lnstat––d

Figure 11.29: Getting the network statistics with lnstat -d
This shows you everything it can display or monitor. It's pretty low-level, but we've solved some firewall performance-related issues using lnstat -f/proc/net/stat/nf_conntrack, while monitoring the drops counter.
Network Monitoring with IPTraf-NG
You can get network details from tools such as nmon, but if you want more details, then IPTraf-NG is a very nice tool for a real-time console-based network monitoring solution. It is a console-based network-monitoring utility that collects all the network IP, TCP, UDP, and ICMP data and is able to break down the information according to the size of the TCP/UDP. A few basic filters are included as well.
Everything is in a menu-driven interface, so there are no parameters that you have to remember:
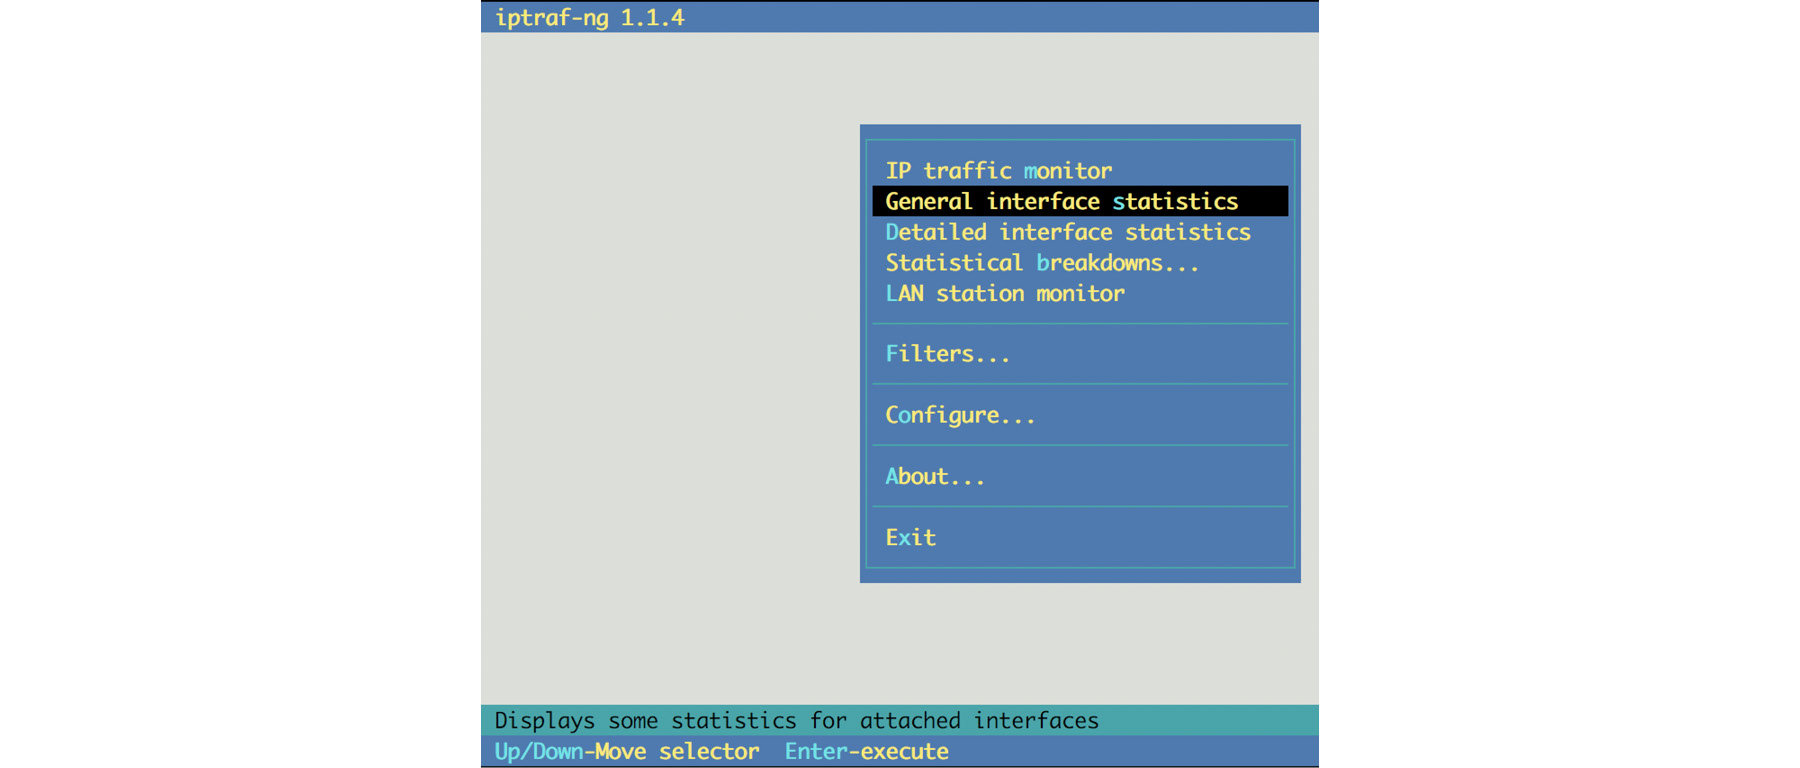
Figure 11.30: Menu window of IPTraf-NG
tcpdump
Of course, tcpdump is not a performance-monitoring solution. This utility is a great tool for monitoring, capturing, and analyzing network traffic.
To view network traffic on all the network interfaces, execute the following:
tcpdump -i any
For a specific interface, try this:
tcpdump -i eth0
In general, it's a good idea not to resolve the hostnames:
tcpdump -n -i eth0
You can add different levels of verbosity by repeating the v parameter up to a maximum verbosity level of three:
tcpdump -n -i eth0 -vvv
You can filter the traffic based on the host:
tcpdump host <ip address> -n -i eth0
Alternatively, you can filter based on the source or destination IP:
tcpdump src <source ip address> -n -i eth0
tcpdump dst <destination ip address> -n -i eth0
Filtering on a specific port is also possible:
tcpdump port 22
tcpdumpsrc port 22
tcpdump not port 22
All the parameters can be combined:
tcpdump -n dst net <subnet> and not port ssh -c 5
The –c parameter was added, so only five packets were captured. You can save the captured data to a file:
tcpdump -v -x -XX -w /tmp/capture.log
Two parameters were added to increase the compatibility with other analyzers that can read the format of tcpdump:
- -XX: Prints the data of each packet in hex and ASCII format
- -x: Adds headers to every packet
To read the data with a complete timestamp in human-readable format, use this command:
tcpdump -tttt -r /tmp/capture.log
Note
Another great network analyzer is Wireshark. It's a graphical tool that's available for many operating systems. This analyzer can import captured data from tcpdump. It comes with a great search filter and analyzing tools for many different network protocols and services.
It makes sense to make the capture in your VM and download it to your workstation in order to analyze the data further in Wireshark.
We're sure that you will now be able to achieve good performance analysis in a Linux system using different tools to monitor metrics such as CPU, memory, storage, and network details.
Summary
In this chapter, we covered several topics regarding troubleshooting, logging, monitoring, and even analyzing. Starting with getting access to a VM, we investigated logging in Linux both locally and remotely.
There is a thin line between performance monitoring and performance troubleshooting. There are many, many different utilities available to find out the cause of your performance issues. Each has a different goal, but there is also a great deal of overlap. We have covered the most popular utilities in Linux and some of the options available.
In the first chapter, we saw that Azure is a very open source–friendly environment and that Microsoft has made a great effort to make Azure an open, standard cloud solution with interoperability in mind. In this chapter, we saw that Microsoft has not only put a lot of effort into supporting Linux while deploying your application but also into supporting it in Azure Monitor.
Questions
- Why should you have at least one user with a password in a VM?
- What is the purpose of the systemd-journald daemon?
- What are syslog facilities?
- What priorities are available in syslog?
- How can you add entries to a log, and why should you do that?
- What services are available to view metrics in Azure?
- Why is top only useful to have a first look into performance-related problems, and what utility or utilities can fix that?
- What is the difference between the sysstat and dstat utilities?
- Why should you install Wireshark on your workstation?
Further Reading
A big source of information is the website of Brendan D Gregg (http://www.brendangregg.com), where he shares an unbelievably long list of Linux performance documentation, slides, videos, and more. On top of that, there are some nice utilities! He was the one who taught me, in 2015, that it is important to identify a problem correctly:
- What makes you think that there is a problem?
- Was there a time that there wasn't a problem?
- Has something changed recently?
- Try to find technical descriptions, such as latency, runtime errors, and so on.
- Is it only the application, or are other resources affected as well?
- Come up with an exact description of the environment.
You also have to consider the following:
- What is causing the load (which process, IP address, and so on)?
- Why was the load called?
- What resource(s) is/are used by the load?
- Does the load change? If so, how is it changing over time?
Last, but not least, there's Red Hat Enterprise Linux Troubleshooting Guide by Benjamin Cane. I know, some parts of the book are outdated, as it was printed in 2015. And, for sure, I definitely hope for a second edition, but, especially if you are new to Linux, buy this book.