
Chapter 8: Exploring the Admin User Interface
In Chapter 7, Schema Creation and Management, we learned about various SQL syntaxes and how to manage schema changes. In this chapter, we will learn what information is available in the admin user interface (UI) for monitoring a CockroachDB cluster.
The admin UI is useful in monitoring the health of a CockroachDB cluster as it provides the statistics, metrics, and status of all the nodes in the cluster. The admin UI mainly provides information about the metrics, database and table definitions, sessions, transactions, network latencies, active jobs, and advanced debugging information. Network latency is important when debugging query latencies, just to rule out slowness due to the network. Also, if you have multi-cloud or hybrid cloud CockroachDB clusters, it is important to understand the latencies across various cloud providers. Schema changes, backup and restore jobs, data imports, and changefeed are covered on the Jobs tab.
Network latency and advanced debugging will be covered in Chapter 10, Troubleshooting Issues.
The following topics will be covered in this chapter:
- Introducing the admin UI
- Cluster overview
- Metrics deep dive
- Database and table definitions
- Understanding sessions
- Transactions
- Tracking jobs
Technical requirements
Although we are not going to execute any examples in this chapter, we still need a cluster to access the admin UI. If you still haven't installed a CockroachDB cluster, please refer to the Technical requirements section in Chapter 2, How Does CockroachDB Work Internally?
We will first start with a general introduction on how to access the UI and how to read the metrics.
Introducing the admin UI
The CockroachDB admin UI comes by default, and you don't need any special setup to configure one. The admin UI can be accessed from any node within the cluster using the IP address or the hostname of the node and the port that's configured using the --http-addr flag, for example, --http-addr=localhost:8080. If this flag is not configured, then the admin UI is available through the IP address or hostname specified in --listen-addr and the default port 8080.
The cluster overview is the landing page in the UI, as shown in the following screenshot:

Figure 8.1 – Landing page in the UI – Cluster overview
With regard to the metrics, all the information in the UI can be viewed at either the individual node level or at the cluster level. You can see that there is a dropdown in the UI that lets you select individual nodes or the cluster itself, as shown in the following screenshot. In the case of a cluster, the stats and metrics are averaged down or aggregated across all the participating nodes in the cluster. You can look at the top-right corner to find out whether the cluster is running in insecure mode.

Figure 8.2 – Dropdown for selecting individual nodes for the node view or cluster view
Also, the UI lets you customize the time window, as shown in the following screenshot:
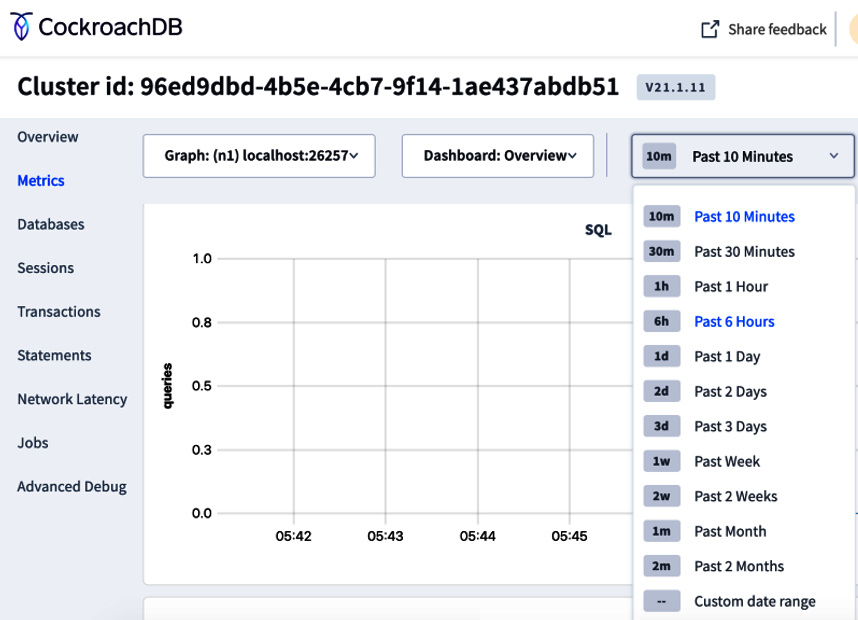
Figure 8.3 – Dropdown for selecting various time windows
Next, we will discuss the cluster overview, where we will cover monitoring the health of all nodes in a CockroachDB cluster.
Cluster overview
This is the page you see when you open the admin UI. The cluster overview provides a high-level overview of the CockroachDB cluster. Figure 8.4 is a screenshot that shows the cluster overview for a cluster with three nodes. Some of the links on the side panel don't show up if there is no data. For example, you might not see Sessions, Transactions, and Statements until a session has been established with the CockroachDB cluster and you execute some queries.

Figure 8.4 – UI for the cluster overview
You can find the following set of information in the cluster's Overview tab:
- Capacity Usage: This is the total disk space used by all the nodes in the CockroachDB cluster. It classifies the usage further into USED and USABLE. USED indicates the current disk space by all the nodes, and USABLE is the maximum capacity that can eventually be used by all the nodes in the cluster. You can set the maximum capacity for a given node by using the --store option. So, if the --store option is provided, the total usage space cannot exceed this configured value.
- Node Status: This shows the number of live, dead, and suspect nodes. A live node is alive and healthy. If a node is shut down, it is considered dead. A suspect status indicates that either the node cannot be reached to ascertain its status or that the node is getting decommissioned.
- Replication Status: This shows information about the total number of ranges in the cluster. It also shows under-replicated and unavailable ranges. A range would be under-replicated if the number of replicas of that range is less than the configured replication factor. If the majority of replicas of a given range are unavailable, then that range itself becomes unavailable as you cannot have consensus. If a range is unavailable, all the queries involving that range will fail.
The following screenshot shows the node list, where you can see some details about each of the nodes in that cluster:

Figure 8.5 – Cluster overview showing the node list
Node List provides the list of nodes with individual node-level information. Node-level information includes the following:
- Region/Node Address: If you have configured different regions, then the nodes are grouped by regions. Under each region, you will see the IP address and port of the nodes in that region. If the regions are not configured, you would just see the node IP address and the port.
- Uptime: The duration for which the node is running.
- Replicas: The number of replicas.
- Capacity Usage: How much of the disk space has been used up.
- Memory Use: How much of the memory has been used up.
- vCPUs: The number of CPUs.
- Version: The version of CockroachDB running on this node.
- Logs: The logs relevant to all the operations on that node. Logs are useful for debugging issues and for ascertaining whether the node is healthy.
- Status: This tells us the health of a node. LIVE means the node is healthy and serving traffic, while DEAD means the node is down and is no longer serving traffic.
In the next section, we will go through the various types of metrics and how they can be useful in understanding query latencies.
Metrics deep dive
Metrics are very useful for measuring the general health of individual nodes and provide better insights into the overall cluster when we are debugging performance-related issues. Metrics can also be filtered based on different time windows.
The Metrics dashboard comes with a lot of useful metrics that are shown in the following screenshot:

Figure 8.6 – Metrics dashboard showing various options in the dropdown
The Metrics dashboard includes the following categories:
- Hardware: Here, you can find the following pieces of information:
- CPU Percent: The percentage of the CPU being consumed by the CockroachDB process
- Memory usage: The memory used by the CockroachDB process
- Disk Read Mebibytes / second: The average number of bytes read from the disk by all the processes, expressed in Mebibytes per second
- Disk Write Mebibytes / second: The average number of bytes written to the disk by all the processes, expressed in Mebibytes per second
- Disk Read IOPS: The number of disk read operations by all the processes per second, averaged for 10 seconds
- Disk Write IOPS: The number of disk write operations by all the processes per second, averaged for 10 seconds
- Disk Ops In Progress: The number of read and write operations in the queue from all processes
- Available Disk Capacity: Available storage capacity
- Network Bytes Received: The number of bytes received over the network per second for all processes, averaged for 10 seconds
- Network Bytes Sent: The number of bytes sent over the network per second for all processes, averaged for 10 seconds
- Runtime:
- Live Node Count: Number of active nodes in the cluster
- Memory Usage: Detailed memory usage, which is broken down further into the following items:
- Resident Set Size (RSS): RSS indicates the size of the subset of the memory occupied by a process in the RAM (short for Random Access Memory). This doesn't include the swap memory. Swap memory is a portion of the process's runtime memory that is swapped out into the disk. In the context of CockroachDB, RSS indicates the total memory used by the CockroachDB process.
- Go Allocated: Memory allocated by GoLang.
- Go Total: Total memory managed by GoLang.
- CGo Allocated: Memory allocated by C. CGo enables Go packages to call C code.
- CGo Total: Total memory managed by C.
Note
CGo enables GoLang packages to call C code as it was originally required when CockroachDB was using RocksDB as its storage engine, which was primarily written in C and C++. CGo usage might have reduced after CockroachDB moved to Pebble. Pebble is written in GoLang.
- Goroutine Count: Number of Go routines.
- Runnable Goroutines per CPU: Number of Goroutines waiting for the CPU.
- GC Runs: Number of times GoLang's garbage collector has run per second.
- GC Pause Time: CPU time per second used by GoLang's garbage collector. During garbage collection, CockroachDB's regular database operations are paused.
- CPU Time: CPU time used by the CockroachDB process for user- and system-level operations.
- Clock Offset: In node view, it shows the mean clock offset of a given node against the rest of the nodes in the cluster. In cluster view, it shows the mean clock offset of each node against other nodes in the cluster.
- SQL:
- Open SQL Sessions: In node view, this is the number of SQL connections open from CockroachDB client(s) to a given CockroachDB node. In cluster view, this is the total number of SQL connections open from CockroachDB client(s) to all the CockroachDB nodes in the cluster. In node view, this is the number of bytes/second transferred between the clients and the node.
- Open SQL Transactions: Number of open SQL transactions.
- Active SQL Statements: Number of SQL statements that are currently getting executed.
- SQL Byte Traffic: SQL client network traffic in bytes per second.
- SQL Statements: 10-second average of the SELECT, INSERT, UPDATE, and DELETE statements.
- SQL Statement Errors: Number of SQL statements that resulted in an error.
- SQL Statement Contention: Number of SQL statements that experienced contention.
- Active Flows for Distributed SQL Elements: Number of flows on each node in the cluster that are participating in active, distributed SQL statements.
- Service Latency: SQL, 99th and 90th percentiles: Within the last minute, 99% and 90% of the queries are executed within this time, respectively.
- KV Execution Latency: 99th and 90th percentiles: This is the latency between the query request and response times, for 99% and 90% of the queries, respectively.
- Transactions: Total number of transactions per second.
- Transaction Latency: 99th and 90th percentiles: Total transaction time within the last minute, for 99% and 90% of the transactions, respectively.
- SQL Memory: Current allocated SQL memory.
- Schema Changes: Total number of Data Definition Language (DDL) statements per second.
- Statement Denials: Cluster settings: Total number of statements that were rejected due to a cluster setting.
- Storage:
- Capacity: Storage capacity is further classified into the following categories:
- Max: Maximum storage size
- Available: Free storage space available
- Used: Storage space currently used
- Live Bytes:
- Live: Number of logical bytes stored in active key-value pairs
- System: Number of physical bytes stored in system key-value pairs
- Log Commit Latency: 99th and 50th percentiles: Raft log commit latency in the 99th and 50th percentiles
- Command Commit Latency: 99th and 50th percentiles: Latency of the raft commit commands in the 99th and 50th percentiles
- Read Amplification: The average number of real read operations executed per logical read operation across all nodes
- SSTables: Number of Sorted Strings Tables (SSTable) in use
- File Descriptors: Number of open file descriptors
- Compactions/Flushes: Number of compaction and memtable flushes per second.
- Time Series Writes: Number of time series writes per second, including the attempts that errored out
- Time Series Bytes Written: Number of bytes written by time series per second
- Capacity: Storage capacity is further classified into the following categories:
- Replication:
- Ranges: This provides the following information:
- Ranges: Total number of ranges.
- Leaders: Number of leaders.
- Lease Holders: Number of lease holders.
- Leaders w/o lease: Exclusive raft leaders that are not lease holders.
- Unavailable: Unavailable ranges due to the majority of replicas being unavailable.
- Under-replicated: Under-replicated ranges that are replicated less than the replication factor.
- Over-replicated: Over-replicated ranges. This usually happens when more nodes are added.
- Replicas Per Node: Number of replicas on each node.
- Leaseholders Per Node: Number of leaseholders per node.
- Average Queries Per Node: Exponentially weighted moving average of the number of KV batch requests processed by leaseholder replicas on each node per second. Tracks roughly the last 30 minutes of requests. Used for load-based rebalancing decisions.
- Logical Bytes Per Node: Number of logical bytes stored in key-value pairs on each node.
- Replica Quiescence:
- Replicas: Number of replicas
- Quiescent: Number of replicas that have not been accessed recently
- Range Operations:
- Splits: Number of range splits.
- Merges: Number of range merges.
- Adds: Number of newly added ranges.
- Removes: Number of ranges removed.
- Lease Transfers: Number of transfers of a lease for a given range between nodes.
- Load-based Lease Transfers: Number of transfers of a lease, to ensure even load balancing across all the nodes.
- Load-based Range Rebalances: Number of range rebalances, to ensure all nodes get equal traffic. Can happen when there are hot ranges. A range is considered hot if it's getting more read/write requests compared to other ranges.
- Snapshots: Snapshots are used when some of the nodes in a Raft group are lagging considerably. In such cases, instead of sending individual messages to nodes that are lagging, a cluster can send a snapshot of the range, which can be directly applied locally. The following are some of the snapshots metrics that are available in the UI:
- Generated: Number of snapshots generated per second
- Applied (Voters): Number of snapshots applied to nodes per second that were initiated by Raft
- Applied (Initial Upreplication): Number of snapshots applied to newly joining nodes in order to bring it up to speed
- Applied (Non-voters): Number of snapshots applied to lagging nodes identified by the cluster
- Reserved: Number of slots reserved per second for incoming snapshots that will be sent to a lagging node
- Ranges: This provides the following information:
The next three dashboards contain metrics mostly internal to CockroachDB. You can look into them if you are familiar with the internal architecture and code of CockroachDB.
- Distributed: This dashboard shows the latency of various types of distributed transactions within CockroachDB and includes the following set of metrics:
- Batches
- RPCs
- RPC Errors
- KV Transactions
- KV Transaction Restarts
- KV Transaction Durations
- Node Heartbeat Latency
- Queues: This dashboard provides metrics related to different types of queues used within CockroachDB. You can see the following set of metrics related to different queues:
- Queue Processing Failures
- Queue Processing Times
- Replica GC Queue
- Replica Queue
- Split Queue
- Merge Queue
- GC Queue
- Raft Log Queue
- Raft Snapshot Queue
- Consistency Checker Queue
- Time Series Maintenance Queue
- Slow Requests: This dashboard shows metrics related to various internal activities that are being performed slower than expected. The following set of metrics are included as part of slow requests:
- Slow Raft Proposals
- Slow DistSender RPCs
- Slow Lease Acquisitions
- Slow Latch Acquisitions
- Changefeed: Change data capture (CDC) provides a mechanism for tracking all the row-level changes in CockroachDB and feeding the changes to a configurable sink. This is useful for external replication, reporting, caching, and searching. The following are some of the metrics related to changefeed:
- Max Changefeed Latency: Maximum latency for resolved timestamps of any running changefeed
- Sink Byte Traffic: Number of bytes emitted by CockroachDB into the sink
- Sink Counts:
- Messages: Number of messages sent by CockroachDB to the sink
- Flushes: Number of flushes that the sink has done for changefeeds
- Sink Timings:
- Message Emit Time: The time in milliseconds required by CockroachDB to send the messages to the sink
- Flush Time: The time CockroachDB spent waiting for the sink to flush the message
- Changefeed Restarts: The number of changefeed restarts due to retryable errors.
In the next section, we will go over the Databases dashboard.
Database and table definitions
The Databases dashboard contains the list of databases, with a list of tables in them. You can also view grants given to various users.
In the following screenshot, you can see the Databases dashboard, with options to view Tables and Grants:

Figure 8.7 – Databases dashboard showing the tables and grants options in the dropdown
If you select the Tables option, you will see a list of tables for all the databases with some stats. If the stats are not loaded, you can click on the Load stats for all tables option to populate the table-level stats, as can be seen in the following screenshot:

Figure 8.8 – Databases dashboard showing tables
From this dashboard, you can also view the DDLs for all the tables, as shown in the following screenshot:

Figure 8.9 – Databases dashboard showing the DDLs of tables
Grants will show user-level permissions with respect to a given database, as shown in the following screenshot:

Figure 8.10 – Databases dashboard showing user grants
The Databases dashboard is useful for quickly going through the tables and grants, instead of using a SQL client and executing some queries.
In the next section, we will go over sessions.
Understanding sessions
The Sessions dashboard gives information about all the active client sessions within the CockroachDB cluster. In the following screenshot, you can see the Sessions dashboard showing an active session:

Figure 8.11 – Sessions dashboard showing an active session
The Sessions dashboard displays the following information:
- Session Duration: Amount of time for which the session is open
- Transaction Duration: Amount of time of the current active transaction, if any
- Statement Duration: Amount of time of the current, active SQL statement, if any
- Memory Usage: The current allocated memory for this session/maximum memory allocated during this session
- Statement: The SQL statement that's currently active
- Actions: Options to end an active query that is part of this session:
- Terminate Statement: Ends the SQL statement
- Terminate Session: Ends the session
In the next section, we will go over the Transactions dashboard.
Transactions
The Transactions dashboard lists all the current transactions and provides additional information, including transaction time, contention, and retries, which help identify slow transactions. The following screenshot is of a Transactions dashboard showing transaction details:
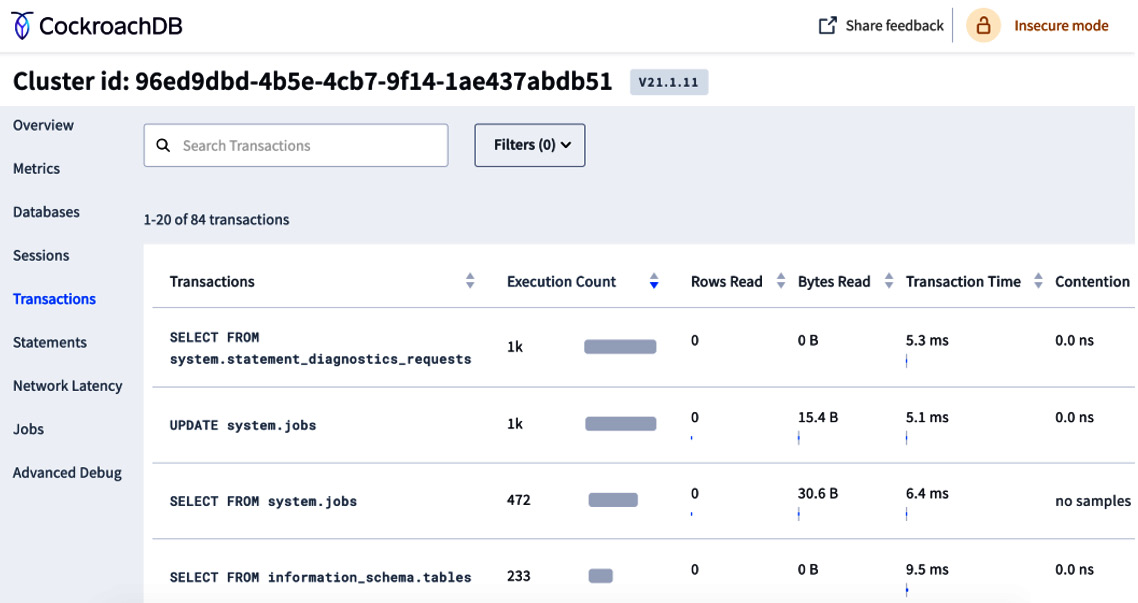
Figure 8.12 – Transactions dashboard showing transaction details
The Transaction dashboard shows the following details:
- Transactions: SQL statements that are part of the transaction
- Execution Count: Total number of executions for a given transaction
- Rows Read: Average number of rows read from disk during the transaction
- Bytes Read: Total number of bytes read across all the statements in a transaction
- Transaction Time: Average planning and execution time
- Contention: Average time a given transaction was in contention with other transactions
- Max Memory: Maximum memory used by a given transaction
- Network: Amount of data transferred over the network during this transaction
- Retries: Total number of retries during this transaction
- Statements: Number of SQL statements in the transaction
In the last section, we will learn about the Jobs dashboard.
Tracking jobs
A job can be one of these activities: backups, restores, imports, schema changes, changefeed, statistics creation, and auto-statistics creation. The following screenshot is of a Jobs dashboard:
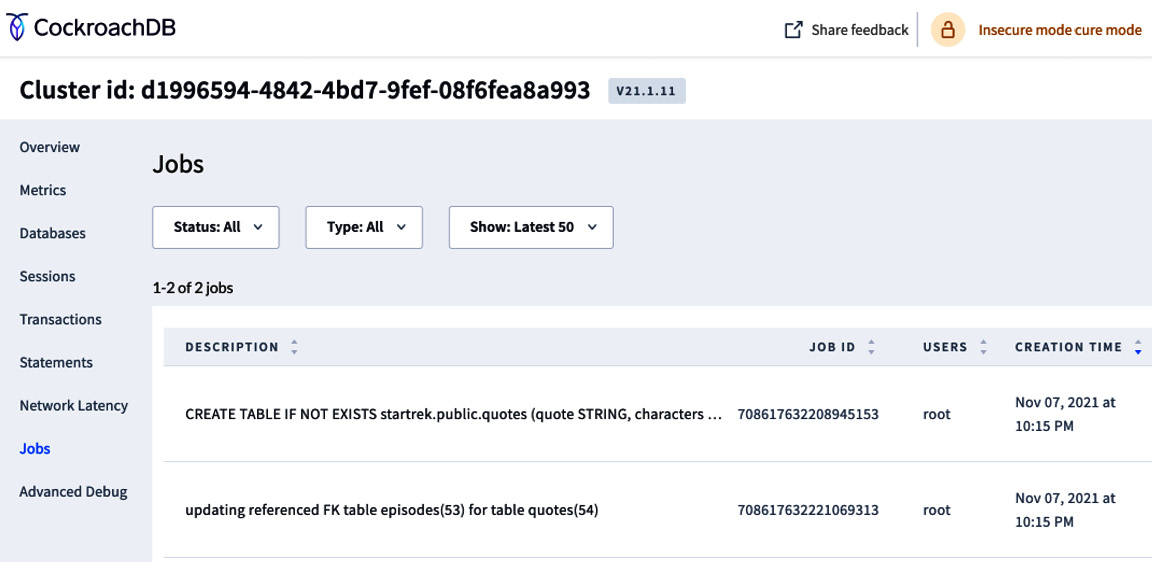
Figure 8.13 – Jobs dashboard
You can filter jobs based on the job type, as shown in the following screenshot:

Figure 8.14 – Jobs dashboard showing a dropdown for various job types
You can also filter jobs by their status, as shown in the following screenshot:

Figure 8.15 – Jobs dashboard showing a dropdown for various job statuses
The following are the various statuses of a job:
- PENDING: Job has been created, but not yet started
- PAUSED: Job is paused
- FAILED: Job has failed during execution
- SUCCEEDED: Job has completed successfully
- CANCELED: Job was canceled before it could complete
The following information is available for each job:
- Description: SQL statement
- Job ID: Unique ID assigned to a job for tracking purposes
- Users: User who created the job
- Creation Time: Date and time when the job was created
- Status: Current status of the job
We looked at several metrics that are available on the admin user interface. Although it can be overwhelming to understand and observe all of them, you should at least start with a cluster overview and the metrics dashboard and move on to others once you become an advanced user of CockroachDB.
Summary
In this chapter, we learned about the admin user interface, various dashboards, and all the information available for us to better understand the health of a cluster and also the query latencies. It is very important to get yourself familiarized with the admin UI so that you can easily navigate to the right places when debugging issues. We did not cover network latency and advanced debugging dashboards as these will be covered in detail in Chapter 10, Troubleshooting Issues.
In the next chapter, we will cover security.