
Chapter 4
Testing, Measuring, and Modifying Your Ad
In This Chapter
![]() Becoming familiar with the Ads Manager
Becoming familiar with the Ads Manager
![]() Exploring split testing
Exploring split testing
![]() Making sense of the reports
Making sense of the reports
Testing, measuring, and modifying your ad are among the most important things you can do to ensure that you’re getting the most for your dollar. Unfortunately, testing is one of the most overlooked aspects of the Facebook advertising experience because it can be overwhelming.
Because of the many variables to test and tweak, you may feel daunted at first. If you approach your Facebook ad campaign systematically, though, you can come away with an ad that has a high click-through rate (CTR) at a low cost.
In this chapter, you begin by familiarizing yourself with the Ads Manager, where all your ad campaigns are displayed. Then you discover how to begin your split testing, view the Facebook Ads reports, and optimize your campaign. Use the Ads Manager to assess performance whether you have set up your ads using the Ads Create tool described in Chapter 2 of this minibook, or using Power Editor described in Chapter 3.
Now it’s time to ratchet up your Facebook advertising expertise!
 Statistics in the Ads Manager are strictly for assessing the performance of your paid Facebook advertising. For statistics about your Page visits and visitor demographics, use Facebook Insights, which we discuss in Book IX, Chapter 2.
Understanding the Ads Manager
The Ads Manager acts as your Facebook Ads dashboard, whether you’re a small business with one campaign or a large company using Power Editor to establish and maintain multiple campaigns.
You can do the following in Ads Manager, which is especially helpful if you need to save/export or deliver reports on a scheduled basis to your supervisor or client:
- Customize reports to select the data you want.
- Specify date ranges.
- Reorganize columns for display.
You must click Upload Changes when you finish using Power Editor. This simultaneously saves your changes in Power Editor and uploads them to the Ads Manager. Double-check the Ads Manager after uploading to confirm that your campaign changes are there.
If you haven’t already created an ad on Facebook, read Book VII, Chapters 1 and 2. Ads Manager is easier to understand after you have created at least one ad. To get to the Ads Manager after you’ve created an ad, do this:
- Log in to Facebook as the administrator.
- Click the arrow on the far right at the top and choose Manage Ads from the drop-down menu, as shown in Figure 4-1.

Figure 4-1: If you’ve already created an ad, it’s available in the left column of the Ads Manager.
You see an overall picture of each campaign, the campaign status, and how much you’re spending; see Figure 4-2. From the Ads Manager, you can delve further into each campaign to obtain detailed statistics.

Figure 4-2: The Ads Manager dashboard shows an overview of all your Facebook ad campaigns.
 You can also reach this dashboard by clicking the Ads Manager link on the left sidebar of the Facebook home page or your Profile. This appears only if you have already created an ad.
Or go to www.facebook.com/ads/manage, which is the easiest and most reliable method.
The following sections break down the parts of the Ads Manager dashboard.
Notifications and Daily Spend
At the top of the screen, you see these two main areas:
- Notifications include updates, such as when a campaign has been created or whether an ad was approved or declined.
- Daily Spend is a running total of how much you’ve spent for each of the past five days for all your campaigns combined. For more details by campaign, look at the table below the columns for Cost per Click, Spent Today, and Total Spent. These amounts will adjust for the time frame you specify by clicking in the date field above the table.
Menus
Below the Notifications and Daily Spend areas are three tabs and three buttons (refer to Figure 4-2).
The tabs — Campaigns, Ad Sets, and Ads — allow you to change the view on the dashboard. The screen automatically defaults to Campaigns, but you can change the view by clicking on another option.
- All Except Deleted: From this menu, you can choose which campaigns are displayed in the Ads Manager. You can choose to view All Except Deleted (the default), Active, Scheduled, In Review, Not Approved, Inactive, Not Delivering, or Deleted. When you change any of the selections, the display on the Ads Manager changes to reflect your selection.
- Edit Campaigns/Ad Sets/Ads: This feature may be useful if you have multiple campaigns, ad sets, or ads, but wish to rename, turn on, turn off, delete, or modify the budget for just one or several of them. This button is grayed out (not clickable) until you select the check box next to one or more rows. When you select a check box, the button display changes to show how many rows you are modifying. Click this button to edit the titles or budgets of individual campaigns, ad sets, or ads.
The Edit Campaigns button varies by your choice on the first tab. If you choose Campaigns, it reads Edit Campaigns. If you choose Ad Sets, it reads Edit Ad Sets, and so forth.
- View Report: Click this button to get your overall advertising report, which shows in-depth statistics from all your campaigns in one place. We cover this report later in this chapter.
Categories
Just below the buttons is a table with several columns, as follows:
- Status: The slide button on a row turns your campaign/ad sets/ads on and off. Items are on when the status is blue and off when they are grey.
- Name of Campaign/Ad Sets or Ads: This column lists all the items in the selected category.
A campaign consists of a group of one or more ad sets. An ad set consists of one or more ads.
 Deleted ads can never be restarted. It’s safer to simply make your ads “inactive” in case you want to run them again. Holiday or seasonal ads are examples of when deactivation makes sense.
 - Delivery: This indicates whether each campaign/ad set/ad is active or inactive.
- Results: The number of actions related to your objective that viewers took after viewing your ad, such as the number of clicks, likes, or conversions.
- Cost: This shows the average paid for each action (result) related to your objective.
- Reach: This shows the total number of people who saw your ads (impressions).
- Spent Today: This displays the cost incurred since midnight of the current day.
- Total Spent: This column lists the total amount you’ve spent on each campaign during the selected time period. For more detailed information on transactions within that time period, use the Billing link in the left pane (refer to Figure 4-2).
You’ll never be charged more than the Budget setting amount, but you may pay less.
- Start Date: This shows the start date of a campaign if it’s already running, or the date when it is scheduled to begin.
- End Date: This shows the end date of the campaign. You may choose to run a campaign for a specific length of time or stop the campaign manually. You can always change a scheduled end date by visiting an individual campaign.
You don’t have to worry if you hit an end date and forgot about it. The item will stop running as planned and won’t incur any more charges. To resume running the ended item, click the pencil icon that appears when you hover over the field to edit end dates (or future start dates) at any time.
Performance results for Boost Post ads, which are created from your Timeline, not through the Ads Create tool or Power Editor, also appear in the Ads Manager. A Boost Post is simply a shortcut for creating an ad that publicizes a particular post. Boost Posts work the same way as if you created an ad using the Page Post Engagement objective in the Ads Create tool. Performance results also appear in the Posts of Page Insights (see Book IX, Chapter 2) soon after you boost a Page post. For more on Boosting Posts, please see Chapters 1 and 2 of this minibook.
We recommend renaming the title of a Promoted post campaign to something more meaningful. The Ads Manager also shows statistics for Promoted posts, which encourage engagement. The campaign name defaults to a long name with a link to the Promoted post. To edit the name, hover over the title field and click the pencil icon.
Left sidebar
The left sidebar of the Ads Manager contains several additional links that let you navigate to different areas.
Most of these links are directly related to Facebook Ads, but you can also access your Pages and Facebook Page Insights from the sidebar. Here’s the scoop on each of the sidebar items:
- Campaigns: All your campaigns on the right side of the screen.
- Pages: A list of all the Facebook Pages you administer, including Page likes and post Insights.
- Reports: Covered later in this chapter in more detail.
- Settings: Where you can change your Facebook Ads account information, add advertising account roles so that other users can access your Facebook Ads account or reports, and change the notifications you receive. We cover this area in more depth shortly.
- Billing: Where you can change your billing method and track how much you spend each month. View details on transactions, set a spending limit, or manage your payment method.
- Conversion Tracking: Lists all the Conversion Tracking Pixels created to track activities on your website completed by someone who has clicked one of your ads. Recorded conversion events are reflected in the Pixel Status column.
- Power Editor: Creates and manages multiple campaigns and accounts in bulk. For more about Power Editor and how to enable it, see Chapter 3 in this minibook.
- Account History: Review all changes to your account over time. You will see a table showing the details of each change and the date and time it was made in reverse chronological order. New changes may take up to 15 minutes to appear.
- Audiences: Defined target markets for specific ads or campaigns. When you click this link, you’ll see a screen with a Create Audience button. Facebook prompts you through the process of creating and saving an Audience with a series of pop-up windows. We talk more about custom audiences later in this chapter. You can also add or remove people from a defined audience.
Here, Facebook will also help you identify potential prospects by matching its e-mail addresses to ones you already have through a third-party service provider, such as MailChimp. Or you can upload your own files of e-mail addresses (in CSV format). Facebook will then create a custom audience for you. We talk more about audiences later in this chapter.
- Email Support: Ask Facebook tech support questions about your Facebook Ads from here. You can choose from several categories: Advertising Options, Managing Ads and Campaigns, Help with Managing Your Account, Paying for an Ad, Pending or Disapproved Ads, or Managing Pages. If you don’t have a Facebook ad currently running, you won’t see this link.
- Learn More: View success stories and find out more about how to use Facebook for business through helpful tutorials.
- Help: The Facebook Ads help (FAQ) section.
- Help Community: A message board where Facebook members can post questions and get help from other users.
- Search Your Ads box: Where you search your ads or campaigns. The search includes ad titles or campaign names but doesn’t include the text of the ad.
Adding a User to Your Facebook Ads Account
You can add users to your Facebook Ads account to give others access to the ad campaigns at two levels:
- Ad Account Advertiser: Use this level of access for people who should be able to view and edit ads, and set up new ads using your previously specified payment method.
- Ad Account Analyst: Use this level of access for people who should only be allowed to view reports on ad performance. This permission is just for advertising access. Book I, Chapter 2, tells you how to add an administrator to your Page.
To add a user, follow these steps:
- Log in to your Facebook account.
You see your Profile.
- Go to www.facebook.com/ads/manage.
Ads Manager opens.
- Click the Settings link on the left sidebar (refer to Figure 4-2).
You may have to reenter your Facebook password. Then you see the Settings area for Facebook Ads.
- Scroll down to the Ad Account Roles section, and click the + Add a User button in the upper-right corner.
A pop-up window appears, as shown in Figure 4-3. In this window, you can add a user and select the access the user has to your Facebook Ads.
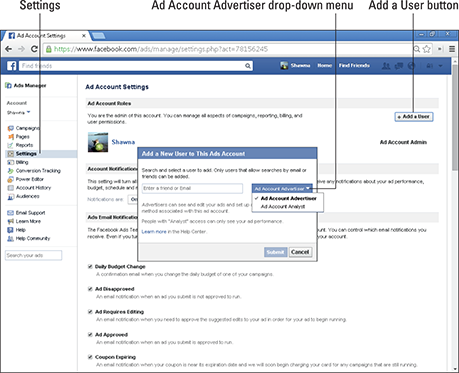
Figure 4-3: Click Add a User.
- Type the name or e-mail address of the user you want to add.
When you start typing, a list of your Facebook Friends appears; then you can choose the name of person you want to add from the list.
You must already be Friends with someone on Facebook to add him as a user on your account. If the user has set the privacy level on his e-mail address to public, you can enter the address associated with his account without being Friends. - Choose Ad Account Advertiser or Ad Account Analyst from the drop-down menu in the pop-up in Figure 4-3.
- Click Submit.
The person you’re adding appears in the list of users under Ad Account roles.
Changing Your Attack Plan
It’s helpful to test several variations of any type of Facebook ad to find out which one performs best. Ads that are performing well have a higher number of clicks and are rewarded by Facebook with lower costs. Look at the ad metrics on the Ads screen, or check the mini-summary of performance for a specific ad to the right of the preview, as shown in the sidebar “Copying an ad.”
Always assess your success against the goal you chose when you set up the ad. If your goal was conversions, don’t count as successful those ads that result in a high CTR but no conversions. Make sure that you’re watching the right stats; the data can be tricky!
If you aren’t happy with your results, try one of the following changes for a week or so and then re-assess your results.
To edit any of these parameters, use the buttons in the Ads Manager or click the relevant pencil icon in the Ads Manager. Facebook will prompt you through a series of pop-ups similar to what you see in the Ads Create tool, which we detail in Chapter 2.
- If your ads aren’t showing often, try editing your bid price. (Facebook will suggest a bidding range.) It’s your responsibility to adjust your bid amount and bid type according to the results you want and what your budget allows.
- Adjust the target audience definition so your ad will be seen by people who are most likely to take the action you want. We discuss defining the target audience later in this chapter and in Chapter 2 of this minibook.
- If your ad shows often, but viewers aren’t taking actions such as clicks or likes, try editing your ad or the landing point for the ad.
- Turn off low-performing ads to optimize your spending, if appropriate.
- Increase your budget and bids on high-performing ads so more people see those.
If you revise an ad, Facebook still reviews it before allowing it to run. Review may take up to 24 hours during the week and longer on weekends.
Trying Out Split-Testing
Why guess? Split-testing, which is sometimes called A/B testing or multivariate testing, is a systematic approach to determining how various factors affect the success of your ad campaigns. The three primary components of an ad — copy, image, and targeting — are all appropriate for testing. Split-testing is time-consuming, so save it for your important campaigns and allow enough time to assess results. You don’t change each and every variable for each campaign that you run. Change one thing at a time and keep the other variables the same. If you’re comparing two ads, try to run them with similar bids and at similar times of the day and days of the week. Plan your work systematically.
You might try these split-test scenarios:
- Select two different titles, but keep the body copy, image, and targeting the same.
- Keep the copy the same, but change the image.
- Run an ad one week with one call to action, run a similar ad the next week but with a different call to action, and then compare the two.
You should have at least 50 clicks and run the ads for at least one week for a sound comparison.
You don’t need the same number of clicks to compare two ads because many of the variables (such as the bid price and market) can be different. You can use a relative number to compare the ads, such as click-through rate (CTR) or click per thousand (CPM), because these rates are percentages, not absolute numbers.
Before you start split-testing, do a little preparation.
- Create a new ad.
- Run the ad for at least a week to gather statistics.
- Analyze the results of the ad in the Ads Manager to see the results. Pay particular attention to CTR, demographics, and actions taken, all of which we discuss in Chapter 2 of this minibook.
- Decide which variables to split-test. There are no absolute numbers or guidelines. Use your marketing experience and instinct to determine which variables make sense in your situation.
- Repeat.
The easiest way to do split-testing is to copy all the information from a previous ad to a new ad. That way, you can tweak the one thing you want to change and keep everything else the same. Follow the directions in the nearby sidebar “Copying an ad.”
Split-testing your ad title and text
Let’s look first at a split-testing approach for ad copy. The copy of two or more tested ads should include a slightly different ad title or body text. Make one or more copies of your original ad. You may find it helpful to give the various versions a number or some other differentiator — for example, holiday ad title 1, holiday ad title 2. Click the pencil icon next to the Edit Creative option shown in the sidebar “Copying an ad” earlier in this chapter and follow the directions in the sidebar to edit the copies.
- Ad title: Try two or more different titles to see which one encourages more clicks or conversions depending on your objective.
- Body text: Test different wording and calls to action, just like people used to do in the old-fashioned days of classified ads.
Run the different versions simultaneously for at least a week to collect enough data to be statistically significant. You may want to run your original ad again as well.
- Keep the ad that works better in terms of achieving your objective and make the other(s) inactive.
Do your split-testing on copies you make of your ad. Always make sure to keep the original as well.
Figure 4-4 shows two titles that were split-tested. One title is “Country Charm Weddings,” and the other is “A Rustic Theme Wedding.” The image and body text are exactly the same. Sometimes you won’t know exactly why a certain title or copy performs better — and that is why you split-test.

Figure 4-4: Split-testing for ad titles. These ads are identical except for the titles.
To get ideas for different copy, take a look at the Facebook Ad Board at www.facebook.com/ads/adboard. (You may have to enter your password to see this page.) These ads are currently running on Facebook and use demographics matching your Profile. They may or may not be successful ads, but they can give you an idea of what ads are running now.
Split-testing your ad images
Your ad image is very important for catching people’s eyes. As with testing copy, start by making at least one copy of your original ad and giving the new copies slightly different names. Click the pencil icon next to the Edit Creative option shown in the sidebar “Copying an ad” and follow the directions in the sidebar to edit the copies.
- Try using your logo and a picture of your product.
- Try using two different images (as shown in Figure 4-5).
- Run the different versions simultaneously for at least a week to collect enough data to be statistically significant. You may want to run your original ad again as well.
- Keep the ad that works the best when it comes to achieving your objective and make the other(s) inactive.
If you’re advertising something within Facebook, use a version of an image appears on your Facebook Page. Then, when someone goes to your event, Page, tab, or group, the image is consistent.

Figure 4-5: Split-testing ad images.
Keep these guidelines in mind when creating images:
- Keep it simple. Make sure the picture is clear and not too intricate.
- Mind your pixels. Facebook recommends uploading images with dimensions of 1200 x 627 pixels (px), with a minimum width of 600 px for News Feed appearances. Facebook automatically resizes images of other dimensions.
- Forego Flash. Facebook does not support animated or Flash images.
For more information on ad images, read Chapter 2 in this minibook.
If you change more than one variable, you won’t know which change produced the difference.
Split-testing your targeting
After you run an ad, you can take a look at the clicks and break them down by demographics. That data is listed in the Responder Demographics report, which we discuss later in this chapter.
As with testing copy, start by making at least one copy of your original ad and giving the new copies slightly different names to indicate that you are using different audiences. This time, however, click the pencil icon next to the Edit Targeting option shown in the sidebar “Copying an ad,” not the content of the ads.
You may want to try split-testing your targeting this way:
- Try the same ad, using different Interests in the split test.
- Try the same ad with different selections within Behaviors.
For example, assume you have Women’s Clothing under Interests and Luxury brand apparel under Behaviors (Purchase behavior⇒Clothing⇒Women’s). If you want a broader audience, split-test by removing the Luxury brand apparel selection under Behaviors. Run your original ad and the copy for a week to see whether the performance improves.
If you want a narrower audience, you could change the Interests area on the identical ad from Women’s Clothing to Women’s Dresses. Again, run the two versions of the ads simultaneously.
For more on targeting your audience, see Chapter 2 of this minibook. If you’re getting a higher response from a certain age range, consider testing with the under-performing age ranges removed from your target audience. See if focusing on the responsive age ranges results in a better CTR.
Adjust your ad rotation to keep your ads fresh. If you’re targeting a narrow range of people, those people will potentially see a specific ad multiple times, and the ad loses effectiveness. However, if you need name recognition and branding, we recommend keeping the image the same.
To change the targeting for an existing ad, take the following steps. The same steps apply if you want to change the targeting for an existing campaign or ad set as a whole.
- Go to the Ad Manager (www.facebook.com/ads/manage).
You will be on the Campaigns page automatically.
- Click the Ads (or Campaigns or Ad Sets) tab located above the table.
- Click the ad name for the ad that you want to edit.
The page will expand and a preview of your ad will appear.
- Click the pencil icon next to the Edit Targeting tab to the right of Ad Preview.
See the sidebar “Copying an ad” earlier in this chapter.
- You’ll see all the targeting options that appear in the Audience section of the Ads Create tool.
Refer to Chapter 2 of this minibook for a list of the targeting options.
- When you’re satisfied, click Save in the bottom-right corner of the pop-up to update the targeting.
Testing your landing page
If you’re advertising a website outside Facebook, make sure that your website is optimized for what you’re advertising. If you’d like someone to sign up for your newsletter, send that viewer to a web page that shows the benefits of the newsletter, a box for her to enter her name and e-mail, and not much else. If you’re advertising a sale, send those viewers to the web page where you talk about the sale. Don’t make the user hunt through your website to find the relevant content.
That said, you can also split-test your landing pages. Design two similar pages to see which one gets better results when you send traffic to it. In this case, you want to keep the actual ad copy the same within Facebook so that you can really measure the difference.
Split-testing landing pages doesn’t have to be too hard. If you created a page about your product along the lines of www.yourwebsite.com/productname, create another page on your site such as www.yourwebsite.com/productname2. The two pages should be identical except for the different copy, layout, or images you want to test. Send traffic to each of these pages with your Facebook ad. Have an analytics program installed on your website to measure the traffic, and watch when people are purchasing your product from one landing page or the other landing page. Google Analytics (www.google.com/analytics) is a perfect tool to help measure the traffic on your website. For more information on analytics in general, see Book IX, Chapter 1. For more on Google Analytics, see Book IX, Chapter 3.
Viewing Facebook Reports
Facebook Reports is the area in the Ads Manager where you find critical performance data on all your ads, such as impressions, clicks, actions, actual CPC, and more.
You can access the reports in several ways:
- Log in as an admin and click the drop-down arrow in the top-right corner of the Facebook toolbar. Choose Manage Ads from the menu.
- Alternatively, log in and navigate to facebook.com/ads/manage.
- Either way, click the Reports link in the left pane, as shown in Figure 4-6.
You’re taken to the Ad Reports area, where you start by selecting the type of report you want. You can then customize your report with the Edit Columns and Add Filters buttons; specify its date range; and save, share, export, or schedule your report to run automatically.
Facebook completely reorganized its report presentation in Spring 2014. You can review current or previous data in the former report format by clicking the Old Reports link in the left navigation, shown in Figure 4-6. You can retrieve previously scheduled reports using the Old Scheduled Reports link directly below it.

Figure 4-6: Use the Reports link in the left pane to view the performance records for your ads.
Setting up your report
First, you must decide what type of report you want. When you click the drop-down arrow next to the word Reports in the top row of the Facebook Ads Reporting screen, you will see four choices. Select one from this list:
- Manage Scheduled and Recent Reports: Schedule reports or view recently created ones.
- General Metrics: The most flexible and extensive data report, this one is the most commonly used.
- Website Conversion: View results only for ads with a website conversion objective, such as a sale, registration, or download.
- Placement Based Metrics: View ad performance results sorted by where ads appeared: right column, News Feed, or mobile environment.
Setting dates
To the far right of the second row of the Reporting screen, you see two Date drop-down menus: Last 7 Days and All Days. In the first drop-down menu, select the date range to be included in the report, ranging from Today to the Last 3 Months, or Custom. If you choose the Custom option, additional fields appear to set the start and end dates of your reporting period.
In the All Days drop-down menu, you choose how may days should be summarized in each row of the report: 1, 2, 7, or all days. For a detailed breakdown by the day, you would select 1 Day (for example, a one-day ad blitz for a flash sale); for a summary of an entire, lengthy campaign, select All Days.
Scheduling reports
There are several other buttons on the top row that you may want to select after your report has been created. The row of buttons at the top lets you schedule a report to run at a regular interval and have it sent to you and others. To schedule a report:
- Click the Schedule button shown in Figure 4-6.
- On the pop-up window that appears (see Figure 4-7), name your report.
- For Frequency, choose Daily, Weekly, or Monthly.
- Choose a start date.
- In the Subscriber Emails field, type or paste e-mail addresses for people who should receive the report, separated by a comma.
- Select either Active or Paused from the Status drop-down menu.
Active means that Facebook will run and distribute your report on the selected schedule; Paused stops the process.
- Click the blue Schedule button located in the bottom-right corner of the pop-up.
Only people with permissions will be able to access a report that you e-mail them. To set permissions, click on Settings in the left pane of the Ads Manager. Reenter your password when asked. Scroll down to Ad Account Roles and then click + Add a User.
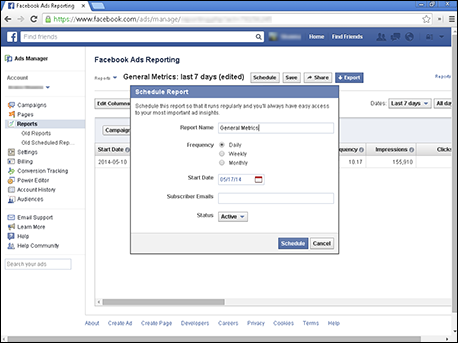
Figure 4-7: Schedule a report to run as often as you’d like.
Saving a report file
Click the Save button (refer to Figure 4-6). In the pop-up that appears, name your file and click Save in the pop-up to keep the file in your Ads Manager record for future reference.
Sharing a report
When you click the Share button (refer to Figure 4-6), the pop-up that appears will contain a long link that you can copy and paste into an e-mail. You will also have the option to shorten the link, which makes it easier to use.
Exporting CSV or XLS files
Exporting a report file enables you to analyze the data in your report more fully, graph the numbers, or compare two campaigns side by side. To do this, you must export (send) your report as an XLS (Excel) or a CSV (Comma Separated Values) file, depending on the file format your spreadsheet program requires. Follow these steps:
- Set up your report exactly as you want it. Save it for security purposes.
- Click the blue Export button (refer to Figure 4-6).
- On the drop-down menu that appears, choose Export Report (.xls) or Export Report (.csv).
Your report will automatically download to your computer.
Decoding column headings for General Metrics
If you haven’t run ads before on Google or other web platforms, some of the columns in the Ads Manager may as well be hieroglyphics. The specific columns that appear will vary based the report and customization you have selected.
The following definitions cover the default columns for the commonly used General Metrics data aggregation report, which appears in Figure 4-6. (For more terminology, review Chapter 2 of this minibook.) The fields are listed in the order they appear, from left to right. Not all these fields are visible in the figure.
- Reach: The number of different individuals who saw your ads. Reach is different from Impressions, which counts the number of times your ad has displayed. If the same person sees your ad five times, Reach counts that person only once; Impressions counts five times.
- Frequency: The average number of times each person saw your ad. This is the Impressions divided by the Reach.
- Impressions: The total number of times your ads have appeared on Facebook, whether in the right column, News Feed, or in a mobile format.
- Clicks: The actual number of clicks on the ad. If you’re promoting a Page, an event, or an app, this metric includes new page Likes, event joins, app installs, and similar actions.
- Unique Clicks: The number of clicks received from different people. This data is helpful for knowing whether the same person happened to see your ad twice and clicked it both times — the second click is not a unique click.
- CTR (click-through rate): How many times your ad was clicked, divided by the number of times your ad was shown on Facebook (Impressions). This ratio of Clicks to Impressions is expressed as a percentage.
- Unique CTR: Unique Clicks divided by Reach (unique viewers). It’s best to have your Unique CTR come close to your CTR, but there’s nothing you can do to control who clicks your ad.
- Spend: The amount you spend during the date range you chose for the report.
- CPM (cost per thousand impressions): The cost for each 1,000 impressions. This is a standard metric for all types of advertising, from billboards and TV to online banners and Google search ads. It is calculated by dividing the total amount spent by the number of impressions received in thousands. Even if you didn’t bid with the CPM model when you placed your ad, Facebook Reports calculates it for your reference. CPM not only enables you to compare how ad campaigns with different bidding models perform on Facebook, but also how Facebook advertising compares to ads placed in any other online or offline format.
- Cost per 1000 People Reached: The average cost for your ad to reach 1,000 unique Facebook users.
- CPC (cost per click): Simple arithmetic! The total amount spent divided by the number of clicks an ad received yields an average CPC. This number is calculated even if you didn’t bid on the CPC model, making it possible for you to compare Facebook performance under different bidding scenarios, or to compare Facebook costs versus other online advertising.
- Actions: The number of actions (such as liking a page, downloading an app, or making a comment) taken by people on your ad, Page, app, or event after someone saw your ad. Actions, which are now included in the social content, are counted even if viewers didn’t actually click your ad. They are calculated within 24 hours of viewing an ad or 28 days after clicking it, unless you specify other parameters under the Actions metric in the Edit Columns pop-up, as described later.
- People Taking Action: The number of unique users who took an action such as liking your page or making a comment. If the same person takes more than one action, she or he counts as one unique user for this metric.
- Page Likes: The number of people who like your Page within 24 hours of viewing your ad, or within 28 days of clicking on an ad. (As with Actions, you specify other time parameters under the Actions metric in the Edit Columns pop-up, as described later.) This number can be beneficial because you can see when you have generated awareness that leads to a Like with up to a month of advertising exposure. People will often view an ad multiple times before they take an action.
Customizing your report with Columns and Filters
Facebook collects an unbelievable amount of data! To help you organize the data into meaningful information, Facebook offers dozens of ways to customize which information gets reported and on what level — account, campaign, ad set, or individual ad.
The primary tools for customization are the Edit Columns and Add/Clear Filters buttons, which appear at the top of the Reports section. (Refer to Figure 4-6.) Use these options to prioritize the information that you present in your report, or to set up different report profiles for different purposes.
You may need to configure more than one report for different needs. Product managers or marketing directors may want demographic information at the ad set level; the VP of marketing may want more budget detail; the advertising folks may want performance data at the level of individual ads.
When you click the Edit Columns button, the complicated pop-up shown in Figure 4-8 appears. It contains three interlocking segments: Column Sets, Dimensions, and Metrics.

Figure 4-8: Customize your report in the Edit Columns pop-up window.
As you click different options in the Column Sets list on the left, the numbers to the right of some of the Dimensions and Metrics may change simultaneously, as may the default check boxes in the column on the right. The selected check boxes are the actual column names that appear in the report. If you override the default settings, your customized columns will appear in the report.
For a change, Facebook provides meaningful help where you need it. As you hover over any item in the Dimensions or Metrics section, a definition of the item appears at the bottom of the pop-up window. If you try to select an inappropriate parameter or omit a required field, Facebook displays a prompt at the top of the pop-up.
Selecting a Column Set
The far-left column in the pop-up window displays seven basic pre-configured sets of column displays. As you click on each one, the numbers next to items listed in the center section of the window may change accordingly. You will have an opportunity to further customize your report by modifying those sections, as we explain later. The seven basic sets are:
- General: This broad-based column set includes reach, frequency, impressions, amount spent, CPM, CPC, clicks, CTR, and actions. This is probably the most often-used report. We define these and other common reporting terms in the earlier “Decoding column headings for General Metrics” section; most of these terms are also defined in Chapter 2 of this minibook.
- Page: This set offers columns related to Page likes, Page engagement, offer claims, and cost per Page likes. For contest and claim information, see Book VI, Chapter 2. This Column Set is often used when conducting an internal Facebook campaign to increase Likes or engagement.
- App: A suite of columns related to app installations, app engagement, mobile app installs, and cost per mobile app installs. See Book III, Chapter 2, for more about apps in general. See Book V for more specific app information.
- Conversion: The set displays columns related to conversions, checkouts, registrations, cost per website conversions, cost per checkout, and cost per registration. This column set makes the most sense with the website conversion objective.
- Demographic: Configures report columns to show ad performance broken down by age and gender.
- Geographic: Configures report columns to show ad performance broken down by country.
- Placement: Configures report columns to show ad performance broken down by where an ad appeared: right column, News Feed, or mobile.
Start with the Facebook default settings for Edit Columns. Then play around with the configuration until you get the results that make the most sense for your marketing goals, advertising objectives, budget, and the amount of time it’s worth spending on analysis.
A business with $1 million annual budget for Facebook advertising — and the staff to go with it — can afford to spend hours and hours analyzing data. For a small business spending only several hundred dollars a month, a huge level of effort simply isn’t worth it. Facebook’s default settings should suffice.
Remember to click the Save Columns button in the bottom right of the pop-up for each different report configuration you want to test or keep. Give your different configurations descriptive names so you can compare them later.
Defining Dimensions
Once you choose a column set, you can view (and change) additional details about the report configuration. Start with the top-center section of the pop-up. No matter which column set you choose, beneath the label Dimensions you see two rows: Data Aggregation and Data Breakdown. Click the right-pointing arrow to the right of each row to see available choices. As you select the various boxes, the numbers next to the arrows may change.
At least one choice under Data Aggregation is required. Here you choose whether to display your reports at the account, campaign, ad set, and/or ad level. You may select more than one box, but you must select at least one. The default is Campaign level for the General column set, but may vary with other selections.
Review the Data Breakdown row if you also want your report to provide an alternative view of performance by one of six audience demographics: age, gender, age and gender, country, placement, or destination. You can select none or one of these radio buttons. The default is None for the General column set, but may vary with other selections.
Measuring Metrics
Below Dimensions in the center section, you will see five subsets of Metrics that are listed regardless of your choice of column set. However, the number of default items that appears to the right of the metric varies according to your selection.
- Delivery & Spend
- Clicks
- Actions
- Revenue
- Cost per Action
As with Dimensions, each of these subsets has a right-pointing arrow. Click the arrow to see the potential list of parameters associated with that metric. See Figure 4-9.
These are check boxes, so you can select all, none, or as many parameters as you want. Once you have saved your choices using the button at the bottom of the pop-up, these parameters become the column labels that appear in your customized report (refer to Figure 4-6).
To return to the default settings, just click again on the item you chose under Column Sets.

Figure 4-9: The list of potential columns in a report varies according to the metrics you choose. This shows the column available for the Clicks metric under the General Column Sets list.
You can include as many columns as you want in a report, but the report will display only the data included in the date range and filters (discussed later) that you specify.
Adding filters
If you have been using Facebook advertising for a while, or if you run multiple campaigns, you may find that you want to pull out only specific campaigns, ad sets, or ads for a report. This is easily accomplished by clicking the Add Filters button (refer to Figure 4-6).
As shown in Figure 4-10, another row of options appears above the performance report. Follow these steps to filter your report to display only the results you want.
- Click the drop-down arrow next to Campaign Name.
- Select Campaign Name, Ad Set Name, or Ad Name.
- From the drop-down list to the right of Contains, choose either Contains or Is.
- If you selected Is, enter the actual name of the campaign, ad set, or ad in the text field to the right. If you selected Contains, enter at least one keyword that appears in the name.

Figure 4-10: The Add Filters dialog box lets you decide what level of reporting you want: campaign, ad sets, or ads.
- Click + Add Filter. Any items that match the search criterion you chose in Step 4 will appear in the table below. Click the item that you want to see.
- To add more campaigns to your filter, simply repeat the process. Start by typing another campaign name into the text field.
- If you want to filter the results of a specific campaign by ad or ad set, repeat the process with the additional fields that will appear to the right. If you are done, just ignore them.
- Once you have added a filter, the Add Filters button changes to Clear Filters. To remove all filters, click that button. To remove just one of several filters, click the small X box next to the text field.
Viewing Old Reports
Use the Old Reports link in the left pane (refer to Figure 4-6) to view campaign results in the former reporting format. The prior format can be used to present current data, as well as data collected from the past.
Running reports in the old format is easier, but you have fewer ways to customize your report.
You are not required to use the new format for current or future data, or to reconfigure your reports from the past with the new interface. Facebook has not indicated that it intends to “retire” the old report format in the future.
Even if you switch to the new Reporting format, save your prior reports for comparison. They offer a wealth of historical performance data that may be useful for the future.
When you click on the Old Reports link, the pop-up window shown in Figure 4-11 will present fields to configure the report. Follow these steps:
- Choose one of five types of reports from the Report Type drop-down menu:
- Advertising Performance provides similar information to the new reporting format.
- Responder Demographics provides critical demographic data about the users who actually view and click on your ads; use this information to optimize your targeting.
- Actions by Impression Time is the number of actions sorted by impression time, which is defined as the time between a user's viewing of an ad and clicking the action: for example, a day, a week, or a month.
- Inline Interactions reports deal only with engagement on Page post ads, with action metrics such as Likes, photos viewed, and videos played that occurred as a result of your ads.
- News Feed reports show metrics for ads that appeared in New Feeds, distinct from the metrics for ads that appear in the right column; they include impressions, clicks, CTR, and average position.
- Under the Summarize By drop-down menu, choose Account, Ad Set, or Ad.
- If you chose Ad Set or Ad, an additional Filter By drop-down menu allows you to select No Filter, or to filter by ad or ad set as appropriate.
- From the Time Summary drop-down menu, select Monthly, Weekly, Daily, Custom, or Lifetime. News Feed reports only offer the first three choices.
- For all choices except Lifetime, set the Date Range for starting and ending dates.
- In the Format drop-down menu, select Webpage (.html), Excel (.xls) or Multilanguage Excel (.csv).
- Check whether to include deleted Ads/Ad Sets.
- Click the Generate Report button.

Figure 4-11: The configuration pop-up for a daily advertising performance report summarized by ad sets in the old report format.
The two most helpful reports in the old format are Advertising Performance (see Figure 4-12) and Responder Demographics.

Figure 4-12: A daily Advertising Performance report summarized by account in the old format; only some of the actual columns are displayed.
You can export a file from the old report format by clicking the Export Report (.csv) button above the table (refer to Figure 4-12).