
Chapter 2
Exploring Facebook Insights
In This Chapter
![]() Using Insights, the Facebook built-in monitoring tool
Using Insights, the Facebook built-in monitoring tool
![]() Interpreting Insights tracking details
Interpreting Insights tracking details
![]() Deciding which data to track
Deciding which data to track
Insights, the built-in Facebook analytics dashboard, helps you look at trends revealed by the activity on your Page. Insights helps you get a feel for who is using your Page and how those users are interacting with it. In this chapter, we dive into the data and explore ways to better understand your Facebook users’ behaviors in relation to the content you share.
We look at how to interpret the myriad graphs and charts available in Facebook Insights. Now who doesn’t like to do more of the good stuff and less of the bad stuff, right? Don’t worry: We’ve set up this chapter so that exploring the analytical data of your Facebook Page won’t be painful, we promise!
 The keys are to find out which marketing strategies work and replicate those efforts (and to understand what isn’t working so that you can create more productive, meaningful interactions). This chapter focuses on understanding analytical data that Facebook provides; the next chapter focuses on analytical data from third-party sources.
Getting Started with Insights
Think of Insights as your personal road map to Facebook success. That may sound a bit cheesy, but Insights truly can help you navigate your way to a thriving Facebook Page.
 At least 30 people must like your Page before the Insights dashboard becomes available for viewing. Ask your friends, family, employees, colleagues, and valued customers to like your Page so you can reach this level quickly.
To understand the true value of your Facebook efforts, you need to know
- How many users have been exposed to your posts
- How much of your audience is actively responding or interacting with your posts
- Which posts are the most popular with your ideal audience
Fortunately, no matter what goals you have for your campaign, you can use the metrics to guide your next steps.
Accessing Insights data
To access Insights, do this:
- Log in to Facebook.
- Go to the Admin panel for your Facebook Page.
- Click the See Insights tab to open the entire Insights panel.
The See Insights tab is near the top-right corner of the Admin panel, as shown in Figure 2-1.

Figure 2-1: The Admin panel dashboard with the See Insights tab at top.
Understanding the Overview display
When you’re in Insights, click the Overview tab. At the top, you see tabs for five metrics: Likes, Reach, Visits, Posts, and People, as shown in Figure 2-2. Summaries below the tabs have green (positive) or red (negative) arrows and percentages that summarize the difference in values from the previous week.

Figure 2-2: Arrows, graphs, and percentages on the Insights Overview compare key metrics to the prior week.
The Overview page displays metrics for only the past week. The time frame for the data on the Overview display appears directly above the metrics boxes. To select other date ranges, you will need to drill down further into Insights.
To drill down for additional detail, click on the header for Page Likes, Post Reach, or Engagement in the center of the page. On the new page that appears, enter your desired date range for a custom report. You can also click on any metric in the top navigation to enter a date range. Here’s a brief explanation of each key section on the Overview display:
- Page Likes: Shows Total Page Likes and new Page Likes.
- Post Reach: Shows Total Reach (the number of people who saw any activity from your page) and Post Reach (the number of people who saw your posts).
- Engagement: Shows how many Likes, comments, shares, and clicks your Page posts received.
- Your 5 Most Recent Posts: This table, located below the three graphs, displays your five most recent posts, the date they were published, a shortened version of the posts themselves, and the types of posts (photo, link, video, and so on). Additional columns are Type (for example, status, image, link), Targeting (public to everyone, or limited to a particular segment), Reach, Engagement, and Promote (a shortcut if you want to pay to promote a post). Click each post to see its full details, including Likes, comments, and shares, as shown in Figure 2-3.
There’s an alternative way to see Reach data. If you’re the Admin of a business Page, you can also view Reach below each individual post on your Timeline itself. When you hover over the number of people reached, you see the number of unique viewers, split among Organic and Paid, as shown in Figure 2-4. Paid distribution appears in this display only if you used Facebook Ads to promote your post. The Reach number in this display is calculated after the post was published. Remember, this applies only to business Pages!
Four metrics are visible to anyone who visits your Page without any access to Insights: Total Likes, People Talking About This, Check-ins, and Friends Who Like this Page. These metrics are meant to show Facebook users how popular, active, and engaging your Page is. That’s why it’s extremely important to track these numbers and to continue to focus on increasing your fan base and overall engagement. You don’t want to turn off prospects with poor results.

Figure 2-3: A pop-up window showing the detailed metrics for a specific post.

Figure 2-4: If you are an Admin, you can see Reach data for an individual post directly on your Timeline.
Using these metrics, you can identify which types of posts are most popular with your audience and tweak your content strategy to post more of what’s working best.
Delving into Insights Details: Categories
This section reveals what information you can access within the five subcategories of Likes, Reach, Visits, Posts, and People. By diving into each category, you better understand your fans’ demographics and behaviors, who is talking about you, and what those people like most about your Page.
You can select the date range of your choice for Likes, Reach, and Visits at the top of each respective subcategory page. Click the calendar icon next to the date range and then select the range you want to analyze.
Tracking your Like activity
The Likes tab provides a good understanding of
- Your total current Likes
- A breakdown of Likes versus Unlikes
- How visitors found your Page
The first set of metrics is total Likes to date with a graph tracking when you received each Like, as shown in the top graph on Figure 2-5.
The second set of metrics, shown at the bottom of Figure 2-5, displays the number of new Paid and Organic Likes compared to the new Unlikes for the past 28 days.
Keep your eye on new Unlikes. If people seem to be unliking your Page at an alarmingly high rate, you need to see whether a specific activity triggered them. Make sure your newer posts match what people Liked in the first place.

Figure 2-5: The top graph shows Likes for the past 28 days. The lower graph displays the net change between Likes and Unlikes.
The third set of metrics on the Likes tab, Where Your Page Likes Came From (Referrals), tells from where on Facebook or elsewhere on the web that new Likes originally found your Page, as shown in Figure 2-6: The actual list of sources will vary by Page. For instance, you used Paid ads to drive traffic to your Page, Ads may show up as one of these sources.
Did people who liked your Page find it in their News Feed or perhaps in a social plug-in on your website? Did they click the Like button on the ad or on your blog? Did they find you on Facebook’s mobile site?
It’s valuable to know where your Likes come from because you can identify the best ways to drive desirable traffic to your Facebook page — “desirable” meaning traffic that is apt to turn into Likes.

Figure 2-6: Referral metrics for Likes will help you evaluate future marketing efforts.
Reach-ing for the Facebook stars
The Reach tab gives you a good understanding of who is actually seeing your content and how you reached them.
- Post Reach shows both Organic and Paid post reach. Organic Reach includes the total number of unique viewers who saw content from your Page in their News Feeds, on their Tickers, or on your Page.
The more engagement you create on your Page, the more likely you are to get out into the News Feeds and Tickers.
- Likes, Comments, Shares shows how many people have liked, commented on, or shared your posts. They are shown together, but you can click Likes, Comments, or Shares on the right side of the graph to see these metrics individually, as shown in the bottom of Figure 2-7.
 Hide, Report as Spam, and Unlikes is a breakdown of negative actions on your page. Because these actions decrease the number of people you can reach, they are important to monitor. Pay particular attention to Report as Spam numbers that spike suddenly. Assuming you’ve been acting honorably, a spike might indicate that your account has been hacked. Although these metrics are combined on the graph, as shown in the top of Figure 2-8, but you can separate them by clicking each metric to the right of the graph.
- Total Reach shows the number of unique people who saw any content associated with your Page (including any ads pointing to your Page) in any way.

Figure 2-7: The Post Reach graph distinguishes between paid and unpaid (organic) viewers of your posts.

Figure 2-8: The numbers for Hide, Report as Spam, and Unlikes are displayed at the top of the Reach page, with Total Reach, segmented by organic and paid sources, displayed below.
Visiting the Visits tab
The Page and Tab Visits graph, on the Visits tab (shown at the top of Figure 2-9), indicates which areas of your Facebook Page (such as Timeline, Photos, or Profile) are viewed the most. These appear together, but you can distinguish them by clicking each area to the right of the graph: The areas shown may vary by Page and over time.
The second graph on this tab is Other Page Activity. This may include Mentions, Posts by other people, check-ins, offer claims, or other activities. The items that appear may vary by Page and over time.
Again, these metrics are summed but can be viewed separately by clicking each metric on the right of the graph. See the bottom of Figure 2-9.
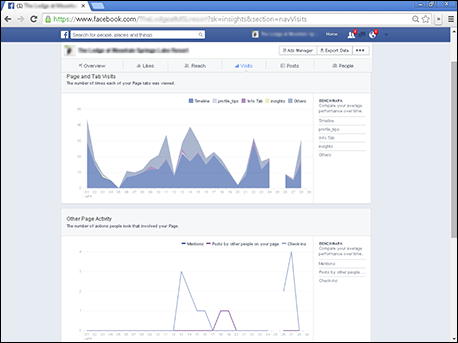
Figure 2-9: The Page and Tab Visits graph shows how many times people have accessed parts of your Page; the bottom graph displays the number of times users undertook other Page activities.
The final graph (see Figure 2-10), shows External Referrers, which are the top sites from which your Facebook Page receives traffic. Tracking the external sites that send traffic to your Facebook Page tells you about your audience. We discuss referrer sites in more detail later in this chapter, when we look at tracking activity outside Facebook.
Pay attention to the content on the external sites that refer traffic to your Page. This content is likely the content that attracts your ideal audience.

Figure 2-10: Referrals from other sites are crucial for successful Facebook marketing.
Perusing the Posts tab
The Posts tab conveys a great deal of important information on three sub-tabs: When Your Fans Are Online, Post Types, and Top Posts from Pages to Watch.
The graph at the top of Figure 2-11 — When Your Fans Are Online — shows how many fans are online each day of the week and at what times of the day. This important metric helps you decide when to post and advertise.
Below that, the All Posts Published section offers a table similar to the one on the Overview tab, as shown in the bottom of Figure 2-11. It includes the following:
- Published: The date and time the post was published.
- Post: A short preview of the post. If you click the text, you’ll see the entire post in a pop-up.
- Type: Type of post — Photo, Status, Link, or Video.
- Targeting: Whom the post was shared with, which applies if you chose to share with only a segment of your fans.
- Reach: The reach by post from both paid and organic sources.
- Engagement: How many clicks, comments, Likes, and shares each post generated.
- Promote: A shortcut to promoting a post, which you can do from here, instead of going to the advertising dashboard.

Figure 2-11: The Posts tab includes a sub-tab that shows when your fans are online.
The next sub-tab, Post Types, shows which posts receive the most reach and engagement. The top bar graphs in Figure 2-12 compare the average reach and engagement by type and a graph of All Published Posts appears at the bottom. It lets you know which type of post your fans respond to most. You can see in Figure 2-12 that the Status type of post had the greatest reach and engagement for this company.
The final sub-tab in this section, “Top Posts from Pages to Watch” lists popular recent posts from other Facebook pages that you have decided to “watch.” You can search for and select Pages to watch or choose from Pages that Facebook recommends in the Page Manager section. (You must be logged in as an Admin on a Facebook Page to see these recommendations.) This is an easy to way to keep tabs on what your competitors are doing on Facebook.

Figure 2-12: The Post Types sub-tab shows reach and engagement rates by type of post.
Profiling your People
This tab, shown in Figure 2-13, displays demographic metrics for
- Your Fans shows data about the people (demographics) who like your Page based on the information they provided in their user Profiles:
- Gender
- Age (13-17, 18-24, 25-34, 35-44, 45-54, 55-64, and 65+)
- Country and city where they live
- Language setting they selected when they accessed Facebook
- People Reached provides stats for people who have looked at your posts in the past 28 days (for example, for all the people who visited your page, whether or not they did anything). Similar to the data on the Your Fans tab, this section shows information about age, gender, location, and language.
- People Engaged provides demographic information for the people who liked, commented on, or shared your posts. (That’s how Facebook defines and measures engagement.)
- Check-ins data can be seen only after 30 people have checked in at your business. After this is unlocked, you can see the demographic information for everyone who has checked in to your business for the previous 28 days.
Check-ins can only be executed by people who have turned on Location Services on their smartphones and logged into Facebook mobile. From their News Feeds, users must tap the Check In icon and select their location from a list of nearby places. They can add an optional description of what they’re doing — shopping, eating, just messing around — and then tap Post to share their location with their own Friends.

Figure 2-13: The People tab shows demographic information for your fans (Likes), people reached, people engaged, and check-ins.
Making sense of the numbers
Compare demographic differences between Your Fans, People Reached, and People Engaged to see how successfully you’re targeting your most important cohorts — People Engaged and Likes. The closer the match between your Reach demographics and your Engaged or Like demographics, the higher the conversion rate for your overall marketing campaign.
For example, if the demographics of your Reach is broader than that of your likes or engaged users, you might find that modifying your ads or re-targeting your efforts to a narrower set of characteristics will help increase likes or engagement. On the other hand, if your Reach matches your desired group, but people aren’t liking or engaging with your page, review and revise your content.
Also consider in detail how the demographics match the target audience you have defined as prospective customers in your marketing plan. In theory, people who like or engage with your page are better-qualified prospects. If the demographics are similar, keep on doing what you’re doing. If they differ, dig deeper to see whether your campaigns aren’t successful, or if this unexpected population represents a new potential market segment.
Making Greater Use of Insights
In addition to crunching numbers, you can send Insights data to other places for further analysis, using it to make your content as good as possible, taking advantage of results to better target your ideal audience, and to improve interaction with your website or newsletter.
Exporting the data
At any time, you can export the data on any of the Insights tabs to an Excel spreadsheet. The exported report, which will be the same no matter which tab you download from, includes all the metrics from the Insights tabs, but without the graphics.
As they appear within Facebook, Insights data are difficult to sort and manipulate. You’re stuck with however Facebook has decided to present the data. By comparison, you can use Excel to create custom reports, compare content in different campaigns, combine data to report for time frames longer than 28 days, or do whatever your bean-counting, number-crunching, analytical heart desires.
Here’s how to export data from any of the Insights dashboards:
- Click the Export Data button in the top-right corner of the dashboard.
The Export Insights Data dialog box appears, as shown in Figure 2-14.
- Select a date range.
- Select Export.
As always, Facebook is making changes in the export format to match the new version of Insights. You may choose either the New or Old Export format, as shown in Figure 2-14. You can continue to use the old export format through the end of 2014.
- Select a data type: Page-Level Data or Post-Level Data.
- Page-level data is data about your Page.
- Post-level data shows you data on each of your Page posts.
- Select the file format required by your spreadsheet software: Excel or CSV (text file with delimiters).
- Click the Download button.
This data file goes to your Downloads file or to where downloads are configured to go on your computer. Then you have a very rich file to analyze — meaning that you have a boatload of information to check out! Don’t worry, though, because you don’t need to analyze all of it.
Not all the data available in the report may be useful, depending on your overall marketing goals. The data you will find most valuable depends on your type of business and the objectives for your Facebook Page. Look at these, though:
- Key metrics will be most useful because they tell you a great deal about the activity on your Page.
- City is important if you have a bricks-and-mortar business.

Figure 2-14: The pop-up for Export Insights Data.
Evaluating the impact of your content
Analyzing Insights involves more than just counting Likes. Data available through Insights helps you analyze the effect of your content, the value of Facebook comments, and how to respond to Unlikes.
From the initial like to every item they share, post, or comment on, your fans reveal a clear pattern that explains what they think about your content. Content is king! If you produce content that your fans enjoy and find valuable, they will keep coming back for more. And that’s why evaluating which content gets your users’ attention is so important.
Are you on the right track? Or do you need to make adjustments to your content strategy? In the following sections, we explore ways to evaluate your content strategy as it relates to the data you collect from Insights.
Watching your Likes
To begin with, your Facebook content will have very limited impact if no one sees it.
Review how many Total Likes your Page has as least once a month.
Perhaps your Page has a total of 500 people who have liked the Page. You might set goals for increasing the numbers each month. For that, think in more detail about the activities you’re doing outside Facebook to bring people to your Page. The upcoming section, “Evaluating Activity outside Facebook” helps you tackle that topic. Book IV, Chapter 2, offers lots of strategies.
You can’t influence everything. Replicate, to the best of your ability, what’s working. Get rid of what isn’t.
Using photos and videos
Facebook users favor photos and videos. If they haven’t been a regular part of your content strategy, now may be a good time to explore using it. Coca-Cola, which has the most engaged fans of any worldwide brand, has made it a point to post videos and photos on its Page regularly. Some of its more than 80 million Likes have followed suit by adding their own videos and photos to the Page. This works for smaller businesses, too. Lazypants, in Figure 2-15, encourages people to post their own photos. Or look at Humans of New York (facebook.com/humansofnewyork). This photographer’s Page displays marvelous photos to more than 5 million Likes — and sells a book at the same time.
Likes, comments, and unsubscribes — Oh, my!
Insights data are good storytellers, and the stories come from facts, not imagination. The graphs can tell you the days on which your posts received likes, comments, and — heaven forbid — unlikes. What happened on your Page on a day that suffered a lot of unlikes? Which days generated the most likes and comments?

Courtesy of Lazypants.
Figure 2-15: Lazypants encourages visitors to post their own photos.
One of the most valuable takeaways from Insights is about Page posts:
- Messages you posted
- Dates when they were posted
- Types of posts
- Overall reach
- Level of interactions on the People Engaged metric
Ask yourself these questions while you look at the data:
- What posts received the largest reach?
- How many engaged users did they attract?
- How can you explain why some posts are viewed more times than others: Is it the topic? Is it the wording?
Evaluating Activity outside Facebook
When evaluating activity outside Facebook via Insights, monitor one graph on a regular basis: the External Referrers graph on the Visits tab. The number of external referrers can make or break a website. Know which sites generate the most referrals to your Page so that you can think strategically about when and how to promote.
You may have experienced the good fortune of having someone write about your Facebook Page, without any involvement on your part, in a hugely popular blog — and then suddenly have seen a surge in activity on your Page. That outcome would be good fortune (or perhaps a little more like magical thinking).
That said, chances are good that the sites other than Facebook that refer traffic to your Facebook Page have something to do with actions you’ve taken outside Facebook.
What kind of actions are we talking about? We mean things like the following:
- Putting social icons on your website and blog
- Adding your Facebook URL to your LinkedIn profile
- Integrating your Twitter and Facebook updates
- Promoting your Facebook Page URL on other sites where you comment
- Adding your Facebook Page URL when you write a guest blog post
- Adding the URL to your e-mail newsletter signature
In other words, promote, promote, promote!
Making Changes Based on Insights
Enough analysis paralysis! After checking out your data in Insights, it’s time for action. This brief list has recommendations for fixing common problems that you may have identified from your Insights data. You can read more in the mentioned chapters.
- Getting more Likes: Use an app like Woobox or TabSite (described in Book VI, Chapter 4) to run a campaign designed to get Likes. Use exclusive content or coupons or contests (described in Book VI). For example, the Hungry Hobo (shown in Figure 2-16) gives fans a free sandwich for liking it on Facebook.
- Increasing your reach: The two ways to increase reach are paid and unpaid. (See Book VII, Chapter 1, for more details about paid.)
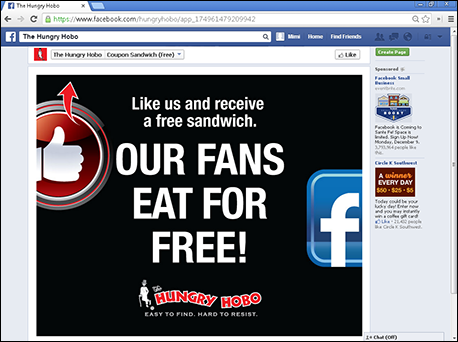
Courtesy of Sagemark, LTD dba The Hungry Hobo.
Figure 2-16: Rewards like this one from Hungry Hobo can encourage Likes.
- Increasing engagement: Read more about this topic in Book I, Chapter 1, and Book IV, Chapters 2 and 3.
- Reaching the “wrong” people: You can segment your Facebook followers to target your posts. (See Book VIII, Chapter 1.) If you’re using paid advertising, take a look at the People tab on Insights to see who your audience is and make sure you target those people. Book I, Chapter 2, has more about finding your audience.