
6
Machine Learning–Based SoC Estimation: A Recent Advancement in Battery Energy Storage System
Prerana Mohapatra*, Venkata Ramana Naik N. and Anup Kumar Panda
Dept. of Electrical Engineering, National Institute of Technology, Rourkela, Odisha, India
Abstract
An energy management system has become indispensable for a microgrid to manage different distributed energy resources in order to have a modern grid-connected system. To compensate for the intermittent nature of renewables and to ensure continuity in supply to the load, energy storage systems (ESS) especially battery energy storage (BES) have emerged for grid applications. The repeated charging/discharging cycles of the battery adversely affect its operational life which decreases the overall system reliability in the long term. This chapter concentrates on the management of the BES by estimating its state of charge (SoC). SoC estimation is an imperative metric to accurately estimate the available battery capacity. Recently, machine learning (ML) based estimation techniques have gained much attention as they can solve nonlinear modeling problems and their state estimation with great accuracy. In this study, ML techniques like support vector regression (SVR), and extreme learning machine (ELM) are investigated. To further improve the performance of ELM, regression analysis is also performed by using a penalty factor that reduces the error coefficient estimate toward zero. In this chapter, an extension of linear regression, i.e., ridged regression, is proposed that uses multiple regression data to minimize the prediction error. Hence, a comparative investigation of SVR and ELM with ridged regression is presented here.
Keywords: Battery, energy management system, energy storage system, extreme learning machine, machine learning, state of charge, support vector regression
6.1 Introduction
The prevailing energy market scenario indicates the global proliferation in energy demand which is mostly fulfilled by fuel-based power plants. This raises serious ecological disturbances like the greenhouse effect and global warming resulting from high carbon emissions [1]. On the other hand, renewable energies are clean and adequately available. As a result, integrating renewable energy sources (RES) into the existing system has become critical. RES like solar PV and wind are mostly used for grid integration. However, due to the irregular nature of renewables, an energy storage system (ESS) becomes imperative in providing energy in the absence of RES [2]. It also helps in peak shaving during high demand like in the evening; black-out capability or enables islanding operation thereby refining the robustness of the existing system. This aids in integrating additional renewable energy sources (RES) into the energy market.
In terms of power capacity and operational time, extensive research and development have been carried out on ESS technology, e.g., compressed air energy storage, supercapacitors, electrochemical energy storage (otherwise referred to as battery energy storage (BES)), flywheels, and superconducting magnetic energy storage (SMES) [3]. These storage technologies are capable of frequent and quick charging-discharging cycles while obtaining high efficiency, and hence are applicable for power grid applications and transportation systems. Several prevalent BES devices are explained in [4] highlighting the characteristics, merits, demerits, and applications of the topologies. The selection of a particular battery type is based on the initial, installation, and maintenance cost, lifecycle, and efficiency [5]. Lithiumion batteries are at the forefront in terms of dynamics, energy density, and cost competitiveness. They have higher cell voltage, longer lifetime, higher energy density, and remarkable life cycle, and therefore replace lead-acid batteries for several applications [6].
To improve the reliability and flexibility of the existing utility grid, the concept of a microgrid is introduced. In general, a microgrid is a scaled-down version of the utility grid that generates, manages, and controls different energy resources for a small locality. This increases safety from the cyber-threats and resistibility from any grid faults or black-out conditions as it can operate separately on its own. A typical microgrid consists of different distributed energy resources (DERs) like distributed generations (DGs), ESS, loads, and a centralized control as seen in Figure 6.1. The chapter focuses on the BES amongst all ESS technologies.
The microgrid control mechanism includes an automated energy management system to control and coordinate the operations of different DERs [7]. This would maximize the penetration of RESs, minimize the energy losses, operational costs, fuel consumption, and carbon emission. Also, this establishes an interaction with the existing utility grid for the import/ export of power and schedules the operations of DERs for proper load sharing. To achieve these objectives, an energy management system considers a few inputs from the DERs and load as listed in Figure 6.2. This chapter focuses on the energy management of the BES for appropriate power flow in the microgrid by estimating SoC accurately [8].

Figure 6.1 Centralized control of a microgrid.

Figure 6.2 Layout of an energy management system.
For having a good life cycle, it is crucial to know the energy availability in a battery concerning the initial energy at the fully charged state. This gives the operator an estimate of the time a battery will last before needing to be recharged. A parameter called state of charge (SoC) is defined to evaluate the energy obtainability of a battery and is expressed with respect to the rated capacity as in (6.1).

where Qobtainable is the maximum available energy and Qrated denotes the rated battery energy capacity.
Overcharging and over-discharging scenarios may also be avoided through SoC estimation, which can improve the battery’s life cycle. Therefore, an accurate SoC estimation is highly critical for user convenience and battery longevity. However, due to the unpredictability of the battery’s intrinsic chemical properties, estimating SoC is challenging. This chapter concentrates on the SoC estimation of lithium-ion batteries. Numerous strategies for estimating battery SoC have been described, including the coulomb counting method, look-up table approach, model-based approach, data-driven, and hybrid approaches [9]. One of the simplest methods is the coulomb counting method. It calculates the SoC by integrating the discharging current over the cycle. However, this approach can be reliable only if the initial SoC is known and the current is precisely calibrated. The model-based approach is quite reliable and accurate but requires extensive domain knowledge, which increases the time taken for its development. The electrochemical model has high precision due to the involvement of internal chemical reactions but this also owes to high error due to chemical complexity. The SoC of a lithium-ion battery is estimated using a variety of model topologies [10]. An electrical equivalent model based on open circuit voltage is presented [11]. Alternatively, the data-driven approach needs limited prior knowledge of the internal chemical characteristics, complicated chemical reactions, and the battery’s model parameters. Hence, it requires less time to model a complex system. Fundamentally, a data-driven technique can work effectively for a huge available data [12]. Artificial neural networks, fuzzy logic controllers, and machine learning (ML) techniques are a few examples of data-driven techniques that depend on the historical experimental data for training and estimating SoC. Hybrid approaches are followed by combining the advantages of any two methods. Generally, the simplicity of the coulomb counting method is applied along with the accurate model-based techniques or data-driven techniques. A similar approach is executed in [13] combining the fuzzy logic controller to estimate the SoC. Another hybrid technique is proposed in [14] which uses the k-nearest neighbor algorithm along with the Gaussian filter for lithium-ion batteries. An ELM-based SoC estimate method is presented in [15] in which the parameters are optimized using a gravitational search algorithm.
Recently, machine learning–based estimation techniques have gained much attention as they can efficiently solve nonlinear problems with great accuracy. It is realized that the regression analysis in the machine learning technique is used majorly for prediction analysis, forecasting, and estimating future data based on various dependent and independent data. Further to improve the performance, an extension of linear regression, i.e., ridged regression is proposed that introduces a small bias called penalty factor for ridge regression to minimize the prediction error. In this chapter, the ML techniques like support vector machine (SVM) and extreme learning machine (ELM) are investigated for SoC estimation. SVM applies the minimization principle to deal with a small number of samples [16, 17]. However, numerous factors, such as error control parameters and penalty coefficient, must be fixed, which takes time and makes practical implementations challenging. Conversely, ELM has a simple structure, and fast learning capability, and it is easy to regulate the parameters without getting trapped into a local minimum [18]. Hence, superiority in performance of ELM with ridged regression is evaluated here.
6.2 SoC Estimation Techniques
The classification of techniques employed for the SoC assessment is represented in Figure 6.3. A brief review of the below-mentioned methods is presented highlighting the merits and drawbacks of each method.

Figure 6.3 Classification of SoC estimation techniques.
6.2.1 Coulomb Counting Approach
Because of its simplicity, the Coulomb counting method is the most often used SoC estimating method. The SoC (SoCt) at a particular time, t is estimated by considering the initial SoC (SoCi) and an average of the discharging current (id) over the cycle as in (6.2). This method is also named as ampere-hour integral method as it is measured as current over a certain time period.

where η is the cell’s coulombic efficiency.
The precision of the current sensors, as well as the initial SoC estimation, are key factors affecting the method’s performance. In addition, the rated capacity must be recalculated from time to time to guarantee that the battery’s maximum capacity is maintained. However, the shortcomings can be overcome by combining this method with other complex methods for better accuracy [19–21].
6.2.2 Look-Up Table Method
The external characteristic parameters of the battery cell like open-circuit voltage or discharging current, impedance, etc., highly influence the SoC estimation. Therefore, a direct mapping table can be generated by considering rigorous observations. The applications of this method are limited to laboratory uses only. The open-circuit voltage (Voc) is assessed at regular intervals by removing the supply and allowing the battery to rest to obtain accurate results. As a result, real-world applications like transportation and grid integration are challenging to deploy.
6.2.3 Model-Based Methods
The model-based SoC estimation techniques are believed to be the most advanced and accurate way of estimation techniques as they consider the internal characteristics and dynamics of the batteries. They are broadly classified into two categories as electrochemical and equivalent circuit models.
6.2.3.1 Electrochemical Model
The electrochemical models are highly influenced by the internal chemical characteristics like kinetic process, the concentration of the electrolytes, the charging/discharging process, and potential distribution between the electrodes [8]. Due to the involvement of intensive domain knowledge, these methods provide accurate results. However, the same advantage also turns out to be the drawback of this method as it is difficult to realize all the parameters affecting chemically to determine the SoC.
6.2.3.2 Equivalent Circuit Model
To design an equivalent circuit model, the battery may also be described in terms of electrical components such as resistors, capacitors, and voltage sources. This is an approximate model that is inexpensive and effective for analysis. The most commonly employed models are Rint model, Thevenin model, and DP model [22]. The SoC is a non-linear function of the open-circuit voltage (Voc) that is affected by the circuit configuration.
For an instance, a modified Thevenin equivalent model is modeled by designing resistors, and capacitors representing the diffusion and polarization of the battery cell [23]. Figure 6.4 reflects the battery equivalent model considering the internal resistance (Ri), diffusion parameters (Rd, Cd), and polarization parameters (Rp, Cp). The external parameters of the battery like terminal voltage (Vbt), and battery current (ibt) also influence the SoC estimation.
The adaptive filtration techniques like Kalman filters and their derivatives are utilized to assess SoC using model-based techniques [24–26].
6.2.4 Data-Driven Methods
The SoC is estimated using data-driven approaches by creating a supervised link between external characteristics such as terminal voltage of the battery, its discharge current, temperature, and the battery’s SoC. The supervised relationship is based on the non-linear mapping of the inputs with the instantaneous SoC. This technique overcomes the coulomb counting method’s inaccuracy, the look-up table method’s impracticability, and the complexity of model-based techniques. Examples of a few supervised learning techniques are artificial neural network (ANN), Fuzzy logic controller (FLC), machine learning (ML), and deep learning (DL). In Figure 6.5, the basic architecture of an ANN is shown, with x and y representing the input and output, respectively, and w representing the weight associated with the input and hidden layer.

Figure 6.4 Thevenin equivalent model.
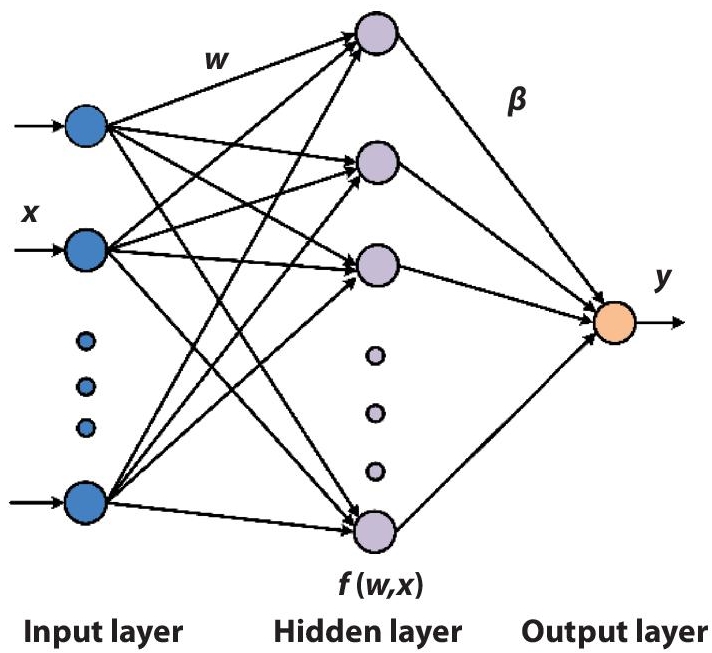
Figure 6.5 Basic structure of ANN.
The learning is independent of human supervision which reduces error and increases applicability. There have been developments in variants of ANN that differ in structure yet have similar functionalities like backpropagation network, recurrent network, and radial basis functional network [27–29].
6.2.5 Machine Learning–Based Methods
6.2.5.1 Support Vector Regression
One of the most widely applied machine learning approaches for classification applications is the support vector machine. It can also be utilized for solving regression problems as it shows good performance for prediction analysis. Hence, it is named support vector regression (SVR). The basic aim of the SVR technique is to define a hyperplane such that maximum data points are present on the hyperplane and minimize the upper bound of the generalization problem such that most of the data points stay within the boundaries. The data points close to the hyperplane are called support vectors [30]. The basic idea governing SVR is explained in Figure 6.6.
The linear regression function is given as:
where ‘x’ denotes the input, ‘b’ denotes the regression constant and ‘w’ indicates the weight coefficient.
In general, real-life problems are non-linear and cannot be linearly regressed. Therefore, the SVR technique maps the input into some non-linear functions for better prediction. The SVR function is generalized as:
where 〈x, xi〉 represents the mapping function, and the weight coefficient, ‘w’ can be determined by minimizing the weight function as:
 (6.6)
(6.6)Subjected to
 (6.7)
(6.7)where ζi, ![]() represents the distance between actual values outside the boundaries (slack variable) and corresponding boundary values (ε) of the tube.
represents the distance between actual values outside the boundaries (slack variable) and corresponding boundary values (ε) of the tube.
It is essential to perform regression in higher dimensional feature space using an appropriate mapping function. Different types of kernel functions are employed to transfer low-dimensional input space into high-dimensional space, aiding regression speed.

Figure 6.6 Basic structure of SVR.
where a and b are the constants chosen suitably for accurate regression. The linear kernel function is easy to implement but is time-consuming. The polynomial kernel function of degree 2 is also called a quadratic kernel function. The Gaussian kernel function has a bell shape which leads to asymptotic accuracy but it is quite complex.
The Lagrangian multipliers in the Karush-Kuhn-Tucker conditions are used to solve the constrained optimization problem:
where λi, ![]() are the lagrangian multipliers.
are the lagrangian multipliers.
Hence, the regression function can be equated as:
where K(x, xi) represents the kernel function mapping the two vectors x and xi in its feature space.
6.2.5.2 Ridged Extreme Learning Machine (RELM)
Extreme learning machine belongs to the class of single-layer feed-forward neural network in which only one hidden layer is designed and the weights associated with the input and hidden layer are randomly assigned [31]. Subsequently, the output can be calculated analytically. Figure 6.7 shows the architecture of basic ELM.

Figure 6.7 Structure of ELM.
For a set of samples {S=(xi,yi)}, xi represents the input and yi denotes the output node, and i=1,2..n where n is the no. of samples.
The output layer matrix is calculated as:
where Hl represents the hidden layer matrix and β denotes the weight associated with the output and the hidden layer.
 (6.14)
where, F(.) is the activation function like sigmoid, tanh, sin, cosine, radial, basis; w denotes the weight associated with input and hidden layer and L represents the no. of hidden layer node.
Since the hidden layer matrix (Hl) is not a square matrix; the output weight β is computed from equation (6.13) as:
where, ![]() represents the pseudo inverse of matrix Hl calculated by Moore Penrose inverse.
represents the pseudo inverse of matrix Hl calculated by Moore Penrose inverse.
Generally, the small value of output weight (β) gives better generalization performance. Therefore, ridged regression is performed to minimize β using a suitable penalty factor as:

Differentiating (6.17) with respect to β and equating to zero, we get,
 (6.18)
where (1/R) is the penalty factor and the value varies between 2 ̶ 22and 222. The solution obtained with ![]() term results in non-singular term
term results in non-singular term  that achieves bettergeneralizationin performance [32]. The output node can be formulated as:

The hyper-parameter like weights associated with hidden layer nodes and input nodes (w) are randomly generated which affects the overall performance.
6.3 BESS Description
A lithium-ion battery of model LG 18650HG2 is taken into consideration for the SoC estimation. The detailed configuration of the battery cell whose data are considered is listed in Table 6.1. The dataset comprises the charge-discharge cycle of the battery cell at a 1C rate for different temperature conditions [33]. The SoC is assessed by dividing the Ah data by the battery nominal capacity as in (6.1) considering discharge starting at 100% and charge ending at 100%.
6.4 Results and Discussion
The normalized data set of the drive cycle of the battery cell at two distinct temperatures (25°C and 10°C) is considered for analysis. The original cell output voltage, discharge current, and SoC are shown in Figure 6.8. Data normalization is performed to eliminate data redundancy effect while considering data with large values. The normalized data is calculated in the range of [-1, 1] as
 (6.20)
where d represents the original dataset, dnorm denotes the normalized dataset, dmax and dmin reperesnts the highest and lowest term in the dataset.
Table 6.1 Battery configuration.
| Parameters | Units | Specifications |
|---|---|---|
| Cell Chemistry | - | Li[NiMnCo]O2 (H-NMC)/Graphite+SiO |
| Nominal cell Voltage | V | 3.6 |
| Charge | A | 1.5 (CC-CV) Normal |
| Discharge | V | 2 |
| Nominal cell Capacity | Ah | 3.0 |
| Cell energy Density | Wh/Kg | 240 |

Figure 6.8 Original voltage, current, and SoC dataset at temperature (a) 25°C, and (b) 10°C.
The SoC is estimated in Matlab coding for the methods discussed in the earlier section. Considering the memory restrictions, 30,000 and 20,000 data at 25°C and 10°C correspondingly are considered. Of the data, 70% are trained and the remaining 30% of data are tested for validation of results. The performance measures like mean absolute error (MAE), root mean square error (RMSE), and mean square error (MSE) are well-defined in (6.21), (6.22), and (6.23) respectively, to measure the accuracy of estimation.
- MAE: It is calculated as the mean absolute difference of the forecasted value (fi) and the true value (ti) of the dataset over the testing samples count (Ntest). The lesser the value of MAE, the greater the prediction accuracy.
- RMSE: It is another index to indicate the model prediction accuracy. It is a measure of the standard deviation of the estimated error.
- MSE: It is a measure of the quality of the prediction algorithm and is calculated as the average squared error. Squaring the error eliminates the negative terms and further increases the large terms that give the user an idea to reduce those values for a better estimate.


The comparative analysis of performances of SVR with different kernel functions, ELM, and ridged-regression-based ELM (RELM) is presented in Figure 6.9 at 25°C and 10°C. Table 6.2 outlines the error parameters enumerating various approaches. The graphical representations of the performance indices give clarity on the superior performance of the proposed RELM technique as in Figure 6.10.

Figure 6.9 SoC estimation using linear SVR, quadratic SVR, Gaussian SVR, ELM, and RELM at (a) 25°C, and (b) 10°C.
Table 6.2 Performance evaluation of different methods based on performance indices.
| Methods | Parameters | |||||
|---|---|---|---|---|---|---|
| RMSE | MAE | MSE | ||||
| 25°C | 10°C | 25°C | 10°C | 25°C | 10°C | |
| Linear SVM | 0.029 | 0.031 | 0.025 | 0.026 | 0.00087 | 0.00095 |
| Quadratic SVM | 0.036 | 0.024 | 0.033 | 0.021 | 0.00135 | 0.00060 |
| Gaussian SVM | 0.048 | 0.029 | 0.044 | 0.026 | 0.00229 | 0.00085 |
| ELM | 0.0158 | 0.0145 | 0.0124 | 0.0135 | 0.000248 | 0.00021 |
| RELM | 0.0094 | 0.0061 | 0.0029 | 0.0057 | 0.000088 | 0.000037 |
6.5 Conclusion
An energy management system is an important aspect of microgrid control. This chapter highlights the management of BES by evaluating SoC which is crucial for optimum battery life. The irregularity of the battery’s internal chemical properties influences the battery parameters that determine SoC. This creates the need for a data-driven technique for SoC assessment. The conventional data-driven techniques like ANN and FLC are time-consuming and are difficult for practical implementation. Therefore, machine learning techniques are introduced that improve predictability and accuracy. This chapter compares and contrasts various machine learning algorithms for predicting battery SoC. Different kernel functions–based SVR techniques are implemented to estimate the SoC of the lithium-ion battery at two different temperatures. The major drawbacks of the SVR algorithm are inaccuracy for large datasets, time-consuming, difficulty in coefficient estimations, and complexity in calculations. These shortcomings of the SVR technique are overcome by the ELM technique. Furthermore, the output weight becomes minimum by adding the ridged regression analysis in the ELM that addresses the generalization issue with ultimate precision. The efficacy of the proposed regression-based ELM technique is observed with regard to the performance indices.

Figure 6.10 Graphical representation of the comparative analysis based on (a) RMSE, (b) MAE, and (c) MSE.
References
- 1. https://www.iea.org/reports/global-energy-review-2021/co2-emissions
- 2. U. Datta, A. Kalam, and J. Shi, “A review of key functionalities of battery energy storage system in renewable energy integrated power systems,” Energy Storage, vol. 3, no. 5, pp. 224, 2021.
- 3. M. Farhadi, and O. Mohammed, “Energy storage technologies for high-power applications,” IEEE Transactions on Industry Applications, vol. 52, no. 3, pp. 1953-1961, 2015.
- 4. D. Akinyele, J. Belikov, and Y. Levron, “Battery storage technologies for electrical applications: Impact in stand-alone photovoltaic systems,” Energies, vol. 10, no. 11, pp. 1760, 2017.
- 5. M. Sufyan, N. A. Rahim, MM. Aman, C. K. Tan, and S. R. S. Raihan, “Sizing and applications of battery energy storage technologies in smart grid system: A review,” Journal of Renewable and Sustainable Energy, vol. 11, no. 1, pp. 014105, 2019.
- 6. B. Diouf, and R. Pode, “Potential of lithium-ion batteries in renewable energy,” Renewable Energy, vol. 76, pp. 375-380, 2015.
- 7. A. Kumar, Y. Deng, X. He, P.Kumar, and R.C.Bansal, “Energy management system controller for a rural microgrid,” Journal of Engineering, vol. 13, pp. 834-839, 2017.
- 8. M. T. Lawder, B. Suthar, P. W C. Northrop, S. De, C. M. Hoff, O. Leitermann, M. L. Crow, S. S. Shriram, and V. R. Subramanian, “Battery energy storage system (BESS) and battery management system (BMS) for grid-scale applications,” Proceedings of the IEEE, vol. 102, no. 6, pp. 1014-1030, 2014.
- 9. R. Xiong, J. Cao, Q. Yu, H. He, and F. Sun, “Critical review on the battery state of charge estimation methods for electric vehicles,” IEEE Access, vol. 6, pp. 1832-1843, 2017.
- 10. C. Lin, A. Tang, and J. Xing, “Evaluation of electrochemical models based battery state-of-charge estimation approaches for electric vehicles,” Applied Energy, vol. 207, pp. 394-404, 2017.
- 11. H. He, R. Xiong, and J. Fan, “Evaluation of lithium-ion battery equivalent circuit models for state of charge estimation by an experimental approach,” Energies, vol. 4, no. 4, pp. 582-598, 2011.
- 12. D. NT. How, MA. Hannan, MS. H. Lipu, and P.J. Ker, “State of charge estimation for lithium-ion batteries using model-based and data-driven methods: A review,” IEEE Access, vol. 7, pp. 136116-136136, 2019.
- 13. D. Saji, P. S. Babu, and K. Ilango, “SoC Estimation of Lithium Ion Battery Using Combined Coulomb Counting and Fuzzy Logic Method,” 2019 4th International Conference on Recent Trends on Electronics, Information, Communication & Technology (RTEICT), pp. 948-952, 2019.
- 14. M. S. Sidhu, D. Ronanki, and S. Williamson, “Hybrid state of charge estimation approach for lithium-ion batteries using k-nearest neighbour and gaussian filter-based error cancellation,” 2019 IEEE 28th International Symposium on Industrial Electronics (ISIE), pp. 1506-1511, 2019.
- 15. M. S. H. Lipu, M. A. Hannan, A. Hussain, M. H. Saad, A. Ayob, and M. N. Uddin, “Extreme learning machine model for state-of-charge estimation of lithium-ion battery using gravitational search algorithm,” IEEE Transactions on Industry Applications, vol. 55, no. 4, pp. 4225-4234, 2019.
- 16. T. Hansen, and C. J. Wang, “Support vector based battery state of charge estimator,” Journal of Power Sources, vol. 141, no. 2, pp. 351-358, 2011.
- 17. J. C. Álvarez Antón, P. J. García Nieto, C. Blanco Viejo, and J. A. Vilán Vilán, “Support Vector Machines Used to Estimate the Battery State of Charge,” IEEE Transactions on Power Electronics, vol. 28, no. 12, pp. 5919-5926, 2013.
- 18. Z. Wang, and D. Yang, “State-of-charge estimation of lithium iron phosphate battery using extreme learning machine,” 2015 6th International Conference on Power Electronics Systems and Applications (PESA), pp. 1-5, 2015.
- 19. M. A. Awadallah, and B. Venkatesh, “Accuracy improvement of SoC estimation in lithium-ion batteries,” Journal of Energy Storage, vol. 6, pp. 95-104, 2016.
- 20. F. Codeca, S. M. Savaresi, and G. Rizzoni, “On battery state of charge estimation: A new mixed algorithm,” 2008 IEEE International Conference on Control Applications, pp. 102-107, 2008.
- 21. K. V. Singh, H. O. Bansal, and D. Singh, “Hardware-in-the-loop implementation of ANFIS based adaptive SoC estimation of lithium-ion battery for hybrid vehicle applications,” Journal of Energy Storage, vol. 27, pp. 101124, 2020.
- 22. H. He, R. Xiong, H. Guo, and S. Li, “Comparison study on the battery models used for the energy management of batteries in electric vehicles,” Energy Conversion and Management, vol. 64, pp. 113-121, 2012.
- 23. J. P. Rivera-Barrera, M. G. Nicolás, and H. O. Sarmiento-Maldonado, “SoC estimation for lithium-ion batteries: Review and future challenges,” Electronics, vol. 6, no. 4, pp. 102, 2017.
- 24. H. He, R. Xiong, X. Zhang, F. Sun, and J. Fan, “State-of-charge estimation of the lithium-ion battery using an adaptive extended Kalman filter based on an improved Thevenin model,” IEEE Transactions on Vehicular Technology, vol. 60, no. 4, pp. 1461-1469, 2011.
- 25. S. Wang, C. Fernandez, L. Shang, Z. Li, and J. Li, “Online state of charge estimation for the aerial lithium-ion battery packs based on the improved extended Kalman filter method,” Journal of Energy Storage, vol. 9, pp. 69-83, 2017.
- 26. C. Zhang, K. Li, L. Pei, and C. Zhu, “An integrated approach for real-time model-based state-of-charge estimation of lithium-ion batteries,” Journal of Power Sources, vol. 283, pp. 24-36, 2015.
- 27. M. Ismail, R. Dlyma, A. Elrakaybi, and R. Ahmed, and S. Habibi, “Battery state of charge estimation using an Artificial Neural Network,” 2017 IEEE Transportation Electrification Conference and Expo (ITEC), pp. 342-349, 2017.
- 28. F. Yang, W. Li, C. Li, and Q. Miao, “State-of-charge estimation of lithium-ion batteries based on gated recurrent neural network,” Energy, vol. 175, pp. 66-75, 2019.
- 29. H. F. Kong, L. J. Xiang, and S. L. Xia, “SoC Estimation on Radial Basis Function,” Advanced Materials Research, vol. 403, pp. 3119-3122, 2012.
- 30. A. L. Smola, and B. Schӧlkopf, “A tutorial on support vector regression,” Statistics and Computing, vol. 14, no. 3, pp. 199-222, 2004.
- 31. G. B. Huang, Q. Y. Zhu, and C. K. Siew, “Extreme learning machine: theory and applications,” Neurocomputing, vol. 70, no.1-3, 489-501, 2006.
- 32. G. B. Huang, H. Zhou, X. Ding, and R. Zhang, “Extreme learning machine for regression and multiclass classification,” IEEE Transactions on Systems, Man, and Cybernetics, Part B (Cybernetics), vol. 42, no. 2, pp. 513-529, 2011.
- 33. P. Kollmeyer, C. Vidal, M. Naguib, and M. Skells, “LG 18650HG2 Li-ion Battery Data and Example Deep Neural Network xEV SoC Estimator Script”, Mendeley Data, V3, 2020.
Note
- *Corresponding author: [email protected]