
8. A New Wave of Product Innovation
Product innovation is crucial to the growth of exchanges. Stock exchanges continually list new stocks, but it has been their venture into other equity-related products such as exchange-traded funds that has created growth. Equity options exchanges have expanded via a number of new equity indexes. The shift to electronic trading has significantly reduced the cost of starting a new product. It used to be that new products required floor space and traders. Today electronic exchanges require just a little more server space. And the pace of product innovation has increased significantly.
In this and the next four chapters, we discuss the implications of the four basic transformations we explored in the first part of the book: floors to screens, private clubs to public companies, national to global competition, and smaller to larger. In this chapter we delve into the implications of the tremendous surge in product innovation that we outlined in Chapter 7. The creation of new products is one of the most important activities that occurs at exchanges. New products, if successful, can translate within a short period of time into new business. Sometimes product innovation can mean the difference between life and death. For example, NYMEX almost disappeared in 1976, after a very serious default on its largest contract, Maine potatoes. The contract was destroyed, and NYMEX was reduced to a mere sliver of an exchange; it might well have disappeared if it had not turned its creative efforts into the area of energy futures contracts. The Chicago Mercantile Exchange today would be only 1% of its current size had it stopped innovating in 1972. Because it created currency, interest rate, and stock index products, it grew to be a giant. But if it had taken a breather after having created successful pork belly and live cattle contracts, it either wouldn't be here today or it would so small, no one would notice it.
We’ve spoken of several major transformations of exchanges, big fundamental changes in the way exchanges are organized. Have any of these changes affected the way product innovation is carried out today? Of all the transformations, the one that most affects the process of product innovation is the switch from floors to screens, a switch that significantly reduces the cost of listing new products. You don't need floor space. You don't need floor traders and brokers. All you need is a little more space on the server to accommodate new products. In other words, you don't need to find a new specialist and a new post on the floor to list additional stocks. To list new derivative products, you don't need to create new pit space in futures and options markets and fill those pits with humans. This shift to screens has had the remarkable effect on the pace at which new products have been brought to market. This shift is not the only driver, but it is the major driver. If it's cheaper to list new products, we ought to see more products being listed.
What exactly do we mean by innovation? Product innovation means different things in the derivatives exchanges and the equity exchanges. In the case of a stock exchange, a new product is most often the listing of the shares of a new company. These listings, whatever class and type of shares they may be (Class A or Class B, preferred or common), are driven more by the companies than by the exchanges. The exchange may try to induce companies to list on its system as opposed to another exchange (e.g., Nasdaq rather than the NYSE), but until companies are really ready to go public they are not going to list anywhere. The exchange is reactive. The listing process is driven not by the exchanges but rather by entrepreneurial activity and company formation. We doubt that many people would say that the relatively mechanical listing of a new company's stock on an exchange is innovation. The innovations in the equity market have been relatively slow in coming. We had closed-end funds in the form of U.K. investment trusts beginning in the 1860s, American depository receipts (ADRs) debuting in 1927, and exchange-traded funds (ETFs) starting in Canada in 1989. In recent history, most innovation in things traded on stock exchanges has involved new types of ETFs, including a variant called the exchange-traded note (ETN), and new types of equity-related options. 1 We will touch on these developments in a moment.
But the real thrust of innovative activity has been toward the derivative side of the street. To a certain extent each new futures contract is an innovation, unless it is an exact replica of a contract already traded on another exchange. 2 There are so many aspects that must be specified in a futures contract that there is a lot of room for creative thought. Options on futures or options on equities are a little easier and more standardized. 3
Let's first look at innovation in futures, but before looking at the recent past let's look at the broad sweep of major innovations in modern futures markets by examining Table 8.1. Futures markets began in agricultural products shortly after the American Civil War, when grain futures were introduced at the Chicago Board of Trade. It took 68 years before the next wave of innovation, and that was in the case of metal futures. The first metal futures contract was listed at the Commodity Exchange (COMEX) in 1933. The pace of innovation then sped up; it took only 34 years for the next major innovation in futures markets, and that was adding an energy product in the form of a propane contract at COMEX. The innovation that dramatically changed what could be listed on futures exchanges was the 1972 unveiling of a set of eight currency contracts at the Chicago Mercantile Exchange. This was the first time a futures contract had been listed on something financial, something that was not a physical commodity. Only three years later, the CBOT introduced a mortgage-backed debt instrument called the Ginnie Mae, or GNMA, contract. Finally, rounding out a basic set of financial contracts was stock index futures, which started in 1982 with the Value Line contract at the Kansas City Board of Trade.
| *In millions of futures contracts traded. | ||||||
| **The largest equity options contract was Kospi 200 Options. | ||||||
| Source: Exchanges and FIA Monthly Volume Reports, December 2007. | ||||||
| Date | Category | Original Innovation | Dominant Futures Contract in 2007 | |||
|---|---|---|---|---|---|---|
| Product | Exchange | Product | Exchange | Volume* | ||
| 1865 | Agricultural | Grains | CBOT | Soymeal | DCE | 64.7 |
| 1933 | Metals | Silver | COMEX | Aluminum | LME | 40.2 |
| 1967 | Energy | Propane | COMEX | Light Sweet Crude | CME | 121.5 |
| 1972 | FX | Eight Currencies | CME | USD/Euro | CME | 43.0 |
| 1975 | Debt | GNMA | CBOT | Eurodollar | CME | 621.5 |
| 1982 | Stock Indexes | Value Line | KCBOT | E-Mini S&P 500** | CME | 415.3 |
Note that not a single one of these initial innovative contracts survives as the dominant contract in its class today. What they did was create the foundation on which further contracts in that particular category could be developed. For example, the Ginnie Mae contract at the CBOT was the first of about eight different attempts to create a mortgage-backed futures contract. Every one of them failed. But what initially established itself as the dominant debt futures contract was the U.S. Treasury bond contract. Later the Eurodollar contract at the CME would take and hold the dominant position.
Now, many other innovations in futures came after this, but these were the categories that resulted in large, blockbuster contracts. Weather is an innovation, catastrophic insurance is an innovation, credit default swaps are an innovation, but not one of these has resulted in a large, highly liquid futures contract.
Innovation Acceleration in Futures Products
Let's do the numbers. 4 According to the regulator of the futures markets, the Commodity Futures Trading Commission (CFTC; see Figure 8.1), the number of new futures and options products filed annually with the CFTC has been moving up at a healthy pace ever since they started keeping records in 1922, and it has exploded in the last six years. Specifically, futures exchanges averaged five new contracts each year in the 1970s, 20 per year in the 1980s, and 48 per year in the 1990s. This is quite respectable growth, with the number of new futures and options contracts more than doubling each decade. But the growth that began in 2000 dwarfed all prior increases. After the period in which 5, 20, or 48 contracts were added in the United States each year, the three years from 2002 to 2004 saw an average of 207 new contracts per year. And during the three years following that, 2005 to 2007, exchanges launched an average of 422 futures and options contracts launched in each of those years.

The Old World: Launching New Products on Trading Floors
So what is going on here to generate such a rapidly increasing rate of innovation? Let's explore this a bit more deeply. On a floor-based exchange, the capacity to list new products, or to trade greater volumes in existing products, for that matter, was a direct function of the size of the trading floor and the number of traders on that floor. Every customer order to buy or sell futures contracts had to be executed by an exchange member acting as a floor broker. And every order had to have the other side taken by either another customer who happened to be putting in an opposite order at the same time and who also had to be represented by another exchange member acting as a floor broker or, more likely, by another member acting as a scalper on the trading floor.
There were two major roles exchange members could take on the trading floor. They could be a floor broker executing customer orders, or they could be a local (or scalper) who traded for their own account. These scalpers would take the opposite side of incoming orders, hold the position for a few seconds or minutes, and then offset these positions by taking the opposite side of a new customer order in the opposite direction, hopefully at a price difference that gave them a small profit. Even though the scalpers had no obligation to make a market, as does a specialist on some stock exchanges, as a group they did just that. There would always be a bid and offer available in the pit because either scalpers would be shouting them out or at least they were prepared to do so if a request for a quote came in. Scalpers made the market and created the liquidity for customer orders. In other words, the crowd on the floor in a particular pit was always bidding at some price and offering at some price and that bid and offer was essentially the market. But this crowd was made up of people, and these people needed a few square feet of trading floor in which to stand.
To list a new product, the exchange needed to build a new trading pit and populate that trading pit with exchange members who would serve as both brokers and locals. Many of the floor-based exchanges had to either engage in physical expansion or renovation programs or literally move to new buildings to accommodate the surge in trading that took place at various times in their histories. The Chicago Board of Trade, for example, created in 1848, moved five times during its first 37 years. While it spent many years at its iconic home at Jackson and LaSalle, it could accommodate the volume boom of the 1970s and 1980s only by building a large annex behind the exchange. The Chicago Mercantile Exchange has also had five different homes during its history. When it moved into its fourth home, at 444 W. Jackson, in 1972, it had the largest trading floor in the world, which was designed to accommodate the Exchange for two decades. Within only five years, the CME was running out of room and had to increase its floor space 30% by purchasing air rights and building out over the sidewalk. Despite the expansion, the building that was planned to accommodate the exchange for 20 years grew too small after only 10 years, and the CME made another move for more space to 10 South Wacker Drive in 1983. 5
What about people? What about increasing the manpower on the trading floor to accommodate new trades? Initially when exchanges launch new products, they don't know whether they're going to succeed or not, and therefore they do not want to expand the number of members and potentially dilute the value of existing seats until it's clear that the new product will be a success and will contribute significantly to the exchange's business and therefore require an increased number of traders. One of the best examples of temporarily increasing trading capacity occurred in 1982, when the Chicago Mercantile Exchange launched the S&P 500 futures contract. Of course, the exchange did all the right things to promote the use of these new contracts. It put on seminars, it took out ads in the newspapers, and it had the opening bell rung by one of the most famous TV commentators on equity markets at the time, a guy named Louis Rukeyser, the host of the immensely popular program called Wall Street Week.
But to succeed, the exchange had to offer liquidity to all the orders that might come in. To build this liquidity in its new stock index product, the exchange essentially borrowed traders from other pits. The exchange leadership6 organized meetings of all the exchange members in which they strongly urged the members, for the sake of their children and for the sake of the future of the exchange, to support this new contract. This was especially important since they expected to have stock index competition from the CBOT, from the Kansas City Board of Trade (which was actually the first exchange out of the box with its Value Line contract), and most important, from a new futures subsidiary of the New York Stock Exchange that was listing a futures contract on the NYSE Composite index. 7
Specifically, they asked each member to leave their own pit in which they were making a good living and stand in the S&P 500 pit for 15 minutes a day. Throughout the trading day, there was a voice over the loudspeaker that would remind traders of their commitment with the words “Fifteen minutes, please.” It was only three words, repeated twice, but everyone knew what they meant. And to further reinforce pushing a sufficient number of traders into the S&P pit to make a liquid market, the exchange leaders would actually go onto the floor, grab traders in pork bellies or cattle or T-bills by the elbows and escort them over to the S&P pit so that they could fulfill their 15-minute commitment.
Now, while these kinds of efforts did a reasonable job of creating liquidity back in those days, once the new market was established and growing, exchanges often had to resort to the more permanent solution of membership expansion programs. This was done in one of two ways. One was through the creation of new seats that were issued in such a fashion so as to minimize the dilution effect on existing members. The other was to issue “trading permits” with no ownership rights embedded in them.
The new-seat creation technique was used by the CME five times to accommodate waves of new products. In 1972, when the CME became the first exchange to list financial futures, 8 it created a separate exchange called the International Monetary Market (IMM), which, three years later, was merged back into the CME as a major division with 650 new memberships, growing the exchange from 500 to 1150 members. In 1976, the CME sold 300 Associate Mercantile Market (AMM) seats to try to breathe liquidity into the ailing non-livestock agricultural markets, bringing the total memberships to 1450. In 1981, the exchange increased its floor trader capacity 25% by giving each existing member a fractional one-quarter seat. The members could sell, lease out, or combine the fraction with three other quarters they bought in the market to create a new seat and had four years to do so. 9
Then in 1982, to accommodate new markets in stock indexes and options, the CME created the 1287-member division known as the Index and Options Market (IOM). Finally, in 1994, the exchange added the Growth and Emerging Markets (GEM) division with 413 seats to accommodate a new initiative to list a government bond, a stock index, and a currency for each of the major emerging markets such as Mexico, Brazil, Argentina, South Africa, Taiwan, Russia, and others. In both these cases, some seats were sold to existing members at a deep discount and to outsiders at full price. The fact that existing members had the right to trade all products listed in the new divisions helped mollify concerns over seat value dilution.
The New World: Launching New Products on Electronic Exchanges
Contrast that with life in an electronic exchange. With screen-based trading, new products require simply making additional space on existing servers or installing new servers to handle the flow of orders and price quotes and accommodate the matching of trades. The lower cost and simplicity of creating new trading capacity should encourage the more rapid development and listing of new products.
Because the cost of maintaining a product on the server is trivial (compared to maintaining it on the floor, with traders standing in a pit waiting for orders), products that might not have justified the cost in a floor world are kept in the electronic world. For example, the weather futures contracts traded at the CME really trades on an episodic pattern. There will be several days of no trading; then suddenly two parties will find one another and execute a trade. As long as the contract is sitting on an electronic market and potential customers can request a quote, it's much easier to maintain a market like this than it is to do so in a floor-based system. 10
The other thing that is absolutely remarkable is the shift in the willingness of exchanges to fragment liquidity into a large number of contracts. In the past, the trend had always been to try to concentrate liquidity into a small number of futures contracts and into a relatively small number of months for each contract. For example, the typical listing cycle for futures contracts on financial instruments has been the March quarterly cycle, meaning that the only contract months listed for Eurodollars, Treasury notes, and the German bund would be March, June, September, and December. The idea was to concentrate liquidity into those four months. The thought was that having contracts every single month and letting people use the month in which they wanted futures exposure would result in lots of contract months, each month having little liquidity. But if you had only a few months, everyone would be forced to use those few months and there would be greater liquidity in those few months. Hedgers might be put off a bit, but they could always take a position further out than they needed and then get out of their futures position when the need for the position disappeared, and they would benefit by finding more buyers and sellers operating in those few months.
The same logic held with slicing up a commodity geographically. You could have four cattle contracts based in different market centers around the country to accommodate people who are interested in the prices of Midwest, Texas panhandle, Southeast, or West Coast cattle. But it was always thought better to have only one cattle contract based in the most important delivery area, to concentrate buyers and sellers in that single contract.
In the new electronic world, this seems to be much less a concern, and, in fact, exchanges have embraced fragmentation of liquidity in a plethora of similar contracts. Take the CME weather contracts. In the past, in order to concentrate liquidity, there might be weather contracts based in one or just a handful of cities. Admittedly, weather varies geographically more than cattle prices, and it would be virtually impossible for a trader to hedge Los Angeles weather on a Boston weather futures contract. Still, the principle of concentrating speculative liquidity dictates keeping the number of such contracts small. Or it used to. So how many weather contracts does the CME have in its stable? To be specific, during the period 1999 to 2008, the CME has registered with the CFTC, either via certification or request for approval, 314 different futures and options contracts based on weather (see Table 8.2). These cover temperature, snowfall, frost, wind, and hurricanes in various European, Asian, and North American cities.
The same is true for energy contracts at NYMEX, as is evident, in Figure 8.2. To date, 387 energy contracts11 have been processed by the CFTC. Of these, 340 (88%) have been submitted by NYMEX, which is no surprise since it was the pioneer in energy, having started heating oil and industrial fuel oil contracts back in 1975. But back in those days, futures exchanges didn't come out with new products all that often. After the two energy contracts in 1975, it took NYMEX six years before it came up with some more energy contracts, and in fact, of the 26 years between 1975 and 2000, there were 14 years in which there were no energy contracts launched at all. And when contracts were launched, they were typically done one, two, or three at a time.
 |
| Figure 8.2 |
But everything changed beginning in 2002, when we began to see 20 or 30 or 40 or more contracts launched every year. Many of these are contracts on the difference between two prices, such as Rotterdam vs. Singapore gas oil or Henry Hub vs. New York natural gas. And because there are many locations at which energy products are priced, there are many, many differences that can be calculated. Even though NYMEX has been in the energy business since 1975, 90% of all NYMEX energy contracts filed with the CFTC were filed between 2002 and May 2008.
Some Things Haven't Changed
Make no mistake; there are other aspects of the product development process that have not been affected by these fundamental transformations of modern derivatives exchanges. For example, it still takes a reasonable amount of time to create the terms and conditions for a new futures contract. The usual process for developing a new futures contract involves first having the research economists learn as much as they can about the way the commodity or asset is typically traded and transferred from one party to another in the underlying cash market. They work very closely with industry representatives and frequently will create advisory committees of knowledgeable industry participants to advise on the structure and specifications of a particular contract.
Physical commodities are the toughest to do. There are many characteristics of a physical commodity that must be specified in the contract. For example, for a crude oil contract, will the oil be sweet or sour (which indicates the amount of sulfur in the oil—the more sulfur, the more sour)? Will it be light, intermediate, or heavy (which indicates the density of the oil)? Light, sweet crude fetches higher prices than sour, heavy crude, because it yields more high-value products like gasoline and there is less sulfur to remove. Where will the oil be delivered? How will the oil be delivered—by tanker or by pipeline or in-tank transfer? How big should the crude oil contract be? Pipelines have minimums on the amount of oil that can be shipped through them in a single delivery (typically 25,000 barrels). And when should it be delivered? Should delivery be scheduled for a specific day of the month, or perhaps prorated over the entire month? All of this takes considerable research and time to sort out. The research economists must spend a significant amount of time speaking with people in the industry involved in actual deliveries. 12
One way to reduce this amount of time is to design a contract to be cash or financially settled. What this means is that there are no actual deliveries, and the final settlement price on the last day of trading is not the price determined during the close in the trading pit but rather some other readily available benchmark price. 13 This system of cash settlement is used for the world's biggest contract, Eurodollars, for all stock index contracts, and for many of the energy contracts traded at NYMEX and ICE Futures. In fact, ICE, a competitor of NYMEX, actually used NYMEX prices to settle a number of its own contracts. NYMEX sued ICE claiming that ICE was appropriating NYMEX's intellectual property, but the court found in ICE's favor and ICE continues to cash-settle contracts based on the NYMEX prices.
In the days before demutualization, when exchanges were owned and run by their members, there were product committees, composed of exchange members and supported by professional staff, that would get involved in the process. Typically the product committee, with the assistance of research staff, would design the new futures contract and then would recommend the adoption of this contract to the Board of Directors. Sometimes there was even another committee between the product committee and the Board of Directors. At the CME, there was an oversight committee for financial products and another one for agricultural products. The members of these product and oversight committees, with their experience in trading other products and sometimes with experience in the underlying cash market, were able to contribute to the quality of the design process. However, this did add a layer of humans, among whom a consensus had to be built. And sometimes, because there were large egos involved, it was difficult to reach that consensus, or at least it took time to do so. One advantage of demutualization is that it took a layer out of the contract design process and thus reduced the time to market for a new product. Some exchanges will still make use of members in the design process; in fact, it would be wasting a valuable resource not to do so. But the members no longer have the same power over either insisting a product be done when it possibly shouldn't or vetoing a product that should be launched.
Regulatory Change Drives Product Innovation
Aside from the switch to electronic trading, there was another very important driver of product innovation, at least in the United States, and that was a huge reduction in regulatory burden as manifested in the Commodity Futures Modernization Act of 2000.
In the old world before 2000, exchanges had to develop a relatively thick document that would explain and justify every single term and condition in the futures contract. In other words, why was a particular delivery point chosen? Why was a particular grade of commodity chosen, or why was a particular time of the month selected for delivery?
In addition, the exchange had to explain why the contract had an economic justification, explaining why the futures contract was good for the world. Naturally, it took a considerable amount of time to put this document together, though a substantial portion of this information would have been needed even without the regulator—just to assure the exchange the product was designed properly. The exchange needed to do the research to find out what the practices were in trading and transferring the commodity from one party to the other in typical cash market transactions. However, the document sent to the CFTC took considerably more time than would have been the case if the exchange were simply making a business decision as to whether to launch a contract.
There were two reasons for this. First, exchanges would not by themselves feel obligated to develop an economic justification for the contract. These justifications required by the CFTC basically amounted to demonstrating that there were risks out in the economy that this new contract would help mitigate. This involved giving specific hedging examples and getting comments from industry participants, who would be interested in using the contract to manage risk. From an exchange's point of view, the ultimate test of whether a contract should be launched was whether or not traders would come. In other words, the exchanges are businesses, or more accurately, exchanges back then were not-for-profit institutions that housed their members and the members were conducting business. The members benefited if orders to buy or sell the new product came onto the floor. If the orders came in, that meant money for the members: commissions for executing orders, the bid-ask spread for scalpers who were making markets, and more opportunities to take a position in the opposite direction as the incoming orders for members who took longer-term positions. The members and the exchange didn't really care whether the orders were coming from hedgers or speculators. Commissions were the same from both.
To be fair, the conventional wisdom was that a successful market was possible only by the interaction of hedgers and speculators. If you didn't have the participation of those involved in the underlying industry (producers, merchants, processors, etc.), the market would not work. It wouldn't work because the idea was that you had industry participants coming in largely on one side of the market (e.g., feedlots coming in with short positions to hedge inventories of cattle) and speculative capital coming in on the other side to take the risk that the industry wanted to lay off. In addition, to have a contract in which physical delivery occurred, you had to have commercial participants who knew the ropes and would be able to make or take delivery of the commodity in question.
The second reason that the exchanges spent excess time and money to produce this document to the CFTC is that they had to explain things in a much more detailed fashion, in a way that could be understood by people who were not necessarily familiar with the underlying market. If they were simply producing an internal document to help them decide what the terms and conditions of the contract should be and to record the rationale for their various decisions, the document would have been much smaller. The bottom line is that if this document could be eliminated, it would save a considerable amount of time and manpower, something that can be critical in a competitive situation, especially when the competitor is from overseas and is regulated in a much lighter fashion and could get the product to market much more quickly.
Once this document had been submitted to the CFTC, the agency had up to one year to either approve or deny the exchange's right to list a contract for trading. Naturally, the exchanges protested the onerous burden of creating this document and waiting for up to a year for approval. So, in the Commodity Futures Modernization Act of 2000, there was a provision that said exchanges need only to certify that listed contracts complied with all the regulations of the CFTC and all the provisions of the Commodity Exchange Act. On top of this, the exchange only had to give a one-day notice to the Commission that it was going to start this new contract. So, on the day prior to launch, at the latest, the exchange would give the Commission a copy of the futures contract along with a one-page letter certifying that the contract complied with all aspects of CFTC regulations and all aspects of the Commodity Exchange Act.
It's also worthwhile to take a look at a number of contracts actually listed on U.S. exchanges over the past 50 years. This is taken from a presentation for which data ends in 2005, but it still sheds light on the points that we are making in this chapter. From Figure 8.3, we see the number of futures contracts that had some amount of trading activity every decade starting in 1955 and ending in 2005, and we notice a couple of things. First, agricultural contracts absolutely dominated the futures landscape in 1955, 1965, and even in 1975. They continued to play an important role up to the present but were gradually swamped by futures contracts in other categories. The second thing we notice is that in both 1955 and 1965 there were only about 50 futures contracts in the entire country that had any activity. But starting in 1975, the total number of futures contracts with activity began to rise, with the increase between 1995 and 2005 swamping all earlier growth experiences. In fact, the number of futures contracts with some trading activity in 2005 was three times the number of futures contracts that had some activity in 1995.
 |
| Figure 8.3 Source: Calculated from data in selected FIA Monthly Volume Reports. |
What was responsible for this increase? While the number of agricultural contracts and precious metal contracts dropped, virtually everything else rose, but nothing grew like energy. NYMEX was very aggressive in creating new futures contracts in energy, and thus energy represented two to three times or more the number of contracts in any other category.
Figure 8.4 gives us the number of contracts newly created each year beginning in 1956. As we can see, during the 1950s and 1960s the entire U.S. industry generated anywhere from two to 10 contracts in any given year. And during the entire period from 1956 to 2001, the number of new contracts launched by U.S. exchanges exceeded 20 only a few times. Then in 2002, it was 50, and the next year 40, and the next year almost 80, and in 2005 the number reached 120.
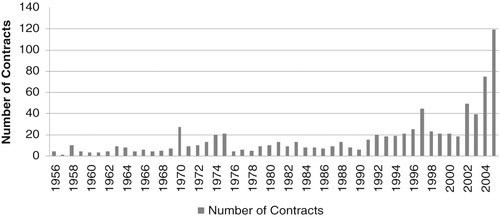 |
| Figure 8.4 Source: Calculated from FIA Volume Reports. |
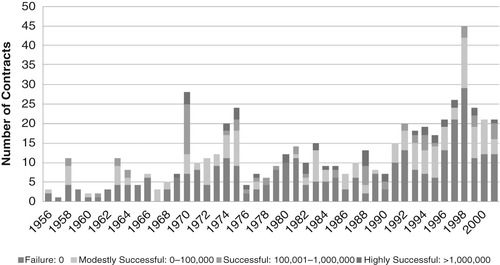
One interesting question is, how successful are these contracts launches? In Figure 8.5 we explore the question of contract success. Success here is defined by the volume of trading in the fifth year of trading. The idea is that five years should be sufficient to discriminate between those contracts that are going to succeed and those that will not. As you can see, on average about half of all futures contracts had zero volume in their fifth year of trading, a pretty clear indication of failure. At the other extreme, the number of contracts that were highly successful—that is, experienced trading volumes of over 1 million contracts per year in the fifth year of life—was small. Most years did not produce even one highly successful contract from any exchange. When they came, it was usually one or two, and occasionally three in a given year.
The Rest of the World
So far our focus has been on the United States. Let's now turn to the rest of the world. In 1980, if we had looked at the top 10 futures contracts on exchanges outside the United States, we would’ve found that eight of the most active futures contracts were based in Japan, and they were all agricultural contracts—soybeans, red beans, rubber, and even raw silk. The other two top 10 contracts were rapeseed and flaxseed traded in Canada on the Winnipeg Commodity Exchange. Fast-forward 25 years to 2005 and again take a look at the top 10 futures contracts outside the United States. First, not a single one of the 1985 contracts found their way onto the 2005 list; in addition, not a single Japanese contract or Canadian contract found its way onto the list. The 1985 list was completely agricultural. The 2005 list was almost completely financial except for two very actively traded agricultural contracts at the Dalian Commodity Exchange in China. The 2005 list was also more geographically diverse. Half of the top 10 contracts were traded in Europe, 20% in China, and 10% each in Brazil, India, and Australia. The point is that the same kind of dynamic changes that have taken place in product development in the United States have also taken place in the rest of the world.
Does the growth curve of new contracts show the same pattern as it did in the United States? If we look at Figure 8.6, we see a pattern of aggressive growth going back all the way to the 1980s. Every five years beginning in 1980 the number of futures contracts14 with some level of activity grew at rates of 60–70% through 1995. The rate of growth then dropped over the next five years to only 20% but picked up to almost 50% between 2000 and 2005. So the recent rate of growth was actually a bit slower than during the first 15 years of this quarter century. Part of this can be explained by the fact that the rest of the world was growing not only in the number of futures contracts started by each exchange but also by a proliferation of exchanges. Countries that never had a derivatives exchange established one.
 |
| Figure 8.6 Source: FIA International Volume Reports. |
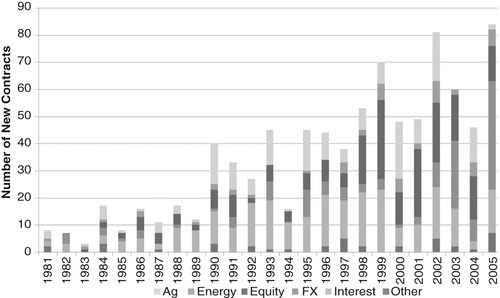
Despite the fact that more exchanges were being created in the rest of the world, U.S. exchanges have continued to be the most active in terms of generating new futures contracts. During the period 1981 to 2005, 631 new futures contracts were established in the United States, as can be seen in Figure 8.7. This represents 41% of new futures contracts created globally. Europe was number two with a 31% share, and Asia was number three with a 13% share.
 |
| Figure 8.7 Source: FIA Volume Reports and International Volume Reports. |
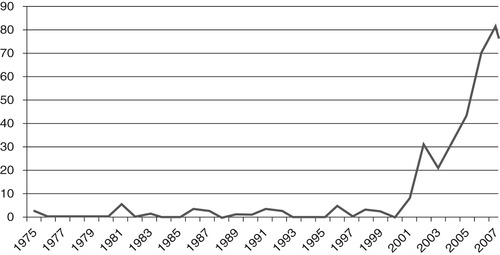
The fact that this new wave of innovation was not experienced as extensively in the rest of the world as in the United States is evident from Figure 8.8, where we see that innovative activity actually fell in 2003 and 2004 at the same time that such innovation was accelerating in the United States. So, although new futures contracts have continued to be created in the rest of the world, it seems as though the expansion of products has taken on a curve of a different shape. If we carefully compare the rest-of-the-world Figure 8.8 with the U.S. Figure 8.4, we see that during the 1980s the United States and the rest of the world each contributed in the range of 10 to 20 new futures contracts per year. However, once we move into the 1990s, the U.S. average contribution was around 20 per year, whereas the rest of the world contributed something closer to 30 new contracts per year. However, once we approach 2000, the level of innovation in the rest of the world, at least episodically, peaked at 70 and 80 contracts in a single year, whereas the United States peaked at 120 contracts in 2005.
 |
| Figure 8.8 Source: FIA International Volume Reports. |
The fact that the rest of the world began increasing its rate of product innovation over a decade earlier than occurred in the United States is in part attributable to the fact that the rest of the world began to adopt some of the big changes a decade earlier than the United States did. Virtually all the new exchanges built worldwide since 1990 were electronic, whereas most of the U.S. exchanges were still stuck in a floor-based system until around 2003. In addition, the U.S. exchanges remained not-for-profit and member owned until the early 2000s, whereas a number of exchanges worldwide were actually created as stockholder-owned, for-profit entities. One final dimension is that, as mentioned earlier, the United States did experience a significant regulatory change in 2000, making it much easier to create and launch new futures contracts. So the combination of the late move into demutualization and screen-based trading, combined with regulatory liberalization, accounts for the more dramatic increase in product innovation that we see in U.S. derivatives.
A Note on Innovations in Equities
We have spent much more time on derivatives because that is where the real innovation has taken place. But let's take a quick look at the equity exchanges. By far the most innovative part of the equity world is the continual development of exchange-traded funds (ETFs). ETFs are baskets of something, usually stocks, that are similar to mutual funds but that trade continuously on exchanges. They are superior to mutual funds in that they can be traded at any time exchanges are open, can be sold short, and have certain tax advantages (at least in the United States) compared to mutual funds. The first successful ETF was launched on the Toronto Stock Exchange in 1990. Three years later, in 1993, the American Stock Exchange listed the first U.S. ETF, called Spiders, or SPDRs, short for Standard and Poor Depository Receipt. It represented a basket of all the shares in the S&P 500 and was designed by Nathan Most, a 73-year-old employee of the American Stock Exchange. The American Stock Exchange became the real early innovator of exchange-traded funds, though today there are more ETFs listed on the NYSE.
From their original launch in the 1990s, ETFs have grown in number, in diversity, in total assets under management, and in geographical reach. As of the end of 2007 there were, coincidentally, 2007 ETFs worldwide (see Table 8.3). Even though ETFs started in the Americas, Europe has more than caught up and has a commanding lead with a 45% share. The United States is second with 31%, but the product has done less well in Asia, which has only 5% of all ETFs listed. And the 177% growth in the worldwide number of ETFs in a single year, 2006 to 2007, is astounding. Figure 8.9 makes it clear that ETFs were growing slowly in 2003 and 2004 but then took off with growth rates of 40–80% since then. This is consistent with the argument that the lower cost of listing resulting from the shift to electronic markets results in more listings.
| *2007 share of global market in number of ETFs. | ||||
| Source: Calculated from World Federation of Exchanges data. | ||||
| 2006 | 2007 | Change (%) | Market Share (%) * | |
|---|---|---|---|---|
| United States | 340 | 641 | 189 | 32 |
| Other Americas | 95 | 175 | 184 | 9 |
| Asia/Pacific | 75 | 108 | 144 | 5 |
| Europe | 509 | 898 | 176 | 45 |
| Middle East | 106 | 172 | 162 | 9 |
| Africa | 9 | 13 | 144 | 1 |
| Total world | 1134 | 2007 | 177 | 100 |
 |
| Figure 8.9 Source: Data from World Federation of Exchange. |
The largest of the sponsors of these funds is Barclays Global Investment, which, as of the summer of 2008, had 159 different ETFs available. Along with the normal stock indexes, Barclays has ETFs or ETNs that cover grains, metals (including specific metals such as gold, silver, copper, and nickel), livestock, natural gas, and 22 specific country funds (including Brazil, Malaysia, Mexico, and Taiwan). The oldest sponsor of ETFs is the State Street Global advisors, which has the oldest ETF, the SPDR, still the biggest ETF in existence, with assets of about $77 billion during the summer of 2008. There are also leveraged ETFs. For example, Rydex has a fund called 2X S&P 500 and another called Inverse 2X S&P 500, which represents a short position in the S&P 500.
Conclusion
Even though futures contracts have been around for over 150 years, it is clear that we have entered a sort of golden age of product innovation. The pace of innovation has increased substantially beyond what it was in the recent past. This increase has been driven by two factors. First is the shift from floors to screens, which has significantly lowered the cost of adding products to the exchanges’ portfolios. The second is the new ease with which new products can be created following the 2002 enactment of the Commodity Futures Modernization Act.
Equity exchanges have been traditionally a little less innovative than the derivatives exchanges. It doesn't take a lot of thought to simply add new stocks for trading on a stock exchange. The one area in which stock exchanges have stood out has been the area of EFTs. There has been a huge increase in the number, the diversity, and the geographical spread of these new products; the number of new ETFs increased 177% in a single year. But though the pace of innovation has accelerated, the success of these new products is something that remains to be seen. There are wonderful new creations of hurricane futures, credit default swap futures, and catastrophe insurance futures, but none has gained any real traction.
At some point, the Ph.D. economists who sit in the research departments of the exchanges will simply run out of new ideas. There are only so many different spread relationships among energy prices in different parts of the United States. Once those are all listed, and most of them don't trade very much anyway, what does NYMEX have left to do? With the increase in the number of new contracts launched every year, there has been a similar increase in the percentage of contracts that have zero trading five years after launch. With a lower cost of listing, more failures can be tolerated, but at some point, this frenzied pace of innovation will lock horns with the reality that the number of traders interested in increasingly obscure products will fall, and the pace will slow considerably. And with the loss of many trading jobs associated with the financial crisis that took hold in 2007 and 2008, that time could be sooner rather than later.
..................Content has been hidden....................
You can't read the all page of ebook, please click here login for view all page.