
7. Smaller to Larger: Through Organic Growth and M&A
Exchanges have gotten larger. The driver is a hugely compelling need to move down the steeply declining average cost curve that now exists for exchanges because of the shift to screens. Only by continuing to reduce the average cost of a trade can exchanges remain competitive. Exchanges can grow in two ways: (1) organically, by attracting more trading in existing products and developing attractive new products, or (2) acquiring or merging with other exchanges. Even before electronic exchanges, there were mergers, usually cases of healthy exchanges taking over struggling exchanges, sometimes with the participation of the government. But the pace of M&A has accelerated as exchanges have become electronic. We explore a number of case studies of both the old and new era M&A activity.
In this chapter we explore the last of the four basic transformations of the exchanges: the growth from smaller to larger. Exchanges, like other organizations in capitalist economies, want to grow and prosper. This is true whether the exchange is owned by its members and it wants to grow to increase member opportunity or if it is stockholder-owned and it wants to grow to create opportunity for its stockholders. Members are pleased if they have greater market-making or brokerage opportunities or if their seat values increase. Stockholders are pleased if growth drives up the value of either their stocks, dividends, or both.
Organic Growth: New Contracts
Given that growth is a beneficial thing, how does an exchange go about doing it? Over the years, most exchanges have grown organically, that is via the creation of new products and the search for new customers for existing products. This is in contrast to growth via mergers and acquisitions, to which we will turn shortly. Let's first look at the derivatives exchanges. In 1955, there were precisely 61 different futures contracts listed for trading on U.S. futures exchanges and a lesser number elsewhere in the world, mainly in Japan. In Table 7.1 and Table 7.2, we have listed the top 20 derivatives contracts traded globally in 1955 and then 52 years later, in 2007.
A comparison of these two charts makes it clear that organic growth, via new product development and expansion of demand for existing products, has been a major feature of the global derivatives market. Specifically,
• Product innovation over the 52-year period had been sufficiently strong that not one single contract that was in the top 20 list in 1955 was still in the top 20 list in 2007. And none of the top 20 contracts of 2007 even existed in 1955.
• The number-one derivatives contract in 1955 was the Chicago Board of Trade soybean contract, with an annual turnover or volume of 849,000 contracts. The number-one derivatives contract in 2007 was the Korea Exchange's KOSPI 200 option contract, with a turnover of 2.6 billion contracts, about 3000 times as large.
• The total turnover of the top 20 contracts in 1955 was 6 million. The turnover in 2007 was 7.3 billion, about 1000 times as large.
• Though not portrayed in the two charts, if we compare the volume of the top three CBOT contracts in 1955 to their volume in 2008, we find: 1
• Soybean volume was 46 times greater in 2008.
• Wheat volume was 32 times greater in 2008.
• Corn volume was 136 times greater in 2008.
Comparing the Top 20 Contracts in 1955 with the Top 20 in 2007
• Japan dominated half of the top 20 list in 1955 but was totally absent in 2007.
• Every single contract in 1955 was a physical commodity contract, whereas by 2007 the top 19 were all financial (10 interest rate, 9 equity index), with crude oil in 20th place.
• Cotton was still such a sufficiently important product in 1955 that four (20%) of the top 20 contracts were related to cotton (raw cotton in the United States and cotton thread in Japan).
• Though the top 20 contracts of 1955 represented only two countries, the United States and Japan, the 2007 top 20 list was much more diverse, including contracts from Korea, the United States, Germany, Brazil, the United Kingdom (or Paris, if you consider the headquarters of Euronext), Mexico, and India.
• Six (30%) of the top 20 contracts in 2007 were options contracts, whereas options did not make the 1955 list, because stock and futures exchanges had not yet begun to list options. The world's first stand-alone options exchange was the Chicago Board Options Exchange in 1973.
• The Chicago Board of Trade, for many years considered the global king of futures trading, appeared five times in 1955 but only once in 2007. Only its 10-year Treasury Note contract was big enough to make the list, and because it had been acquired by the CME in the summer of 2007, it appears only as a division of the CME Group.
• The CME has five of the top 20 contracts in 2007 but appeared only twice in the earlier 1955 list, for eggs and onions, both of which had vanished by 2007. The egg industry changed in such a way that production seasonality and storage disappeared, and without inventories of eggs, there was no longer much need to manage risk with egg futures, so they just slowly faded away. The CME onion contract was actually banned by Congress in 1958 and is the only U.S. contract to ever have been banned by the federal government.
• Representing a trend toward consolidation and concentration, the top 20 contracts in 2005 were distributed among 12 exchanges, whereas the top 20 contracts in 2007 were distributed among only nine exchanges—25% fewer.
So, starting with these 61 contracts that existed in 1955, over the next 50 years another 842 futures contracts were added in the United States. That's about 17 new contracts a year. Outside the United States, the pace was even faster, since during the shorter 25-year period from 1980 to 2005, international exchanges created 887 new futures contracts, or about 35 new futures contracts per year. Over half of these contracts (both U.S. and global) died within a few years, but some of the surviving ones contributed significantly to the growth of the world's futures exchanges. In the United States, the contracts driving exchange growth were mostly launched in the 1980s (e.g., Eurodollars in 1981 and the S&P 5002 in 1982, both at the CME).
In the rest of the world, where exchanges were created more recently, the blockbuster contracts that contributed significantly to the growth of these exchanges were created in the late 1990s and into the new millennium. For example, the one-day interest rate contract at the Brazilian BM&F accounts for 55% of all futures trading at the giant exchange, yet was started only in 2004 (see Table 7.3). Or at the extreme case, the dollar/peso contract traded at ROFEX in Rosario, Argentina, represents 99% of all trading volume on the exchange, yet the contract was started as recently as 2002. In Japan, at the Osaka Securities Exchange, which has been in the derivatives business since 1987, its largest contract is the Nikkei 225 Mini, which started in 2006. So the strategy of organic growth from product innovation has been quite important.
Global data on the equity exchanges is not readily available as far back as the derivatives data, but according to the records kept by the World Federation of Exchanges, the value of global share trading increased from $9.7 trillion in 1994 to $200.8 trillion in 2007. 3 This 1970% increase in trading value was attributable mainly to more trading in existing products, since the number of listed companies increased only 37% over that same period, from 30,186 listed companies in 1994 to 41,351 listed companies in 2007. So again there was a significant amount of organic growth among stock exchanges, but little of it came from a net increase in company listings. As discussed in the later chapter on product innovation, stock exchanges in some countries have benefited from the recent rapid growth in the number of, and trading in, exchange-traded funds (ETFs).
Organic Growth: New Users
In other cases, the exchanges have grown significantly from either the entry of new users or the growth of one of those groups of users. For example, the CME's Eurodollar contract has benefited greatly from the rapid and sustained growth of the interest rate swaps market. Swaps dealers entering into agreements to swap fixed for floating interest rate payments (or vice versa) would hedge their net risk in Eurodollar futures. In the case of energy derivatives, the rise of energy merchandisers and marketers in the 1990s has significantly driven increased volumes in crude oil and natural gas. And of course the rise of managed futures and hedge funds, which often make extensive use of derivative markets, has contributed significantly to increased volumes at many different exchanges.
One other serendipitous source of volume gains, at least at those exchanges that are or have become electronic, is the rise of algorithmic trading. 4 Algorithmic traders are often making tens or even hundreds of trades per second and contributing significantly to volume growth at exchanges. And whether they utilize algorithmic trading systems or are staffed by somewhat old-fashioned point-and-click electronic traders, proprietary trading shops have popped up in a number of places and also have contributed to volume growth. Of course, electronic markets, especially those with direct access, make these markets accessible to anyone with a computer and money to trade and should significantly expand the customer base in the future.
There are limits to what organic growth can do for an exchange. We have established that exchanges worldwide have added many new futures contracts over the past few decades. We also noted that most of these contracts are simply not successful. In countries where derivatives markets are newer, there have been some recent contributors to significant volume growth, as pointed out earlier. But in the more mature markets, it is much more difficult to do this. First, in mature markets, the best fruit has been picked long back. The blockbuster contracts were those that were created in the 1970s or 1980s (thus most of the trading volume at the CME comes from contracts created in 1981 and 1982). So it is difficult today to find brand-new ideas that translate into futures contracts with high volumes. Attempts to create clones of successful contracts at other exchanges generally do not work either, because of the liquidity-driven monopoly problem. What this means is that once an exchange has established a reasonable degree of liquidity, typically with a relatively large number of buyers and sellers who are always ready to deal and therefore create relatively tight bid-ask spreads, no one will trade the same product at a new exchange that decides to list it, because there are few buyers and sellers to trade with. So attempts to establish clones of successful contracts usually fail. This results in a monopoly in that product for the exchange that lists first and develops a reasonable degree of liquidity.
There may be more room at newer international exchanges to grow organically. As shown in Table 7.3, the top products at these exchanges were typically started much more recently; the average age of the blockbuster contracts is about 10 years. In China, the top product is soybeans because the government has not, as of late 2008, given the go-ahead for the new financial exchange to start trading. Once it does, there will be a huge opportunity for growth in financial products, and it will be only a few years before the top product is a stock index or government bond rate rather than soybeans. Note also that the top product on average accounts for over half of total exchange volume in these markets. But this is not much different than the United States. Before the mergers with the CBOT and NYMEX, the CME's top product, Eurodollars, accounted for about half of total volume, and the top two, Eurodollars and the E-Mini S&P 500, accounted for about 75% of total CME volume. One does worry a bit, however, about MexDer (Mexico) and ROFEX (Argentina), where a single product accounts for 93–99% of total volume.
Growth via Mergers and Acquisitions
We started this chapter by saying that there were two ways for an exchange to grow. The first was to grow organically by either adding new products or adding customers to existing contracts. The second way to grow is to add products to an exchange's portfolio by simply buying those products indirectly through the purchase of another exchange that has contracts that are different from those at the acquiring exchange. And different exchanges almost always have different products because the liquidity-driven monopoly tendency leaves most exchanges with a unique set of products. For example, when the CME and CBOT merged in the summer of 2007, there was not a single duplicate active contract between the two exchanges. Not a single one of the CME's 88 contracts was actively traded at the CBOT. So the CME acquired a solid set of new product lines in this acquisition, including futures and options on U.S. Treasuries and grains. Likewise, when the CME bought NYMEX, it acquired new product lines in derivatives on energy and metals.
Though there have been mergers throughout the history of futures and stock exchanges, they were relatively rare. The CME, for example, experienced spectacular growth until 2007 based only on creating new futures and options contracts and developing their customer base, without ever participating in a merger. The CBOT, during its almost 150-year history, has absorbed only two other exchanges, both incredibly tiny. 5 The Kansas City Board of Trade and the Minneapolis Grain Exchange have had long histories without any merger or acquisition. On the stock side, the New York Stock Exchange and the London Stock Exchange trace their histories back over 200 and 300 years, respectively, but neither participated in a merger till 2005 (NYSE with Archipelago) and 2007 (LSE with Borsa Italiana). There have, of course, been mergers of exchanges, especially when one of the two exchanges is beginning to have trouble surviving on its own and needs to be folded into another exchange to consolidate the administration of the two.
There was an earlier wave of exchange consolidation driven by the first round of technological change in communications—the telegraph, ticker tape, and telephone. 6 Before the development of these early communications devices, exchanges were established in multiple commercial centers throughout a number of countries. For example, the United States once had 250 different stock exchanges. India had 23. England had 20. Information had to be delivered by foot or horseback, so every significant urban center needed its own market. With the development of the telegraph, the telephone, and the ticker tape, it became much easier to both know the almost real-time prices at distant exchanges and to trade on those exchanges. So distance began to matter much less, and traders began to seek out the exchanges with the greatest liquidity for the stocks in which they were interested. This resulted in a tendency toward consolidation and the elimination of duplicate products at multiple exchanges spread all over the country. Of course, the regional exchanges that went into decline would sometimes fight the trend by getting the state to intervene. For example, there was a rule in India that required each company to list itself on the exchange closest to its headquarters, even if it was listed on the country's major exchange at the time, the Bombay Stock Exchange. So firms based in Calcutta (today called Kolkata) would generally list at the BSE but would be required to also list and pay listing fees to the Calcutta Stock Exchange. After the screen-based National Stock Exchange (NSE) was created in 1994 and the BSE shifted from floor to screen to survive, virtually all trading shifted to the NSE and BSE, and the 20 or so regional exchanges were left with no trading activity, though they still earned listing fees because of this rule. The rule was finally dropped early in the new millennium, and then the regional exchanges really did die. 7
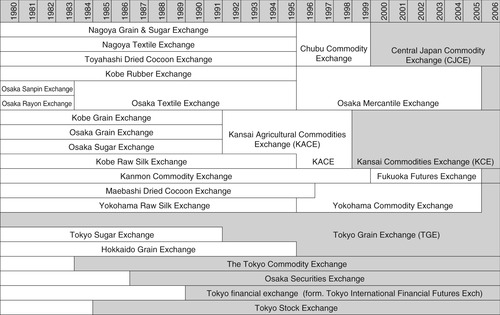
Though the Indian consolidation took place with very little merger activity, the case has been just the opposite in Japan. In fact, we know of no country in which there was such a rapid period of consolidation as there was in Japan during the 1990s and early 2000s (see Figure 7.1). Japan has long had a large number of physical commodity exchanges in commercial centers of various sizes spread throughout the country. 8 In 1991 there were 17 Japanese derivatives exchanges based on physical commodities. By 2007 those 17 exchanges had been consolidated into four, a 75% reduction in the number of physical commodity exchanges. For example, the Tokyo Grain Exchange had absorbed three other exchanges: the Tokyo Sugar Exchange, the Hokkaido Grain Exchange, and the Yokohama Commodity Exchange. The Kansai Commodities Exchange had absorbed five exchanges: the Kobe Grain Exchange, the Kobe Raw Silk Exchange, the Osaka Grain Exchange, the Osaka Sugar Exchange, and the Fukuoka Futures Exchange. And in the largest consolidation, the Central Japan Commodity Exchange had absorbed six other exchanges: the Nagoya Grain and Sugar Exchange, the Nagoya Textile Exchange, the Toyahashi Dried Cocoon Exchange, the Kobe Rubber Exchange, the Osaka Sanpin Exchange, and the Osaka Rayon Exchange. 9 In fact, by the end of these 21 mergers, only one old exchange name survived from the 1980s and that is the Tokyo Grain Exchange.
What drove the consolidation was the fact that some of the more regional exchanges simply could not compete with the larger, more liquid exchanges in Tokyo and Osaka and thus were not able to continue to operate a viable business. These Japanese mergers often involved government coaxing and were a mix of government guidance and exchange strategy. Remember, these exchanges are still member owned, so mergers are a bit more complicated. So it was the Ministry of Agriculture, Forestry, and Fisheries (MAFF) that recommended that the Tokyo Sugar Exchange merge into the Tokyo Grain Exchange. However, the Yokahama Commodity Exchange found itself in a very difficult financial situation and requested that the TGE take them over. 10
The consolidation in Japan was driven by changes in technology—specifically, falling communication costs, as mentioned earlier—and it involved weaker exchanges that were losing volume being taken over by stronger exchanges that were gaining volume. And this was the way things went worldwide. For example, in 1979 the Cocoa Exchange in New York had been for a decade shrinking about 3% per year, while the Coffee and Sugar Exchange had been expanding 8% per year. In a very logical move, the much stronger and more rapidly growing Coffee and Sugar Exchange took over the Cocoa Exchange to become the Coffee, Sugar, and Cocoa Exchange. 11
This principle of a dynamic, growing exchange absorbing an exchange in decline was played out in an important U.S. merger that took place before the exchanges began to switch to screens and become public companies, and it illustrates the difficulty of executing a merger between two member-owned exchanges. Until its merger with the CME in 2008, which is part of the new age of exchange mergers, NYMEX had experienced a single merger, the one with COMEX in 1994. The NYMEX and COMEX merger is a great example of how difficult it can be to execute a merger between two not-for-profit, member-owned exchanges. For years, the two exchanges had talked about the possibility of merging. In the autumn of 1987, consulting company Arthur D. Little, Inc., recommended that the two exchanges merge their boards, their administrative staffs, and their clearing mechanisms. COMEX officials had supported the merger for some time, but it now appeared that NYMEX officials were also ready to buy into the Arthur D. Little recommendations. So it was not surprising that in the summer of 1988 industry publication headlines trumpeted, “New York exchanges edge towards merger” and reported that NYMEX officials had finally reached a decision to go ahead with a merger plan. 12 Two weeks later, the merger was off, supposedly because of pushback from NYMEX members. Feelings and rivalries between exchange memberships run deep, and the summer 1988 merger of COMEX and NYMEX proved to be just another false alarm. Then in early 1990, the two exchanges announced that they were exploring a merger and that they would form a joint governing board that would oversee any merged exchange. 13 After a year of discussion, on February 19, 1991, COMEX announced that it had rejected a NYMEX proposal and NYMEX announced, “Having reconciled all differences over material terms, including a generous offer to allow trading privileges, we are saddened by the failure of our colleagues to accept the proposal.”14
Finally, three years later, in the spring of 1994, came the real deal. The two exchanges announced that they were, in fact, going to finally merge. On the evening of April 25, 1994, the members of the two exchanges had an opportunity to cast their votes. The NYMEX required a simple majority vote to pass the resolution and 83% of the members voted in favor of the merger. COMEX had a stricter standard, requiring a two thirds majority. They barely made it, with 72% of the COMEX members voting yes.
Why were so many COMEX members still opposed? What is important to understand is that COMEX had once been the big exchange based largely on gold trading and NYMEX the much smaller one. As gold fell out of favor and investors turned to other assets (such as U.S. Treasury securities) as a safe haven in uncertain times, and as the importance of crude oil increased, not only were there the normal jealousies over losing rank, but COMEX members began to worry about their future. Seat prices are a good measure of the health of an exchange. The COMEX seat price, which had been $325,000 in 1974, had fallen by two thirds, to $100,000, shortly before the 1994 vote. This was the result of falling volume and revenues, including a 1992 volume drop of 27% and a net revenue decline of 80%.
But in the months leading up to the vote, volume and revenue began to increase. So, the Exchange's improving fortunes made many COMEX members feel that they no longer needed to merge with the larger NYMEX to have a viable exchange. Right before the vote, COMEX members began circulating letters among themselves arguing that the proposed NYMEX payment was too small and the loss of control was too great. In fact, one COMEX director wrote that “the merger will transform COMEX into an essentially colonial backwater of NYMEX.”15 On March 1, one group of COMEX members took the legal route and sued both NYMEX and COMEX in a class action suit to block the proposed merger. But when the vote finally came on April 25, 1994, 72% of the members, 5 percentage points above the required 67%, was enough to approve the merger. On July 22, 1994, the CFTC gave its approval, and the merger became a reality. The deal itself made COMEX a wholly owned subsidiary of NYMEX and gave COMEX members $62 million—$42 million at the close of the deal and $20 million spread over the next four years. It should be noted that in contrast to the mergers of the new millennium, this was not a full merger, since each market retained its own memberships and trading rights.
The only U.S. exchange that is the result of multiple mergers involving a number of exchanges is the New York Board of Trade (NYBOT), which in 1997 was purchased by ICE and recently renamed ICE Futures US. The final merger to form NYBOT involved combining the New York Cotton Exchange (NYCE) with the Coffee, Sugar, and Cocoa Exchange (CSCE) in 1998. But the NYCE had already acquired the almost dormant New York Futures Exchange from the NYSE in 1995. And the CSCE was itself a 1979 merger of the Coffee and Sugar Exchange and the Cocoa exchange. The roots of these components go back to 1870 for the NY Cotton Exchange, 1882 for the Coffee Exchange (renamed the Coffee and Sugar Exchange in 1916), and 1925 for the NY Cocoa Exchange.
From Coffee to NYBOT to ICE Futures
1870New York Cotton Exchange founded
1882Coffee Exchange founded
1914Coffee Exchange adds Sugar as new product
1916Name changed to New York Coffee and Sugar Exchange
1925New York Cocoa Exchange founded
1979New York Futures Exchange founded (NYSE subsidiary)
1979NY Cocoa merges with NY Coffee and Sugar to create New York Coffee, Sugar, & Cocoa Exchange
1985New York Cotton Exchange creates its FINEX division to list currencies
1995New York Cotton Exchange acquires New York Futures Exchange
1998New York Cotton Exchange merges with New York Coffee, Sugar, & Cocoa Exchange to create the New York Board of Trade (NYBOT)
2007Intercontinental Exchange (ICE) buys NYBOT for $1 billion ($400 million cash plus rest in ICE shares) and renames exchange ICE Futures US
The New Era of Exchange M&A
Beginning in the new millennium, M&A activity no longer was something that occurred occasionally because there was a weak exchange that needed to be acquired by a stronger exchange; it occurred out of necessity, because of the fundamental transformation of exchanges away from floors and onto screens. When exchanges became electronic, economic cost curves shifted, and there were very, very strong economies of scale to be gained from processing an increasingly greater number of trades on an exchange. In a floor-based world, adding new products involved incurring significant costs to earn the new revenues that would accrue from increased trading. New floor space had to be found to build the pits for the new contracts, and new bodies had to be put into those pits to make markets and trade. In a screen-based environment, all one needed was more server space to match orders and disseminate prices for the new contracts.
So, exchanges that could expand trading in their existing contracts or could add product lines (whether by launching new products or acquiring them via an acquisition) would significantly lower their average costs per contract traded and therefore increase their profits. Electronic exchanges left behind with a small number of products and a small level of trading activity would experience much higher average costs per contract traded and much poorer profits. To survive and prosper, exchanges had to get bigger by increasing the number of contracts traded on their electronic platforms. This need to get larger resulted in a frantic quest to merge with other exchanges.
This significant ramping up of the economies of scale factor created by the shift to screens drove exchanges to want to merge, but it was another transformation we’ve discussed that made it easier for them to merge. That of course was the shift from private clubs to public companies. To create a merger between two public companies, you have to convince the shareholders that it's a good idea. For many public companies, a large number of shareholders hold small ownership positions in the company, and these shareholders rarely get in the way of a merger proposed by management and the Board. Even the large shareholders generally view their stock as a financial asset, and they are looking for a good return on their investment. So when a merger makes sense, shareholders rarely get in the way. Not-for-profit member-owned exchanges are a different animal altogether. Exchange members often have a strong emotional view of their exchange, and their exchange membership generally represents a much larger part of their net worth than does a stockholder's shares in any given company. The exchange is the place they go to work every day. They have a bond with other exchange members, not dissimilar to the bonds shared among classmates at the same high school or college. For exchanges in the same city (like the CME and CBOT, or the NYMEX and COMEX), there are often rivalries, as there would be between two football teams. So when members are making a decision regarding whether to merge with another exchange, especially a cross-town rival, it is not a cold, steely-eyed business decision but instead one infused with a significant degree of emotion.
In addition, though there are clear rules for managing mergers and acquisitions among public companies, this is much less the case for nonprofit, member-owned institutions. So it should have been no surprise that the merger between the two not-for-profit exchanges, COMEX and NYMEX, took over six years of on and off and on again negotiations, whereas the CME/CBOT merger of two publicly traded companies took less than two years. 16
Once an exchange becomes screen-based, it has a strong need to merge to lower average costs and pump up profits, and if it also becomes a publicly traded company it becomes much easier to merge and it almost has to engage in the merger game. Let's take a look at a few mergers that have been part of this new age of exchange M&A. The first is the story of two mergers entered into by the New York Stock Exchange. The first merger, with Archipelago, actually brought the NYSE into the modern era of electronic, publicly traded exchanges. The second merger, with Euronext, was a new age merger, with the special characteristic that it was the first trans-Atlantic exchange merger.
The Merger-Driven Transformation of the NYSE
The NYSE has done a lot of things in its 200-plus-year history. It has created stock indexes, listed ADRs, listed ETFs, opened the trading floor to women in 1943 and to foreign brokers in 1977, but never in its history until 2006 did it participate in a merger. It has now done three mergers, and it is the first two of these three mergers that have completely transformed the exchange and clearly set its path for the future. The three mergers were with an important electronic equities market, called Archipelago, with the pan-European stock exchange called Euronext, and with the NYSE's 150-year-old rival, the American Stock Exchange. We discuss each of these mergers in turn.
The first merger was the NYSE's merger with a Chicago-based electronic exchange called Archipelago. It was this merger that gave the NYSE a solid electronic matching engine, and because Archipelago was already a listed company, it gave the NYSE a listing.
After considerable negotiation and discussion, on April 20, 2005, the NYSE and Archipelago Exchange announced that their boards had approved a definitive merger agreement that would lead to the creation of a new publicly held company called NYSE Group Inc. It was noted that if the agreement was consummated, it would result in the world's largest-ever merger between two securities exchanges. The deal still had to be approved by the members of the NYSE, because the NYSE was still a member-owned entity, and the shareholders of Archipelago, because Archipelago was a publicly traded company. It also, of course, required the approval of the SEC.
The votes were no problem, since the members knew that the NYSE needed to become electronic to compete, and neither was the SEC approval, though it took seven months to obtain the latter. The approval came on November 3, 2005, and on that day the two exchanges announced that the NYSE members and the Archipelago stockholders would be voting on the merger approximately one month later, on December 6. The NYSE rules required that the merger be approved by two thirds of the votes cast by a quorum of NYSE members. The NYSE had 1366 members. Over 90% of those members participated in the vote, and over 95% of the members voting approved the merger. This was nothing like the merger of NYMEX and COMEX back in the mid-1990s, when the votes were much closer. However, not everyone was happy with the merger.
On May 9, William Higgins, an NYSE member for many years, filed a class-action suit against the NYSE directors, trying to stop the merger between the two exchanges on the terms that had been agreed to. Mr. Higgins argued that the NYSE members were being sold short. And though he was not against the merger per se, he felt that it should not go forward under current terms. For one thing, he argued that it made no sense that the proposed merger was valuing the NYSE at less than $3 billion, whereas the Chicago Mercantile Exchange was at the time valued at $7 billion. The lawsuit pointed out that an exchange expert, Benn Steil of the Council on Foreign Relations, had written that the NYSE seat holders should receive as much as 90% of the combined company, not the 70% contained in the current merger agreement. It further argued that though the majority of Archipelago shareholders were free to immediately sell the shares they received in the new merged entity, NYSE members who received such shares were subject to sale restrictions of up to five years. Finally, the suit complained that under the terms of the merger agreement, the NYSE could retain up to 5% of the shares in the company and allocate them to NYSE executive employees who structured the merger agreement. 17
Whether it paid too much or just the right amount, this first merger made the NYSE into a for-profit, stockholder-owned, publicly listed exchange with serious screen-based capabilities and thus brought it into the new emerging model for exchanges. It was the second merger that made the NYSE truly international and gave it a serious stake in derivatives. In fact, this second merger between the largest U.S. stock exchange and the second largest European stock exchange was the most significant merger of exchanges that has taken place in recent times. The merger between the NYSE and Euronext was significant because it represented not only a merger of two exchanges in different countries but also two exchanges on different continents. It was also the largest merger in value terms of two exchanges to date.
In promoting the merger, NYSE CEO John Thain promised $375 million in merger benefits, $275 million of which came from reduced costs, especially in technology, because the plan was to reduce the number of trading systems at the exchanges from the current six platforms down to two platforms. 18
In the deal itself, NYSE had to beat out Deutsche Börse, and it did so by offering $10.2 billion in cash and shares. This took place on May 22, 2006. Even though the German exchange came back the next day with a higher bid, Euronext still took the NYSE Group's offer and struck a deal, subject of course to the vote of shareholders and the approval of regulators on both sides of the Atlantic. The European regulators approved the merger on December 5, 2006, causing the Euronext share price to rise 3%. The SEC approval came shortly thereafter. This paved the way for the shareholder votes, which took place on December 19, 2006, for Euronext shareholders and December 20, 2006, for NYSE shareholders. Both groups enthusiastically approved the merger. Ultimately, the deal was valued at $14.2 billion, and Euronext shareholders received .98 shares in the new merged company's stock plus $21.32 cash for each Euronext share.
Before the merger with Euronext, the NYSE Group Inc. operated two separate securities exchanges. One of them was the traditional New York Stock Exchange. The second was NYSE Arca, the electronic exchange that the NYSE had earlier acquired. In addition to the exchange listed securities, NYSE Arca listed exchange-traded funds and stock options. At the time of the merger, both NYSE and Euronext were publicly traded, for-profit companies. The new company became effective and began trading on April 4, 2007, and was listed on both the exchanges. So it began trading in Paris at 9:00 a.m. Paris time and in New York at 9:30 a.m. New York time.
The third merger, with the NYSE's 166-year-old rival, the American Stock Exchange (AMEX), was really a combination of the old type of merger and the new type. It was an old-type merger in the sense that it involved a stronger dynamic exchange merging with one that was considerably weaker and in some degree of decline. The AMEX had historically been a much stronger innovator than the NYSE. It was the AMEX that had pioneered the U.S. listing of exchange-traded funds (ETFs) in 1993 with the S&P 500-based SPDR ETF. However, due to its tiny size, representing only about 1% of all U.S. equity trading, the AMEX was unable to consolidate its leading ETF position, and in recent years, even though it held the lead in the number of ETFs listed, it had fallen behind the NYSE in terms of the value of turnover in ETFs.
The merger was a classic new-age merger in the sense that it took advantage of the huge economies of scale of NYSE ARCA, the electronic trading engine on the U.S. side of the NYSE Euronext family. By transferring the 381 ETFs that were traded on the AMEX floor to trade alongside the 240 ETFs that were already being traded on the NYSE Arca platform, the NYSE was able to significantly reduce the cost per trade on NYSE Arca. At the same time, this move converted the ETF business in the United States from something like a duopoly to something more like a monopoly. After the merger, NYSE Arca had 96% of the ETFs listed in the United States. The only other ETFs traded in the United States were the 25 at the Nasdaq and one at the CBOE.
There was little trouble getting the merger passed by either the NYSE shareholders or the AMEX members. On June 17, 2008, the members of the AMEX voted 695 to seven in favor of being acquired by the NYSE Euronext. Since not everyone voted, the 695 voting in favor of the merger represented 84% of the total memberships outstanding at the AMEX. 19 What the deal meant financially was that the AMEX would receive $260 million in NYSE Euronext common stock and, following the expected sale of the old AMEX headquarters, members would receive additional NYSE Euronext stock equal in value to the net proceeds from that sale. 20
As this is written, there has been no public announcement as to how AMEX will be integrated into this increasingly big family of exchanges. It is clear that the AMEX ETFs are being shifted to NYSE Arca's electronic platform to join the ETFs that are already there. The AMEX options will move from the AMEX floor to either the NYSE floor or the Arca Options floor in San Francisco. And it is likely that the listed AMEX stocks would go to a new AMEX-branded entity similar to the Alternext platform in Europe, which was created by Euronext for listing small and medium-sized companies that couldn't meet the listing standards of the five Euronext exchanges.
The structure of the exchange after the mergers looked something like Figure 7.2.

First, there are still two main subsidiaries, one in the United States and one in Europe. The two exchanges do have about 40 members in common, but there is not yet direct seamless access to all products for most investors, though the Exchange is working on a Common Customer Gateway. The chart shows four subsidiary entities to NYSE Group Inc. and six subsidiary groups to Euronext N.V. The NYSE is really the old New York Stock Exchange and includes the old floor as well as the new electronic bond platform. NYSE Arca is the electronic platform for NYSE listed stocks and ETFs as well as AMEX and Nasdaq listed stocks and ETFs. NYSE Arca Options includes electronic and San Francisco floor-trading of all options. Finally, ArcaEdge is the platform for small, unlisted, OTC traded stocks.
On the European side there are the four underlying Euronext stock exchanges, in Amsterdam, Brussels, Paris, and Lisbon, and each of these exchanges lists both stocks and derivatives. Then there is the big London derivatives exchange called LIFFE (for London International Financial Futures Exchange), which is still the fourth largest derivatives exchange in the world (after the CME, the Korea Exchange, and Eurex). Finally, there is NYSE Alternext, which is a more lightly regulated trading platform for small and medium-sized companies from three Euronext countries—France, Belgium and the Netherlands.
The LSE: The Exchange That Couldn't Say Yes
It seemed like everybody wanted to buy the London Stock Exchange, the biggest stock exchange in Europe. The frantic pursuit of mergers was driven by the need to spread the relatively fixed costs of electronic trading over lots of transactions to get average costs down and profits up. The bigger the merger partner, the bigger the effect, especially if redundancies (in staff and facilities) can be quickly eliminated. Deutsche Börse was one of the first and went after the LSE in 2000. Private discussions had been going on for some time, but before the merger was publicly announced, the LSE got some egg on its face by accidentally faxing out the wrong document to the British media. The LSE had just hired a new chief executive, and they were set to send out a press release on the new guy. Someone grabbed the wrong document, a secret memo for dealing with the media should the German-British merger fail to become reality. Specifically, the plan called for LSE representatives to make “statesmen like expressions of regret,” should the merger discussions get derailed, but because the British press would be looking for someone to blame, the idea was to informally let the press know that the fault was that of the Germans because of their intransigence and lack of a shared vision with the LSE. 21 The LSE leaders were to come off looking appropriately patrician, while the Germans would take the heat.
Despite the gaffe the talks continued, and in fact, The Wall Street Journal ran a headline on May 1, 2000, which read, “UK, German exchanges likely to announce merger this week.” It would have created the single European stock market that many securities firms had called for since the creation of the Euro Zone, would have facilitated sector-based investing as opposed to country-based and would have been twice the size of Euronext. When the article was published, the Deutsche Börse Board had just met and approved the deal, and the LSE board was expected to do likewise, and then the shareholders of both exchanges would have to vote. The LSE board did approve the merger, and the shareholder votes were scheduled for September 14.
Then three weeks before the shareholder votes, OM Gruppen of Sweden approached the LSE about a friendly takeover, was rejected, and came back the following week with a hostile $1.19 billion takeover bid. A week and a half later, on September 12, 2000, the LSE decided that it needed to pull out of the merger discussions with Deutsche Börse so that it could focus on the defeat of the hostile bid from OM. The LSE was also getting pushback from a number of its members who felt the proposed merger with the Germans undervalued the LSE, would not achieve the savings promised, was too vague in parts, and involved management risk, given the management style of Deutsche Börse Chief Executive Weiner Seifert, who was slated to become chief executive of the merged organization. 22 The LSE also said that there were still too many issues raised by a cross-border consolidation that had not yet been resolved. 23 By November, the OM hostile bid had been defeated, but not before OM Chief Executive Per Larsson claimed that, “After the shambles of iX (the attempted merger with Deutsche Börse), the LSE is now trying to stake a claim to maximizing shareholder value: yet it is obvious that the LSE has no strategy, no management and no vision.”
But nobody was more persistent than Nasdaq Chief Executive Bob Greifeld. In 2002, Nasdaq attempted to purchase the LSE. One of the big concerns was whether the LSE could get a concession from the U.S. Securities and Exchange Commission that a merger with Nasdaq could be done without the SEC seeking to supervise the LSE part of the merged entity. The LSE did not want to be regulated by the SEC. 24 But the merger fell apart after regulators in the United States and the United Kingdom could not agree on precisely how they would oversee the combined market. Every merger involves some degree of regulatory risk, a risk that can be greater if the two entities have different regulators. Following that failed attempt, the LSE was pursued by both Deutsche Börse (again) in 2004 and Macquarie Bank, and both made offers and both were rejected by the LSE. Euronext attempted to merge with the LSE, but those talks failed as well and in 2006, the two failed suitors, Euronext and Deutsche Börse, began talking about hooking up with each other.
Then in March 2006, Nasdaq came back with a new £2.4 billion offer, which was again rejected by the LSE. Not taking no for an answer, Greifeld then embarked on a different path and began buying up shares from other large holders of LSE stock. On April 11, 2006, Nasdaq purchased all the stock held by the Ameriprise Financial's Threadneedle Asset Management unit, the LSE's largest shareholder. Threadneedle transferred its 35.4 million shares to Nasdaq for £11.75 per share. NASDAQ then purchased another 2.69 million LSE shares from an undisclosed seller, most likely the Scottish Widows fund. This increased Nasdaq's ownership stake in the LSE to 15%. Follow-on purchases pushed Nasdaq's share of LSE to 29%.
While rejecting all the publicly known suitors, the LSE likely held informal, private talks with others. One of those was Borsa Italiana, with which it held several talks during 2006, but as usual said it was not interested. Borsa Italiana, the Milan-based stock exchange, after being rejected by the LSE, began discussions with Deutsche Börse and Euronext regarding a three-way merger. The chief executive of Borsa Italiana was Massimo Capuano, a former senior partner to the giant consulting company McKinsey, and a man with a big vision. 25 He wanted to create a major pan-European exchange by merging Euronext, Deutsche Börse, and Borsa Italiana, and he wanted to block the transatlantic merger that was being discussed between Euronext and the NYSE. If he could put this deal together, he would have the largest stock exchange globally. In doing this he would be able to create a significant challenge to the current European giant, the London Stock Exchange. He certainly had political support in this effort from European leaders, who much preferred to see a pan-European stock exchange as opposed to a transatlantic one created with the Americans. However, Euronext went ahead with the merger with NYSE, and Deutsche Börse was never too interested in a merger in which they would not be the senior partner.
On June 22, 2007, the board of directors of Borsa Italiana approved a merger with the London Stock Exchange in which the LSE paid in stock worth £1.1 billion. The LSE has trading in more than 3000 companies; the Borsa Italiana has trading in 322, though it remains the fourth largest exchange in Europe based on trading volume. One of the things driving the LSE's interest in Borsa Italiana was its control of the European bond-trading platform (MTS). The LSE's chief executive, Clara Furse, will become chief executive of the merged entity; Borsa Italiana chief executive Massimo Capuano will be number two. The LSE will own 78% of the new company, and Borsa Italiana will hold the remaining 22%. 26 The shareholder votes were scheduled to take place July 8. One of the major obstacles to the merger was getting the support of Nasdaq, which had tried several times to buy the LSE and had accumulated a 29% stake by buying shares from other major stockholders. LSE executives feared that Nasdaq would try to block the deal. 27 After much internal deliberation, Nasdaq supported the deal, and when the votes came on August 8, almost 100% of the votes cast by shareholders in both exchanges said yes to the merger. 28
Nasdaq and the Scandinavians
Having both failed in their attempts to take over the London Stock exchange, Nasdaq and OMX began talks, and on May 25, 2007, Nasdaq agreed to buy OMX for $3.7 billion, which was a 19% premium to the closing price of OMX. The two sitting CEOs, Robert Greifeld at Nasdaq and Magnus Bocker at OMX, would respectively become CEO and president of the merged entity. Nothing during this frenzied M&A period was easy, so it should be no surprise that a competitive bidder entered the scene. Börse Dubai, the parent company for both the domestic and international exchanges in Dubai (the Dubai Financial Exchange and the Dubai International Financial Exchange, respectively), came in with a 10% higher bid of $4 billion. However, Nasdaq and Börse Dubai were introduced through a mutual acquaintance, met and talked, and found that their interests were complementary, not competitive. Nasdaq wanted OMX for the European access it provided; Börse Dubai wanted it for its technology. So they came up with a plan that gave them both what they wanted without having to engage in a bidding war. On September 20, 2007, Börse Dubai agreed to stop competing with Nasdaq over OMX, and both parties agreed to the following deal: 29
• Börse Dubai pays $4 billion cash to OMX stockholders for 97.2% of OMX shares.
• Börse Dubai gives the OMX shares to Nasdaq.
• Nasdaq, in exchange, gives 20% of the shares in the new entity Nasdaq OMX plus some cash to Börse Dubai (though Börse Dubai's voting rights are limited to 5%).
• Nasdaq becomes the principal strategic partner as well as a strategic shareholder in the Dubai International Financial Exchange (DIFX), which will be rebranded with the Nasdaq name and will use trading technology from both Nasdaq and OMX.
• Nasdaq sells Börse Dubai its 28% stake in the London Stock Exchange for $1.6 billion.
Dubai's huge presence in this deal shows how the Gulf States have moved quickly onto the exchange scene. Between Dubai's 27% stake and the Qatar Investment Authority's 20% stake in the LSE, Gulf States at that moment owned almost half the London Stock Exchange. However, once the merger took place, with the dilution caused by the 40% increase in the number of shares, the two holdings fell to 20% and 15%, respectively, giving the two Gulf States just over a third of the LSE.
Every exchange is looking for an edge. Nasdaq OMX Group positions itself as the largest global exchange company, the first one to actually have operations on six continents. Over 3900 companies in 39 countries listed are listed on Nasdaq OMX. One of the things that distinguishes the company on its OMX side is its long history of providing technical exchange services to exchanges all over the world. According to Nasdaq OMX it now provides technology to over 60 exchanges on six continents.
The CME and the CBOT
As far back as anyone can remember, there was a very strong, sometimes friendly, sometimes bitter rivalry between the two big Chicago exchanges. Their cultures were different. The CBOT was founded by Irish grain traders, and the CME was founded by Jewish butter and egg traders. The CBOT had always been the number-one exchange in Chicago, in the United States, and in the world. The CME had always been number two. People called it scrappy. It really did try harder. Both exchanges were highly successful and were able to develop benchmark, blockbuster contracts early on. The CME actually started the revolution in derivatives on financial products by launching a family of foreign exchange futures contracts back in 1972. A couple of years later, the CBOT launched the first interest rate futures contract in the form of a mortgage-backed security contract. However, its first interest rate contracts did poorly, and the CBOT went on to create the Treasury bond contract that became the anchor of a family of U.S. Treasury futures and options that drove the CBOT's growth. The CME went on in 1981 and 1982 to develop contracts in Eurodollar deposits and S&P stock indexes. These contracts and a few others allowed both exchanges to experience an incredible period of organic growth.
But the two exchanges were fiercely competitive. Whenever one of the two would start a new contract, the other exchange would start an identical or closely related copy of the first, though as we’ve explained earlier, only one of the two would succeed. Once back in the 1980s, both exchanges spent over $1 million each developing and promoting stock index products that were based on over-the-counter securities, even though both failed. The CBOT went so far during that campaign as to lease from the city of Chicago the lampposts in front of the CME and hung banners touting the CBOT's new product. But the exchanges could cooperate when necessary, most often when they were faced with a political threat from Washington, and occasionally they would cooperate on an administrative level; for example, at one point in the early 1990s, they created a joint CME-CBOT office in Tokyo as a way of keeping down the extraordinarily high costs of maintaining a presence in Japan. And though there were discussions from time to time about cooperation in clearing or even the possibility of merging, few believed that that could really ever happen.
Though there were many objective reasons for the CME and the CBOT to join forces, what really got the job done was the energy and trust between the chairmen of the two exchanges. CME Chairman Terry Duffy and CBOT Chairman Charlie Carey first met in 1983, when they were both trading in the hog pit at the CME. Over the years they remained friends, even as they rose in their respective organizations. During the phone call that changed everything in early August 2006, Charlie Carey had called Terry Duffy to discuss the renewal of the CME-CBOT clearing agreement under which the CME had cleared all CBOT contracts since 2003. Carey was the one who said, “It's time to look at the whole enchilada.”30 Over the next two months Duffy and Kerry, along with their senior staff, met many times; what kept the discussions on track and allowed this massive transaction to reach fruition was the innate trust that these two men had in one another.
When the two exchanges announced the merger agreement on October 17, 2006, they noted the following:
• CBOT members would receive the equivalent in shares of $151.28 per share for a total consideration of $8 billion.
• CME shareholders would end up owning at least 69% of the new merged entity, and CBOT shareholders would own up to 31% of the value of the new company.
• The composition of the board would be 20 directors from the CME and 9 directors from the CBOT.
• Exchange management would consist of Terry Duffy as chairman, Charles Carey as vice chairman, Craig Donohue as CEO, and Bernie Dan as special adviser.
• Chicago would again have the largest derivatives exchange in the world, a title held over the past decade by Eurex.
• Core trading rights of both the CME and CBOT members would be preserved.
• The combination of the two exchanges would create a more diversified entity than either of the two exchanges standing alone.
Despite the logic, the CME-CBOT merger was not going to be an easy thing. On March 15, the Intercontinental Exchange (ICE) made an unsolicited bid for the CBOT. According to the ICE CEO Jeffrey Sprecher, the value of races bid to the CBOT was $1 billion greater than that of the CME. In addition, he claimed that the CBOT would save a significant amount money by using the old NYBOT clearinghouse, which ICE obtained as a result of its acquisition of NYBOT. This offer took place approximately one month before the April 14 scheduled vote of CME and CBOT shareholders.
The first thing that the CME did was to schedule, one week after the ICE offer, a special meeting of the CBOT shareholders. The CME executives devoted the meeting to explaining why the ICE proposal was “significantly inferior … financially, strategically and operationally.”31
On June 14, the CME and CBOT revised the merger agreement to give extra benefits to CBOT shareholders. First, all CBOT shareholders will receive a one-time cash dividend of $9.14 per CBOT share, for a total of $485 million. The dividend would be declared before the close of the merger and would be paid immediately prior to the merger, after all merger conditions had been met.
On July 6, 2007, the CME and the CBOT announced that they had agreed to a revised definitive merger agreement, whereby the revision was to increase the number of CME Holdings shares that would be received by each CBOT shareholder. In the original agreement, each CBOT shareholder would receive .350 shares in CME holdings for each CBOT share. That number was increased to .375 shares of CME holdings for each CBOT share. The sweetened offer induced the CBOT's biggest shareholder, Caledonia, and investments PYT Ltd. to announce that it would endorse the revised merger agreement. 32 On July 9, 2007, the shareholders of both the CME and CBOT approved the merger of those two organizations. The CME was again the biggest exchange in the world.
The Future
Whether the exchange lists derivatives or stocks, screen-based trading by exchanges that had become public companies created a situation where every exchange had to get bigger to take advantage of the new screen-driven economies of scale. Exchanges had to absorb or be absorbed, and this has led to a frenzied period of M&A among exchanges. Most exchanges do only one or two mergers, but they discussed potential mergers with many more exchanges than those with whom they ultimately tied up. The period of active M&A is not over yet. There are hypothetically economies of scale to exploit until there is only one exchange left in the world. We don't believe that the entire world will converge to a single exchange, but we do believe that these strong economic forces will continue to propel mergers for some time to come.
1.
2.
4.
5.
6.
7.
8.
9.
10.
11.
12.
13.
14.
15.
16.
17.
18.
19.
20.
21.
22.
23.
24.
25.
26.
27.
28.
29.
30.
31.
32.
..................Content has been hidden....................
You can't read the all page of ebook, please click here login for view all page.