
Chapter 9: Fleet Management at Scale
The Internet of things (IoT) had a humble beginning in 1999, in Procter & Gamble, when Kevin Ashton introduced the idea of integrating a radio-frequency identification (RFID) antenna into lipstick shelves to enable branch managers to better track cosmetic inventories for replenishments. Since then, this technology has been adopted across all industry segments in some form or another and has become ubiquitous in today's world.
Managing a set of RFID tags, sensors, and actuators inside a known physical boundary is a relatively easy task. However, managing millions (or billions or trillions) of these devices globally throughout their lifecycle is not. Especially when these devices are spread across different locations with various forms of connectivity and interfaces.
Therefore, in this chapter, you will learn about the best practices of onboarding, maintaining, and diagnosing a fleet of devices remotely through AWS native services. Additionally, you will gain hands-on experience in building an operational hub to assess the health of the connected fleet for taking required actions.
In this chapter, we will be covering the following topics:
- Onboarding a fleet of devices globally
- Managing your fleet at scale
- A hands-on exercise building an operational hub
- Checking your knowledge
Technical requirements
The technical requirements for this chapter are the same as those outlined in Chapter 2, Foundations of Edge Workloads. See the full requirements in that chapter.
Onboarding a fleet of devices globally
We already introduced you to the different activities involved in the IoT manufacturing supply chain in Chapter 8, DevOps and MLOps for the Edge. Onboarding refers to the process of manufacturing, assembling, and registering a device with a registration authority. In this section, we will dive deeper into the following activities that play a part in the onboarding workflow:

Figure 9.1 – Device onboarding activities
So far, in this book, you have been using a Raspberry Pi (or a virtual environment) to perform the hands-on exercises. This is a common practice for development and prototyping needs. However, as your project progresses toward a higher environment (such as QA or production), it is recommended that you consider hardware that's industry-grade and can operate in various conditions. Therefore, all the aforementioned activities in Figure 9.1 need to be completed before your device (that is, the connected HBS hub) can be made available through your distribution channels at different retail stores (and sell like hotcakes!).
For the remainder of this chapter, we assume that your company already has a defined supply chain with your preferred vendors and the device manufacturing workflow is operational to assemble the devices. As your customers unbox these devices (with so much excitement!) and kick off the setup process, the device needs to bootstrap locally (on the edge) and register with the AWS IoT services successfully to become fully operational.
So, you must be thinking, what are the necessary steps to perform in advance for the device registration to be a success? Here it comes.
Registering a certificate authority
There are different types of cryptographic credentials such as a user ID, password, vended tokens (such as JWT and OAuth), and symmetric or asymmetric keys that can be used by an IoT device. We recommend using asymmetric keys as, at the time of writing, these are considered to be the most secure approach in the industry. In all the previous hands-on exercises, you took advantage of the asymmetric X.509 keys and certificates generated by the AWS IoT Certificate Authority (CA), that were embedded in the connected HBS hub running Greengrass. A CA is a trusted entity that issues cryptographic credentials such as digital keys and certificates. These credentials are registered on the cloud and embedded onto the devices to enable transport-layer security or TLS-based mutual authentication. Specifically, there are four digital resources associated with a mutual TLS authentication workflow, as follows:
- X.509 certificate: This is a certificate that is required to be present both on the device and in the cloud and is presented during the mutual TLS handshake.
- Private and public keys: The asymmetric key pair that is generated using an algorithm such as Rivest-Shamir-Adleman (RSA) or Elliptical Curve cryptography (ECC). As a best practice, the private key only stays on the device and should be protected to avoid identity compromises.
- Signer CA: This is a root or intermediate certificate that has been issued and signed by a trusted CA such as AWS and Verisign. The device will need to send this issuing CA along with the client certificate during the registration process. If the signer CA is not available, it's also possible to send the Server Name Indication (SNI) part of the TLS mutual authentication to validate trust.
- Server certificate: This is a certificate that's used by the devices to verify, using the certificate chain presented during the TLS handshake, that it's not communicating with an impersonating server.
The following diagram shows the workflow and the location of these digital resources on the device and in the cloud:

Figure 9.2 – Cryptographic credentials within an IoT workflow
Therefore, it's critical to decide on a CA early on in the design process. This is so that it can issue the aforementioned digital resources required by the devices to perform registration with a backend authority and become fully operational. There are three different ways a CA can be used with AWS IoT Core, as shown in the following table along with a list of pros and cons:
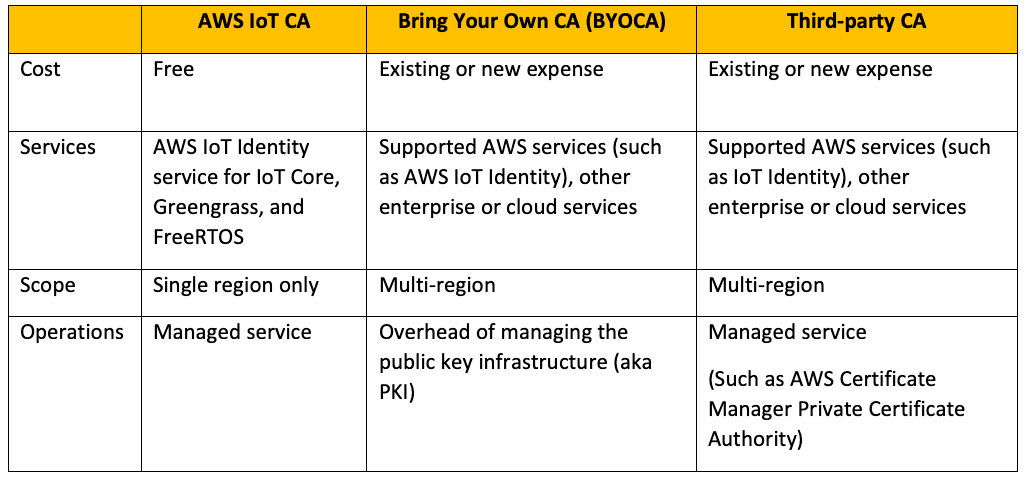
Figure 9.3 – Choosing a CA
Once the CA setup is complete, the next step is to choose the device provisioning approach based on the scenario. Let's understand that in more detail next.
Deciding the provisioning approach
Terms such as provisioning and registration are used interchangeably in many contexts in the IoT world, but we believe there is a clear distinction between them. For us, device provisioning is the amalgamation of two activities – device registration and device activation. Device registration is the process where a device successfully authenticates using its initial cryptographic credentials against a registration authority (such as the AWS IoT Identity service), reports distinctive attributes such as the model and serial number, and gets associated as a unique identity in a device registry. Additionally, the authority can return a new set of credentials, which the device can replace with the prior ones. Following this, a privilege escalator can enhance the privilege of the associated principal (such as the X.509 certificate) for the device to be activated and fully operational.
There are different approaches to these provisioning steps, which are often derived from the level of control or convenience an organization intends to have in the manufacturing supply chain. Often, this choice is determined by several factors such as in-house skills, cost, security, time to market, or sensitivity to the intellectual property of the product. You learned about the approach of automatic provisioning through IoT Device Tester in Chapter 2, Foundations of Edge Workloads, which is prevalent for prototyping and experimentation purposes.
In this section, we will discuss two production-grade provisioning approaches that can scale from one device to millions of devices (or more) by working backward from the following scenarios.
Scenario 1 – HBS hubs with unique firmware images are provisioned in bulk
In this scenario, you can provision the fleet of HBS hubs in bulk in your supply chain using unique firmware images that include unique cryptographic credentials:
- As a device maker of the HBS hub, first, you will associate the CA of your choice with AWS IoT Core using a supported API. This CA will manage the chain of trust and create and validate the cryptographic credentials (such as certificates or certificate signing requests) for the entire fleet of devices.
- Then, you will create a provisioning template, which, essentially, is a configuration file that holds the instruction for the AWS IoT identity service to create a thing (or the virtual representation) for the fleet of HBS hub devices. This template will include different input parameters such as ThingName, SerialNumber, and Certificate Signing Requests (CSRs) that will lead to the creation of IoT resources such as the virtual thing, device metadata, certificates, and policies. You can refer to the template shown on the official Internet of things on AWS blog, titled Deploy Fleets Easily with AWS IoT Device Management Services (https://aws.amazon.com/blogs/iot/deploy-fleets-easily-with-aws-iot-device-management-services/). The template can be found in the Create Provisioning Template section.
- The next step is to generate cryptographic credentials, such as the private keys and CSRs, through preferred tool chains (such as OpenSSL). Following this, create an input file with a list of devices and cryptographic credentials, which will be fed to the provisioning template. The input file, in its simplest form, might look like this:
{"ThingName": "hbshub-one", "SerialNumber": "0001", "CSR": "*** CSR FILE CONTENT ***"}
{"ThingName": "hbshub-two", "SerialNumber": "0002", "CSR": "*** CSR FILE CONTENT ***"}
{"ThingName": "hbshub-three", "SerialNumber": "0003", "CSR": "*** CSR FILE CONTENT ***"}
- Now, the time has arrived to invoke an API to create all these virtual devices (that is, things), in bulk, in the IoT device registry on the cloud along with its respective cryptographic credentials (such as the certificates or CSRs) that are signed by the CA. Once this step is complete, a token exchange role needs to be created, and these things need to be associated with Greengrass-specific constructs such as a Greengrass core, a thing group, and a configuration file (config.yaml) that is required for the installation process.
- Following this, you will inject the credentials generated in the earlier steps, which include the private key from step 3 and the signed certificate from step 4, into your firmware. This updated firmware, often referred to as the golden image, is then shared with your assembly team (either in-house or a contract manufacturer). The assembly team will flash this image onto the device part of the manufacturing workflow:
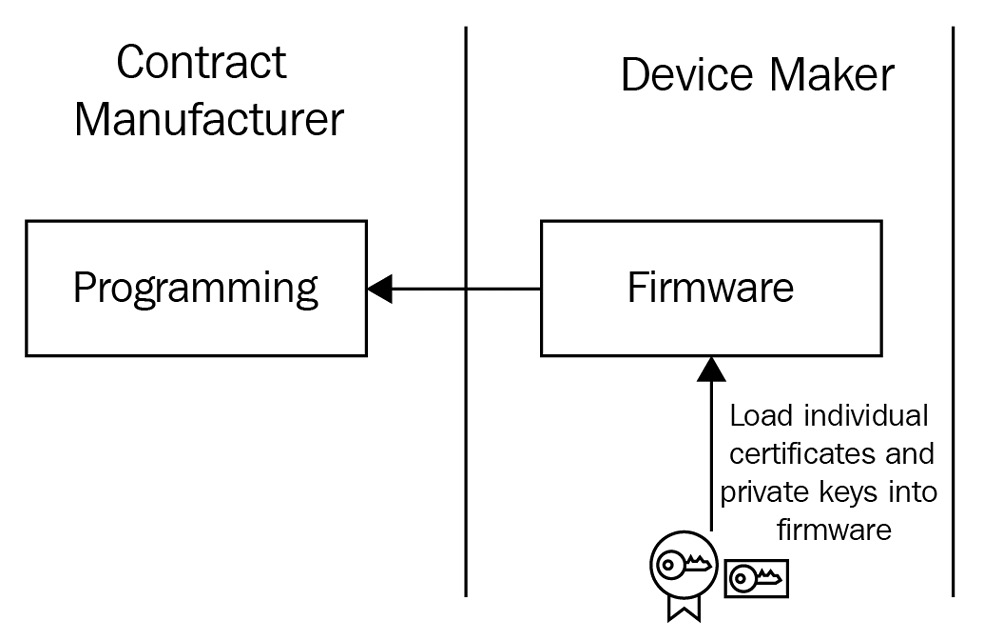
Figure 9.4 – Bulk provisioning with embedded credentials
This approach is pretty common with microcontrollers running an RTOS since incremental updates are not supported (yet) with those hardwares. However, for the connected HBS hub, it's more agile and operationally efficient to decouple the firmware image from the crypto credentials.
That's where this second option comes in. Here, you will still generate the things and unique credentials from your CA in the same way as you did in the previous step, but you will not inject it into the firmware. Instead, you will develop an intelligent firmware that can accept credentials over different interfaces such as secure shell (SSH), a network file system (NFS), or a serial connection. As a best practice, it's also common to store the credentials in a separate chip such as a secure element or a trusted platform module (TPM). Additionally, the firmware can use a public key cryptography standards interface (such as PKCS#11) to retrieve the keys and certificates as required by the firmware or other local applications in real time. At the time of writing this book, Greengrass v2 is awaiting support for TPM, although it was a supported feature in Greengrass v1:
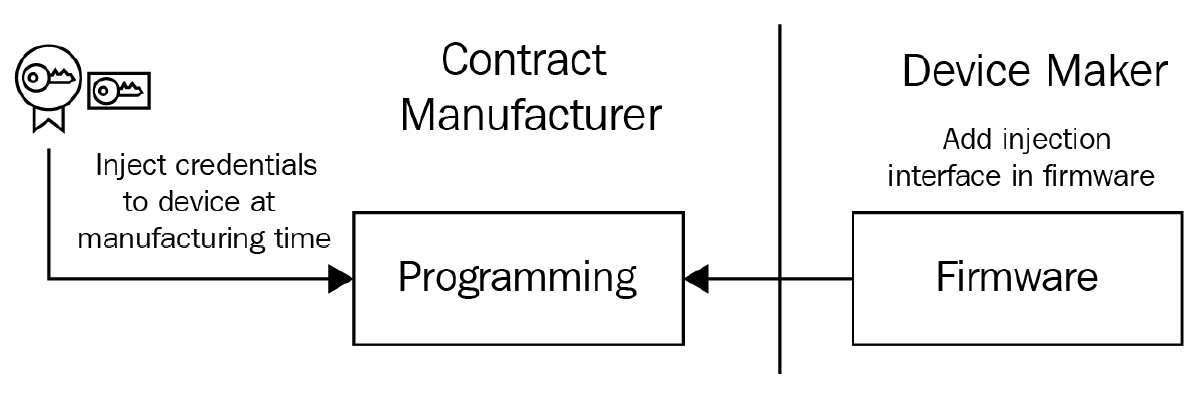
Figure 9.5 – Bulk provisioning with the injection interface
Let us take a look at how to go about the second option:
- Once the device assembly is complete with the golden image that contains the necessary configurations and credentials, the product reaches the hands of the customer through different distribution channels. When the customer switches on the device and it wakes up for the first time, the bootstrapping process kicks off.
- The bootstrapping will instantiate various local processes (or daemons), that is, the firmware instructions. One of those processes includes registration with AWS IoT Identity services where the device will connect to the cloud endpoint and exchange the embedded credentials part of the TLS mutual authentication. Considering the things, certificates, and policies are already created as a prerequisite to the assembly, the device is fully operational if the mutual authentication is successful.
Scenario 2 – HBS hubs with shared claims are provisioned just in time
Let's consider the following scenario; your devices might not have the capability to accept unique credentials at the time of manufacturing. Or it's cost-prohibitive for your organization to undertake the operational overhead of embedding unique credentials in each HBS hub in your supply chain. This is where another pattern emerges, referred to as fleet provisioning by claim, where, as a device maker, you can embed a non-unique shared credential (referred to as claim) in your fleet. However, we recommend that you do not share the same claim for the entire fleet, rather only a percentage of it to reduce the blast radius in the case of any security issues. Take a look at the following steps:
- As a first step, the firmware along with a fleet provisioning plugin and a shared certificate (that is, claim) is loaded by the contract manufacturer on the device without performing any customization. The fleet provisioning by claim approach uses a templated methodology that is similar to the previous scenario to provision the required cloud resources. You can refer to a sample template that is provided in AWS's documentation, called Set up AWS IoT fleet provisioning for Greengrass core devices (https://docs.aws.amazon.com/greengrass/v2/developerguide/fleet-provisioning-setup.html#create-provisioning-template). The primary difference is that all of these resources are provisioned just in time, where each device initiates the bootstrapping process from their current location over being imaged in bulk in a manufacturing facility.
- This approach also supports a pre-provisioning hook feature in which a lambda function can be invoked to validate different parameters or perform pre-provisioning logic. For example, it can be as simple as overriding a parameter to more complex validations such as checking whether the claim certificate is part of a revocation list:
def pre_provisioning_hook(event, context):
return {
'allowProvisioning': True,
'parameterOverrides': {
'DeviceLocation': 'NewYork'
}
}
Here, when the hub wakes up and connects to AWS IoT for the first time, the claim certificate is exchanged for permanent X.509 credentials that have been signed by the CA (AWS or BYO). This is where the fleet provisioning plugin helps, as it allows the device to publish and subscribe to the required MQ telemetry transport (mqtt) topics, accept the unique credentials, and persist in a secure type of storage:
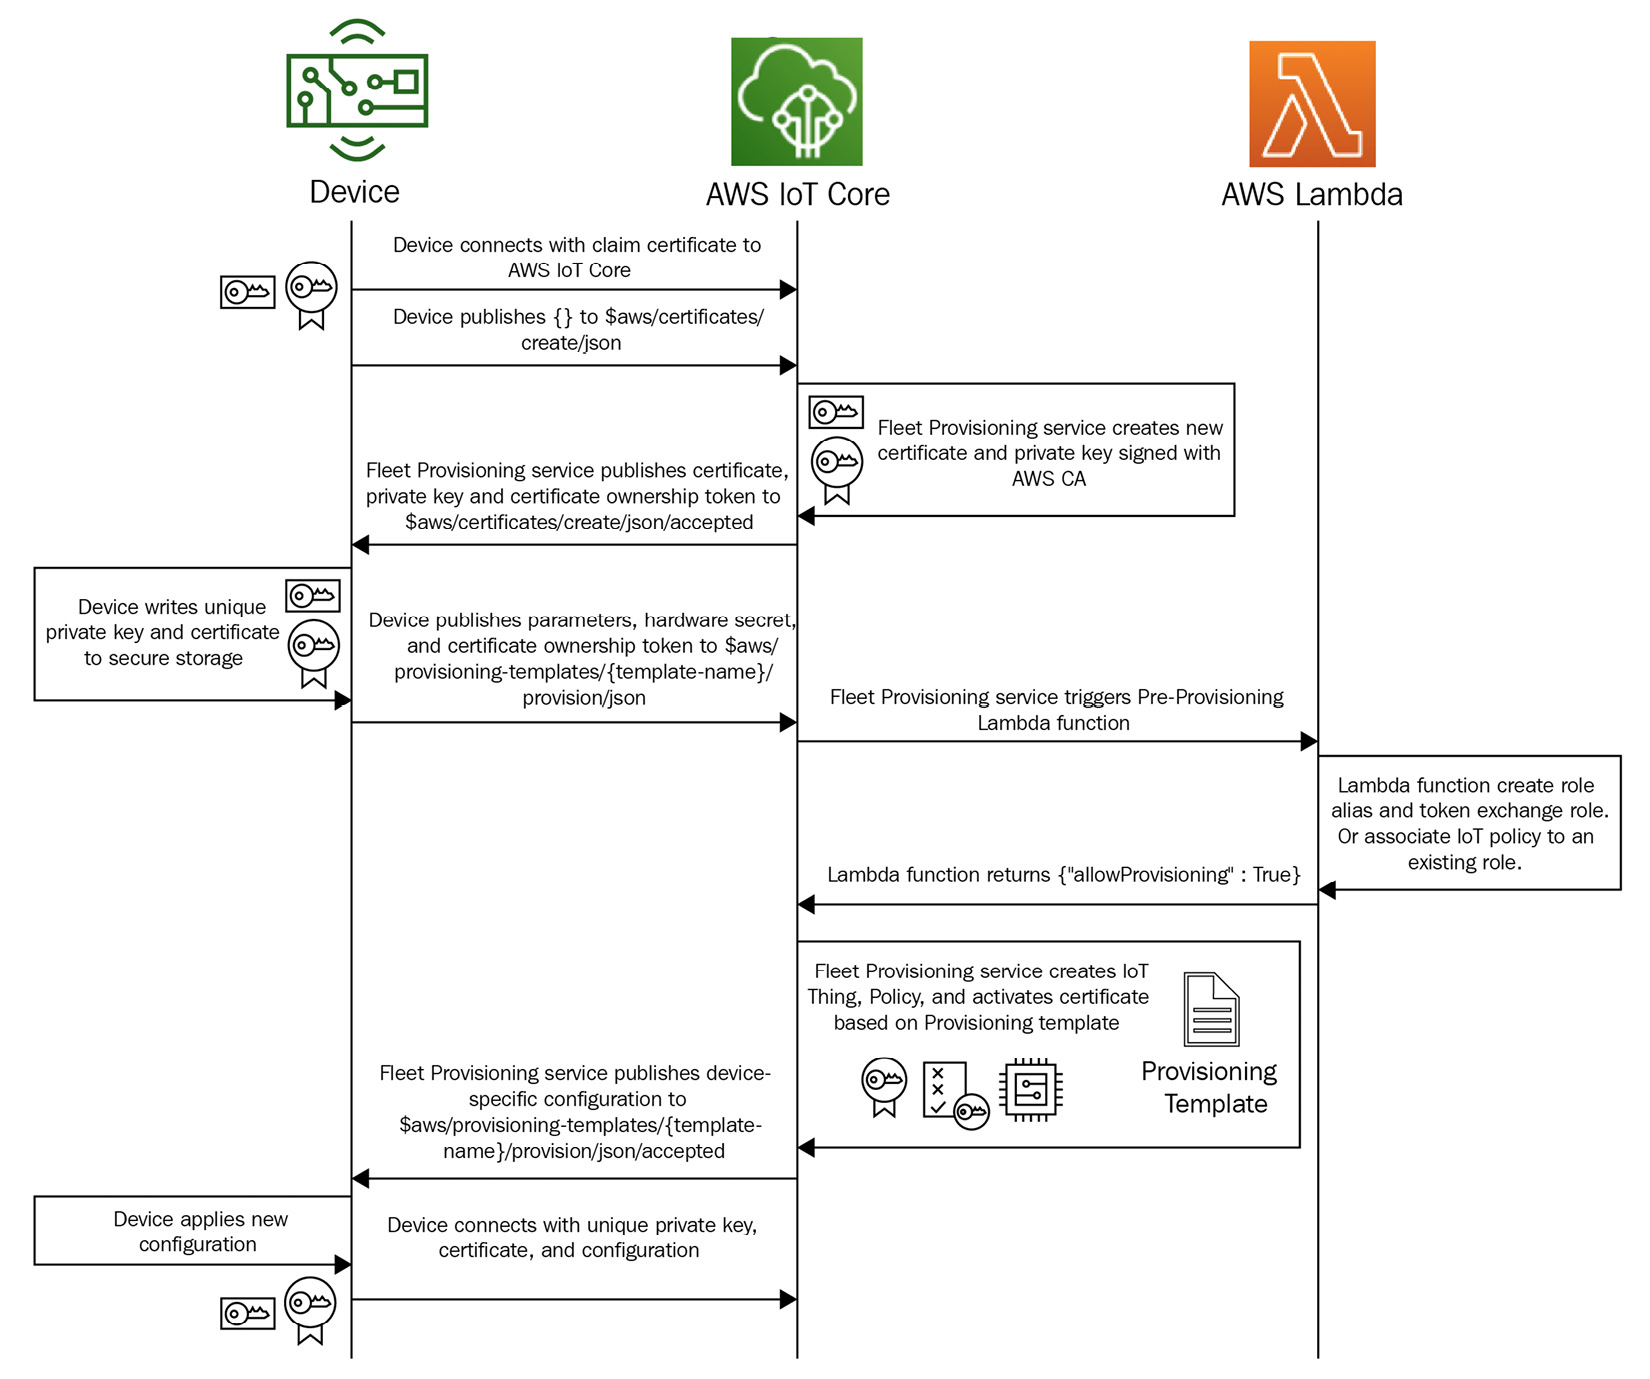
Figure 9.6 – Fleet provisioning with shared claims
- Following this, the device must also disconnect from the previous session it initiated with the shared claim and reconnect with the unique credentials.
Word of Caution
Fleet provisioning by claim poses security risks if the shared claims are not protected through the supply channels.
Once the devices have been provisioned, the next step is to organize them to ease the management throughout its life cycle. The Greengrass core devices can be organized into thing groups, which is the construct for organizing a fleet of devices within the AWS IoT ecosystem. A thing group can be either static or dynamic in nature. As their name suggests, static groups allow the organization of devices based on non-changing attributes such as the product type, the manufacturer, the serial number, the production date, and more.
Additionally, static groups permit building a hierarchy of devices with parent and child devices that can span up to seven layers. For example, querying a group of washing machine sensors within a serial number range that belongs to company XYZ can be useful to identify devices that need to be recalled due to a production defect.
In comparison, dynamic groups are created using indexed information such as the connectivity status, registry metadata, or device shadow. Therefore, the membership of dynamic groups is always changing. That is the reason dynamic groups are not associated with any device hierarchy; for example, querying a group of HBS devices that are connected at a point in time and have a firmware version of v1. This result can allow a fleet operator to push a firmware update notification to the respective owners.
Another advantage of using thing groups is the ability to assign fleet permissions (that is, policies) at the device group level, which then cascades to all the devices in that hierarchy. This eases the overhead of managing policies at each device level. Concurrently, though, it's possible to have device-specific policies, and the AWS IoT Identity service will automatically assess the least-privileged level of access permitted between the group and device level during the authentication and authorization workflow.
Now you have a good understanding of how to provision and organize the HBS hubs using different approaches. Next, let's discuss how to manage the fleet once it has been rolled out.
Managing your device fleet at scale
Although it might be easier to monitor a handful of devices, managing a fleet of devices at scale can turn out to be an operational nightmare. Why? Well, this is because IoT devices (such as the HBS hub) are not just deployed in a controlled perimeter (such as a data center). As you should have gathered by now, these devices can be deployed anywhere, such as home, office, business locations, that might have disparate power utilization, network connectivity, and security postures. For example, there can be times when the devices operate offline and are not available over a public or private network due to the intermittent unavailability of WI-FI connectivity in that premises. Therefore, as an IoT professional, you have to consider various scenarios and plan in advance for managing your fleet at scale.
In the context of a connected HBS hub, device management can help you achieve the following:
- Capture actionable information from the real world.
- Increase efficiency of the solution by capturing anomalies early.
- Optimize cost using predictive or preventive maintenance.
- Prevent the theft of intellectual IP or unauthorized access.
- Build a continuous feedback loop to improve customer experience.
- Generate additional revenue streams with more data insights.
So, as you might have gathered, developing an IoT solution and rolling it out to the customers is just the beginning. It's necessary to govern the entire life cycle of the solution to achieve the business outcomes cited earlier. Therefore, device management can also be considered as a bigger umbrella for the following activities:
- Provision
- Organize
- Monitor
- Maintain
- Diagnose
The following is a diagram showing the IoT Device Management workflow:
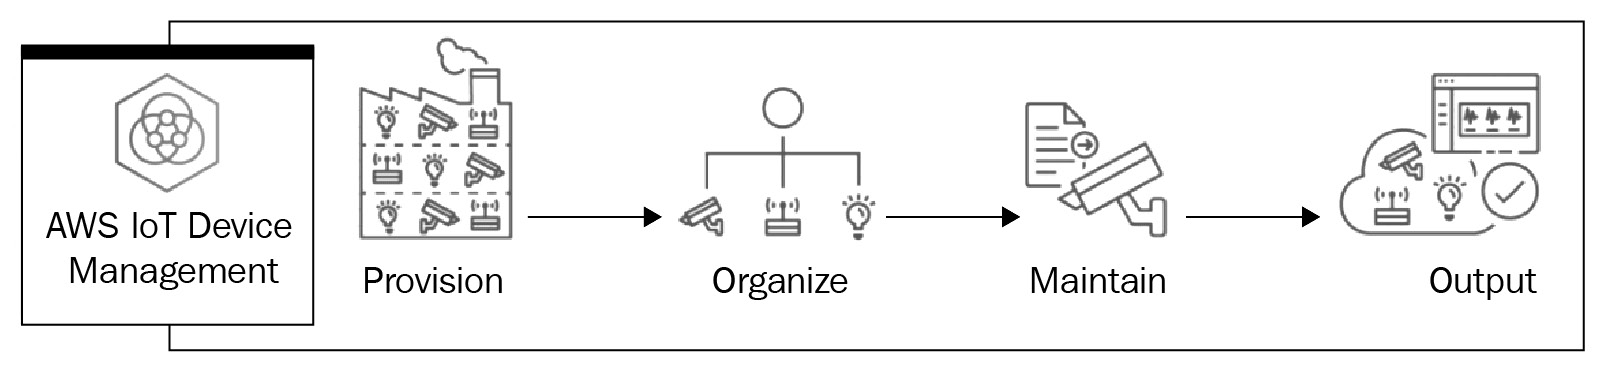
Figure 9.7 – The IoT Device Management workflow
We have already discussed the first three topics in the preceding section in the context of Greengrass. Therefore, we will move on to focus on the remaining activities.
Monitor
Monitoring the Greengrass-enabled HBS hubs and the associated devices will be key in achieving a reliable, highly available, and performant IoT workload. You should have a mechanism to collect monitoring data from the edge solution to debug failures when they occur. Greengrass supports the collection of system health telemetry and custom metrics, which are diagnostic data points to monitor the performance of critical operations of different components and applications on the Greengrass core devices. The following is a list of the different ways to gather this data:
- Nucleus emitter is a Greengrass component that can be deployed to your Greengrass core device to publish telemetry data to a local topic by default:
- Once the data has been published to a local topic (such as $local/greengrass/telemetry), you can act locally on that data on your core device, even when there is intermittent connectivity to the cloud.
- Optionally, the component can be configured to publish telemetry data to the mqtt topic in the cloud.
- This is a continuous stream of system telemetry data published to a local topic in near real time. The default configuration is every 60 seconds.
- There are no costs if the telemetry data is published locally, but charges apply when it is pushed to the cloud.
- A telemetry agent is another option that you can use to collect local telemetry data, which is enabled by default for all Greengrass core devices:
- This agent collects telemetry data and publishes it to the cloud on a best effort basis through Amazon EventBridge, which is a serverless event bus service.
- Data starts to flow as soon as the Greengrass core device is up and running. By default, the telemetry agent aggregates telemetry data every hour and publishes it to the cloud every 24 hours.
- There are no data transfer charges since the messages are published to reserved topics on AWS IoT Core.
- A telemetry agent publishes the following metrics natively:
- System memory and CPU utilization
- The total number of file descriptors, where each descriptor represents an open file
- The number of components in various states, such as the following:
- Installed, new, and starting
- Running, stopping, and finishing
- Errored, broken, and stateless
Later, in the hands-on section, you will collect these metrics and process them on the cloud.
- CloudWatch metrics is a Greengrass component that allows you to publish custom metrics to Amazon CloudWatch:
- Any custom component such as lambda functions or containers deployed on the core device can publish the custom metrics to a local topic (cloudwatch/metric/put).
- The components can be configured to specify different publish intervals (in seconds), so the metrics can be published with or without batching. For example, with lambda, the default batching window is 10 seconds and the maximum wait time could be 900 seconds.
- So, if you think of scenarios where you have to collect metrics from the sensors and actuators associated with the hub and not just from the gateways, a custom application can retrieve those data points and publish them locally or to cloud endpoints for monitoring purposes.
- Log manager is a Greengrass component that can be deployed to your Greengrass core device to collect and, optionally, upload logs to Amazon CloudWatch Logs:
- Although metrics can help reflect the state of the device, logs are critical for troubleshooting exceptions or failures.
- For the real-time observability of logs, Greengrass offers various log files. Some of these you might have already used by now, such as the following:
- Greengrass.log: This is a log file that is used to view real-time information about nucleus and component deployments. For example, with an HBS hub, this log file can report the errors, exceptions, and failures of the nucleus software, which you (or the customer) can analyze for downtimes or malfunctions.
- Component.log: This is a log file(s) to view real-time information about the components running on the core device.
- Main.log: This is a log file that handles the component life cycle information.
- The log manager component can upload logs in various frequencies. The default configuration for log manager is to upload new logs every 5 minutes to AWS CloudWatch. Additionally, it's possible to configure a lower upload interval for more frequent uploads. The log format is also configurable between text format and JSON format.
- Log manager also supports file rotation every hour or when the file size limit has exceeded. The default size limit for the log files is 1 MB and the disk size is 10 MB and is fully configurable. To optimize log sizes, it's also a best practice to use different verbosity levels for different environments (such as development, testing, and production):
- For example, you can choose DEBUG-level logs to help with troubleshooting in non-production environments or ERROR-level logs to reduce the number of logs that a device generates in a production environment. This choice also helps to optimize costs.
As you are collecting all of these data points (metrics and logs) from the HBS hub and publishing them to the cloud, the next step is to allow different personas such as fleet operators (or other downstream businesses) to consume this information. This can be achieved through CloudWatch, which natively offers various capabilities related to logging insights, generating dashboards, setting up alarms, and more. If your organization has already standardized on a monitoring solution (such as Splunk, Sumologic, Datadog, or others) CloudWatch also supports that integration.
Finally, in the control plane, Greengrass integrates with AWS CloudTrail to log access events related to service APIs, IAM users, and roles. These access logs can be used to determine additional details about Greengrass access such as the IP address from which a request was made, who the request was made by, and when it was made, which can be useful for various security and operational needs.
Maintenance
The previously explained services, such as Amazon CloudWatch (or a third-party solution), can be robust enough to generate the various insights required to monitor the health of IoT workloads. However, another common ask from IoT administrators or fleet operators is to have a single-pane-of-glass view that allows them to consume a comprehensive set of information from the device fleet, to quickly troubleshoot operational events.
For example, consider a scenario where customers are complaining that their HBS hubs are malfunctioning. As a fleet operator, you can observe a lot of connection drops and high-resource utilization from the dashboard. Therefore, you look up the logs (on a device or in the cloud) and identify it as a memory leak issue due to a specific component (such as Aggregator). Based on your operation playbook, you need to identify whether this is a one-off issue or whether more devices in the fleet are showing similar behavior. Therefore, you need an interface to search, identify, and visualize the metrics such as the device state, device connection, battery level across the fleet, or on a set filtered by user location. Here comes the need for a fleet management solution such as AWS Fleet Hub, which allows the creation of a fully managed web application to cater to various personas using a no-code approach. In our scenario, this web application can help the operators to view, query, and interact with a fleet of connected HBS hubs in near real time and troubleshoot the issue further. In addition to monitoring, the operators can also respond to alarms and trigger a remote operation over the air (OTA) to remediate deployed devices from a single interface. AWS Fleet Hub applications also enable the following:
- Integration with existing identity and access management systems such as Active Directory and LDAP, which allow role-based access to different personas such as the fleet operators, fleet managers, device makers, third parties, and IT operators who are interacting with the HBS hub in some way. Additionally, this allows these users to use single sign-on (SSO) and access a fleet hub from any browser on a desktop, tablet, or smartphone.
- Aggregation of data from other services such as AWS IoT Fleet Indexing, Amazon CloudWatch, or Amazon Simple Notification Service (SNS). The IoT Fleet Indexing service helps to index, search, query, and aggregate data from device registry, device shadow, and device connectivity events. Also, it's possible to create custom fields. CloudWatch metrics can be used in combination with these searchable fields to create alarms. Finally, Amazon SNS can notify different personas when an alarm threshold has been breached.
In summary, these capabilities from Fleet Hub can allow an organization to respond more quickly to different operational events and, thereby, improve customer experience.
Diagnose
In the preceding scenario, you learned how a fleet operator can stay well informed about the operational events in near real time through a single-pane-of-glass view. However, what about diagnosing the issue further if the remote actions through Fleet Hub are not sufficient to remediate the identified issue? For example, an operator might have triggered a remote action to restart the aggregator component or the HBS hub itself, but that did not solve the problem for the end consumer. Therefore, as a next step, the operator is required to gain direct access to the hub or associated sensors for further troubleshooting. Traditionally, in such a situation, a company will schedule an appointment with a technician, which means additional cost and wait time for the customers. That's where a remote diagnostics capability such as AWS IoT Secure Tunneling can be useful. This is an AWS Managed service that allows fleet operators to gain additional privileges (such as SSH or RDP access) over a secure tunnel to the destination device.
The secure tunneling component of Greengrass enables secure bidirectional communication between an operator workstation and a Greengrass-enabled device (such as the HBS hub) even if it's behind restricted firewalls. This is made possible because the remote operations navigate through a secure tunnel under the hood. Moreover, the devices will also continue to use the same cryptographic credentials (that is, X509 certificates) used in telemetry for this remote operation. The only other dependency from the client side (that is, the fleet operator) is the installation of proxy software on the laptop or a web browser. That is because this proxy software makes the magic happen by allowing the exchange of temporary credentials (that is, access tokens) with the tunneling service when the sessions are initiated. The following diagram shows the workflow of secure tunneling:
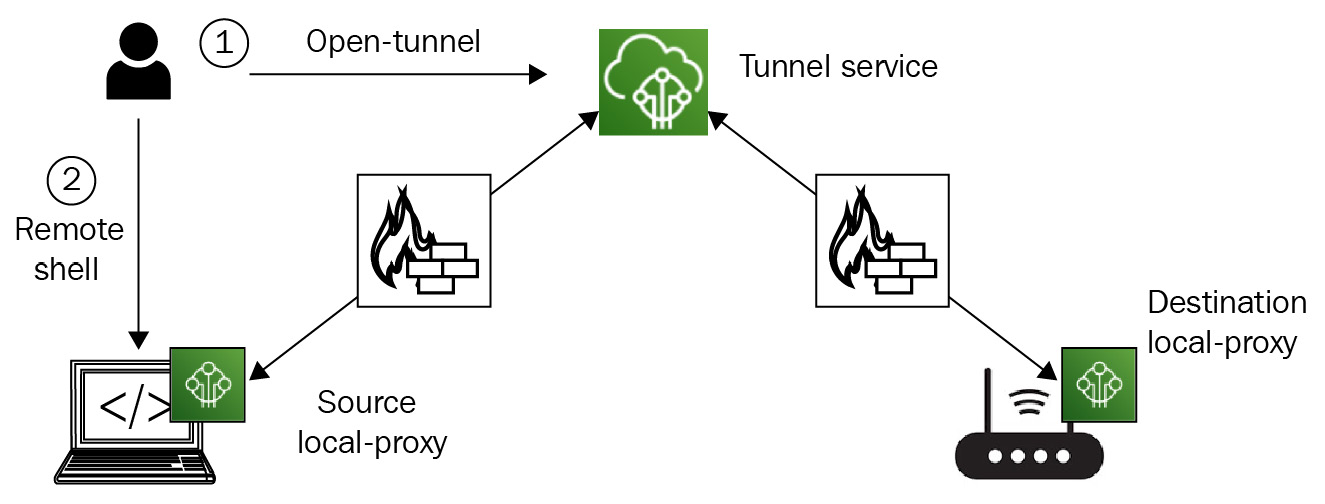
Figure 9.8 – The secure tunneling workflow for diagnostics
For our scenario, the source refers to the workstation of the fleet operator, the destination refers to the connected HBS hub, and the secure tunnel service is managed by AWS.
Now that you have gained a good understanding of how to better monitor, maintain, and diagnose edge devices, let's get our hands dirty in the final section of this chapter.
Getting hands-on with Fleet Hub architecture
In this section, you will learn how to use the nucleus emitter and the telemetry agent to capture various metrics and logs from edge devices and visualize those through Amazon CloudWatch and AWS IoT Fleet Hub. The following is the architecture that shows the different services and steps you will complete during the lab:
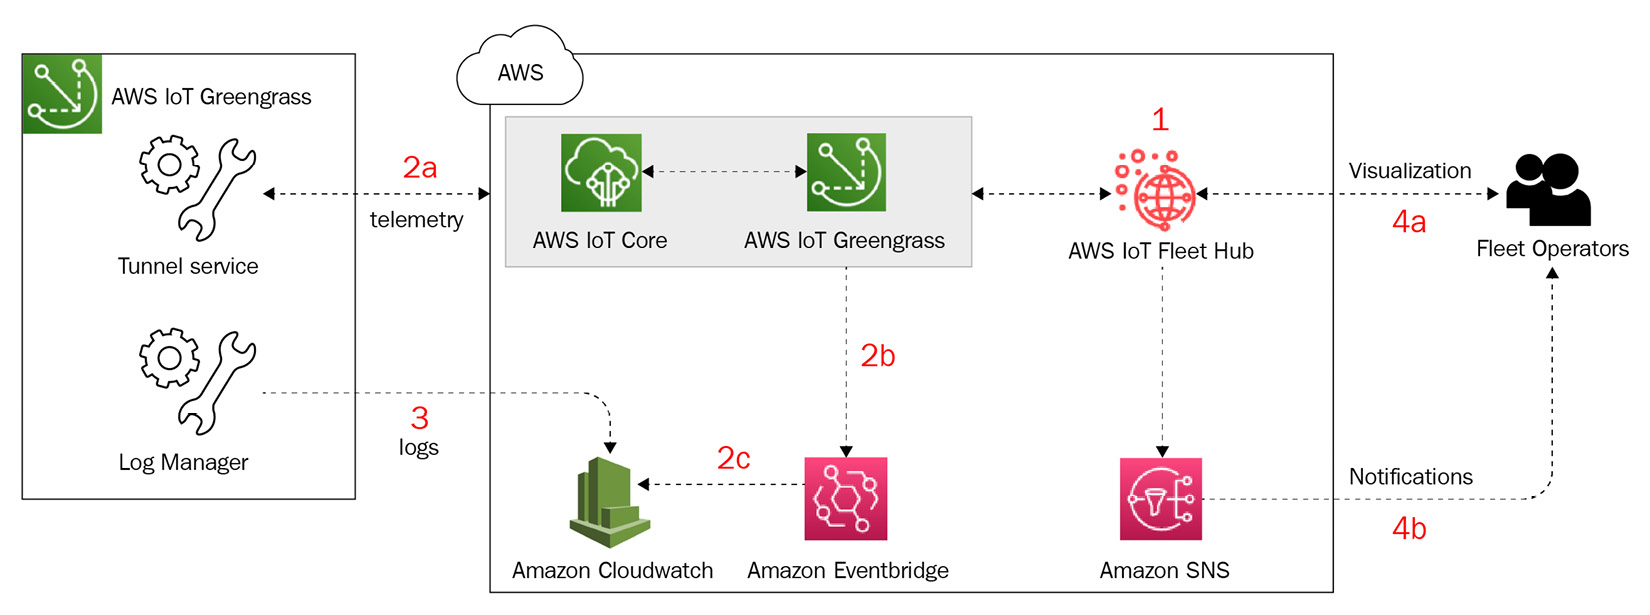
Figure 9.9 – Hands-on operational hub
The following table lists the services that you will use in this exercise:

Figure 9.10 – The services in scope for this exercise
Your objective in this hands-on section includes the following steps, as depicted in the preceding architecture:
- Build an operational dashboard using AWS IoT Fleet Hub.
- Deploy a nucleus emitter component and collect metrics through the telemetry from the edge.
- Deploy a log manager component and stream the logs to Cloudwatch.
- Visualize the results on IoT Fleet Hub and CloudWatch.
Let's take a look at the preceding steps, in more detail, next.
Building the cloud resources
In this section, you will learn how to set up a Fleet Hub application that can be used to monitor the metrics from the connected HBS hub. Perform the following steps:
- Navigate to AWS IoT Core Console and select Fleet Hub. Choose Get started and click on Create Application.
- This will prompt you to set up Single Sign-On using AWS SSO. If you have not used this service in the past, create a user with the necessary information. You will receive an invitation via email that you need to accept along with instructions about how to set up your password. Click on Next.
- Now you need to configure indexing with AWS IoT data. As discussed earlier, Fleet Hub gives you a single-pane-of-glass view by aggregating information from different sources. This is where you set all of these integrations.
- Click on Manage Indexing in the Fleet indexing section. This will open up the AWS IoT settings page. Click on Manage Indexing again and enable all the available options such as Thing Indexing and Thing Group Indexing. Optionally, you can also create custom search fields if you wish. Click on Update.
- Navigate back to the Fleet Hub setup screen and the settings should be in active status now. Click on Next.
- Create an application role and an application with a name of your choice. Click on the view policy permissions to understand the access provided to the application. You should notice that you are providing access to the IoT, CloudWatch, and SNS resources for Fleet Hub to integrate with all of these sources, as mentioned earlier. Click on Create application.
- On the Applications tab of Fleet Hub, click on the application URL once it shows active. For the first access, this will prompt you to add an SSO user. Click on that and add the user you created earlier. Click on Add selected users.
- Once it's complete, click on the application URL again, proceed to the web dashboard, and sign in with the credentials you configured in step 2. Click on the application icon, and it should open up the dashboard for you.
Congratulations! You are all set up with the Fleet Hub dashboard!
Note
Although we have only created one user for this lab, you can integrate AWS SSO with your organization's identity management systems such as Active Directory. This will allow role-based access to the dashboard for different personas. Ideally, this configuration will fall under the purview of identity engineers and won't be the responsibility of the IoT professionals.
Next, let's set up the routing rules for ingesting the telemetry data from the HBS hub to the cloud:
- Navigate to the Amazon EventBridge console (https://go.aws/3xcB2T7), and click on Create rule.
- Choose a name and description for the rule.
- In the Define pattern section, configure the following:
- Check the event pattern and predefined pattern by service.
- Service provider: AWS.
- Service name: Greengrass.
- Event type: Greengrass Telemetry Data.
- Keep the Select an Event Bus section in its default setting.
- Under Select targets, configure the target to be a CloudWatch group:
- Target: CloudWatch log group
- Log Group: /aws/events/<replace this with a name of your choice>
- Keep everything else in its default setting and click on Create.
Great work! EventBridge is all set to ingest telemetry data and publish it to the CloudWatch group.
We will revisit these dashboards again at the end of the lab to visualize the collected data from the hubs. For now, let's switch gears to configure and deploy the edge connectors on Greengrass.
Deploying the components from the cloud to the edge
In this section, you will learn how to deploy the Nucleus Emitter and Log Manager agents to a Greengrass-enabled HBS hub, to publish the health telemetry to the cloud. Perform the following steps:
- Please navigate to the Amazon Greengrass console and choose Deployments. Choose the existing deployment, and click on Revise. On the Select Components page, in the Public components section, search for and select the aws.greengrass.telemetry.NucleusEmitter and aws.greengrass.LogManager components. Feel free to click on View recipe to review the configuration of this component.
- Click on Next by keeping all the previous components along with the preceding two components selected. Keep the other options in their default settings in the following screens and choose Deploy.
Visualizing the results
Now you have set up the fleet hub and deployed the agents on the edge, you can visualize the health telemetry data using the following steps:
- Navigate to AWS IoT Core Console, click on Fleet Hub, and select the application you created earlier in the lab.
- In the Device list section, click on the Greengrass-enabled HBS hub device. You will be able to view the status of the device along with various other attributes such as the field attributes, the device shadow file (that is, the device state if configured), the group to which the device belongs, and the history of the deployments (that is, the jobs).
- Navigate back to the home screen. Feel free to play with the search and filter options provided at the top of the screen to refine your results. Generally, this is useful when you have a large number of gateways and associated devices. You can also flip to the Summary section to visualize the total number of devices by thing types, the thing groups, and the reasons to disconnect.
- Click on Create alarm. This will help you set up notifications for the following breach:
- Choose a field: Disconnect Reason.
- Choose an aggregation type: Count.
- Choose a Period setting of 5 minutes, then click on Next.
- Choose the Metric setting to be Greater/Equal than 1, then click on Next.
- Assuming you have only one device gateway, you can increase the count if you have more.
- Configure the notify and alarm details, then click on Next and Submit.
Therefore, as a fleet operator, you can now visualize the health of your device fleet along with being alarmed for threshold breaches.
- Navigate to the AWS CloudWatch console, click on Logs and then select Log groups.
- Search for and click on the /aws/events/<replace this with a name of your choice> log group, and visualize the log streams.
- It might take some time to populate, but the log streams should show the telemetry data collected from the Greengrass hub device.
- Feel free to play with Log Insights, which allows you to analyze the logs through a query interface.
So far, you have learned how to operate a fleet of Greengrass-enabled devices using AWS native solutions. These patterns are also applicable for non-Greengrass devices, for example, the devices that leverage other devices' SDKs (such as AWS IoT Device SDK or FreeRTOS).
Challenge Zone
I would like to throw a quick challenge for you to determine how you can trigger an OTA job from AWS IoT Fleet Hub to a specific HBS hub device. This can be useful when you have to push an update such as a configuration file that is required during an operational event. Best of luck!
Let's wrap up this chapter with a quick summary and a set of knowledge-check questions.
Summary
In this chapter, you were introduced to design patterns and the best practices of onboarding, managing, and maintaining a fleet of devices. These practices can help you to provision and operate millions (or more) of connected devices across different geographic locations. Additionally, you learned how to diagnose edge devices remotely for common problems or tunnel in securely for advanced troubleshooting. Following this, you implemented an edge-to-cloud architecture, leveraging various AWS-built components and services. This allowed you to collect health telemetry from the HBS hubs, which a fleet operator can visualize through dashboards, be notified through alarms, or take action as required.
In the next and final chapter, we will summarize all the key lessons that you have learned throughout the book (and more), so you are all set to build well-architected solutions for the real world.
Knowledge check
Before moving on to the next chapter, test your knowledge by answering these questions. The answers can be found at the end of the book:
- True or false: Device registration and device activation are the same.
- What are the different ways to leverage a CA with AWS IoT Greengrass?
- Is there an option to provision devices in real time? If yes, then what is it?
- True or false: Metrics and logs are the only data points required to monitor an IoT workload.
- What do you think is a benefit of having a single-pane-of-glass view for your entire fleet of devices?
- What is a mitigation strategy for remote troubleshooting devices without sending technicians if required? (Hint: think tunnel.)
- What components does AWS IoT Greengrass provide to collect system health telemetry?
- True or false: Aggregation of metrics on the edge device is not possible. It can only be done in the cloud.
References
Take a look at the following resources for additional information on the concepts discussed in this chapter:
- Whitepaper on Device Manufacturing and Provisioning with X.509 Certificates in AWS IoT Core: https://d1.awsstatic.com/whitepapers/device-manufacturing-provisioning.pdf
- When to use AWS IoT device management: https://aws.amazon.com/iot-device-management/
- The AWS IoT Greengrass launch of fleet management capabilities: https://aws.amazon.com/about-aws/whats-new/2021/08/aws-iot-greengrass-v-2-4/
- Fleet Hub for AWS IoT Device Management: https://docs.aws.amazon.com/iot/latest/fleethubuserguide/what-is-aws-iot-monitor.html
- AWS IoT thing groups: https://docs.aws.amazon.com/iot/latest/developerguide/thing-groups.html