
INTRODUCTION
This chapter introduces some of the most commonly used techniques for modelling requirements for IT systems. These techniques are used to analyse and specify requirements during systems development. Models are extremely useful in helping to clarify understanding and, if cross-checked with other models, ensuring the completeness of the analysis. A model shows only one view, or perspective, of a system but shows this view very clearly. This induces the analyst to ask further questions, often those that have not been identified previously. The techniques we describe here have been selected from two distinct approaches to systems modelling: use case diagrams and class modelling from the Unified Modeling Language (UML), and entity relationship modelling from the family of structured, data-driven approaches. The selected techniques model two distinct views of the IT system: the functions that the system will provide and the data to be stored within the system.
MODELLING BUSINESS USE CASES
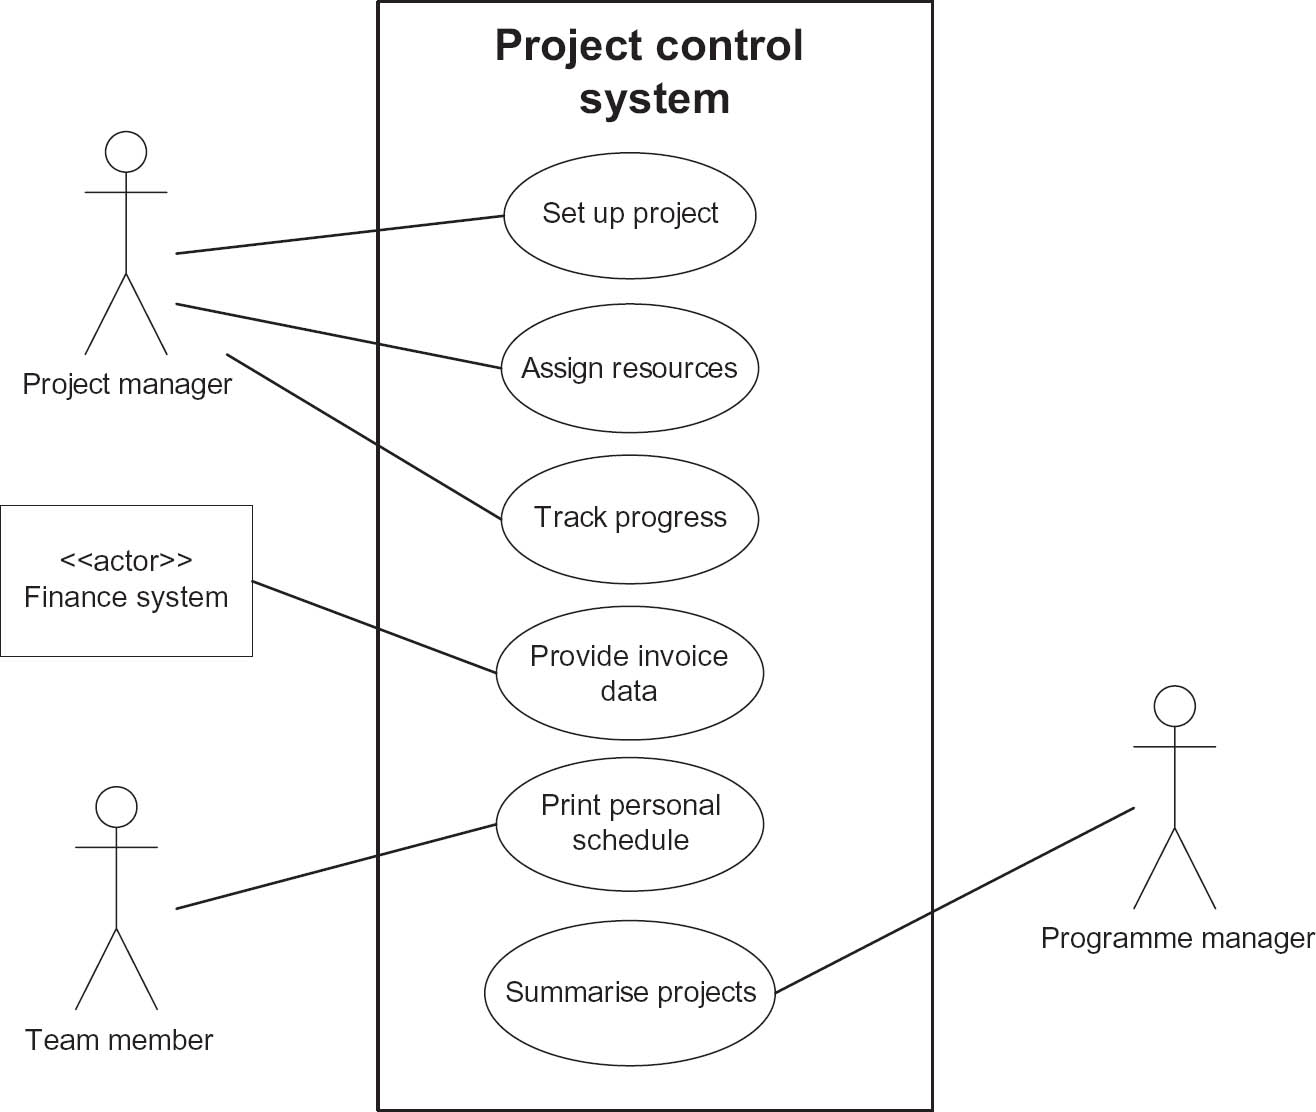
A top-level view of an organisation or business system can be provided through developing a business use case diagram. Use cases are described in more detail in the next section but, for now, it is sufficient to say that they represent things that an organisation, business system or IT system need to provide. A business use case diagram shows the usage that stakeholders require of a system. An example is shown in Figure 12.1; there are just two actors, a project manager and a programme manager, and the use cases represent what they require of the business system.
Business use case diagrams can be extremely useful when scoping a project or gaining an overview of the areas to be investigated and analysed. Some of the use cases on a business use case diagram may be fulfilled by an IT system but for others this may be only partially the case, and for some the solution may be completely manual. Some of the business use cases shown in Figure 12.1 are taken down to the system level in Figures 12.2 to 12.4.
Figure 12.1 Use case diagram for a project management organisation (Reproduced by permission of Assist Knowledge Development Ltd)

MODELLING SYSTEM USE CASES
The saying ‘one picture is worth ten thousand words’ applies directly to the definition of IT system requirements. It is extremely difficult, if not impossible, to write textual statements that are completely unambiguous. However, this is not the case with a model that has been drawn using defined notational standards; each box and line makes a clear statement about the system under investigation. Some models are more easily understood by business users than others. The view of a system that is often most accessible to business users depicts the ‘functions’ that will be provided and the ‘actors’ who are involved in using those functions. A function may be defined as a set of actions that the business users want the IT system to support in order to achieve a specific goal. For example, a function might be ‘Record customer’ and the actions here would include the following:
- accept the customer details;
- validate the customer details;
- store the customer details that have been entered.
In the Unified Modeling Language (UML), a use case is something that an actor wants the IT system to do; it is a ‘case of use’ of the system by a specific actor and describes the interaction between an actor and the system. Each use case will have a stated goal and will contain a description of the actions that the system must perform to achieve this goal. The use case model will consist of a diagram showing the actors, the use cases and the associations between them, plus a set of use case descriptions. The following elements are found in the use case diagram:
Actors are whoever or whatever expects a service from the system. They are usually user roles but also may be external systems or time. On the use case diagram, actors are shown interacting with the use cases. As they are external to the system and outside its control, defining the system actors and the use cases they are associated with, helps define the system boundary. Actors are usually shown as matchstick figures, but if the actor is another system it can be shown by a rectangle with an <<actor>> stereotype before the name of the system. Some analysts prefer to show all actors, including the job roles, as rectangles because business users can feel that matchstick figures trivialise the diagrams. Time can also be an actor and may be shown as a rectangle or matchstick figure.
Each use case is shown as an oval and represents a function that the system will perform in response to a trigger from the actor. We use the ‘verb noun’ convention to name use cases. For example, ‘Set up project’ or ‘Book room’.
The system boundary is indicated by drawing a large box around all of the use cases but with the actors outside the box. This clearly illustrates the boundary of the system and is very useful when agreeing the scope of the system.
Associations indicate which actors will need to interact with which use cases. Lines are drawn linking actors with the appropriate use cases.
The use case diagram in Figure 12.2 shows part of the project control system. You might create a diagram such as this during a workshop or following some interviews with the business users.
Figure 12.2 System use case diagram for a project control system (Reproduced by permission of Assist Knowledge Development Ltd)
Use case diagrams are particularly useful during a workshop because they are so easily understood by business users and provide an excellent framework for the discussion. The detail of the interaction between an actor and a use case is documented in a use case description. This lists the steps that take place during the interaction and is usually a textual description. The detail of any processing carried out within the use case may be documented using a variety of techniques. For example, we could use activity diagrams from the UML or other more established techniques such as decision tables.
The <<include>> and <<extend>> constructs
When exploring the use cases, it often emerges that some processing elements are repeated. For example, in the project control system, many of the use cases start by identifying the project concerned. As it stands, the steps involved in identifying the project would have to be included in each use case and a great deal of duplication would result. Instead of this, the project identification elements can be written as a separate use case and then ‘included’ in a number of others. This is represented in Figure 12.3 where the <<include>> stereotype is shown on a dotted line with an arrowhead pointing to the included use case.
Figure 12.3 Use case diagram showing <<include>> (Reproduced by permission of Assist Knowledge Development Ltd)

It may also emerge during more detailed investigation and specification that there are some elements of the use cases that are not mandatory for the current development iteration or release of software (in other words, the relevant requirement has not been classified as a ‘must’ in MoSCoW terms as described in Chapter 11). In this situation, a separate use case can be created to ‘extend’ the original use case. For example, after the project manager tracks progress, she may also print a progress report and, in Figure 12.4, this has been split off into a separate use case because it is not required in the first iteration. The new use case is said to ‘extend’ the original use case. This type of association is shown by a dotted line with an arrowhead that points back to the original use case.
Figure 12.4 Use case diagram showing <<include>> and <<extend>> (Reproduced by permission of Assist Knowledge Development Ltd)

The <<include>> and <<extend>> concepts allow use cases to be connected to each other. This is the only way that use cases are linked as these diagrams are not intended to show the flow – or sequence – of the processing.
MODELLING SYSTEM DATA
It is essential to model the data to be stored within the IT system. A data model allows the stakeholders who use the system, or obtain information from it, to agree the data that will be recorded and retrieved. It also provides the basis for the database design in a bespoke development or helps in the evaluation of a packaged application. But data modelling should not just be the province of system developers or IT professionals; it is a key tool for the business analyst. It helps the analyst understand the business rules that govern the creation, manipulation and deletion of data within an organisation and the data required to support process improvements. It also provides a mechanism for communicating the data requirements forward into the design and build of an IT system. The long-established technique of entity relationship modelling is used extensively to model data and the UML class modelling technique is also widely used. In this chapter we look at both of these approaches.
ENTITY RELATIONSHIP DIAGRAMS
Whether they are computerised or not, organisations require clear and accurate knowledge of the data structures that underlie their information requirements. Data is the raw building block of all information systems and the objective of data modelling is to express this structure in a concise and usable way. Data modelling is concerned with identifying and understanding:
- the data items (attributes) which the organisation (or system) needs to keep;
- the grouping of the attributes (into entities);
- the relationships between entities.
The notation used here for entity relationship diagrams (ERDs) is that developed by Harry Ellis and Richard Barker and is also known as the CACI notation (after the consulting firm where they worked at the time). This notation was also adopted for the Oracle CASE tool and within SSADM (the Structured Systems Analysis and Design Method) from its version 4 onwards.
An entity is something that the enterprise recognises in the area under investigation and wishes to collect and store data about. An entity might be:
- Physical – for example, an Order, Customer or Supplier.
- Conceptual – for example, a Booking or an Appointment.
- Active – for example, a Meeting or a Course.
Entities are represented on the model by a box. Each entity has a meaningful name, normally a noun, which is always singular. It is important to distinguish between what are called the ‘entity type’ and the ‘entity occurrence’. For example, if the entity type is Book then the entity occurrence is a specific instance of a Book, such as Business Analysis or Data Analysis for Data Base Design. The physical equivalent of an entity type is a table, and of entity occurrence a record. We usually talk about ‘entities’ as an abbreviation of ‘entity types’ but specifically refer to entity occurrences. Individual occurrences of an entity must be uniquely identifiable. For example, each customer or order must have a unique identifier such as account-number or order-number.
Attributes
Entities contain and are described by attributes (or more accurately attribute types). For example, the entity Book might be described by the attributes title, author-name, publisher and price. Attributes may also be called data items. An attribute’s physical equivalent is a field. A specific entity occurrence should be uniquely identifiable by the value of an attribute or combination of attributes. For example a Member may be identified by the attribute member-number or a specific Book recognised from the combination of the two attributes author and title. This identifying attribute or combination of attributes is termed the key to the entity. The initial entities and some attributes will be identified from the interview notes, documents and observations made in the fact finding and investigation of the current system. Existing file or database content and information needs also give pointers to system entities and their attributes. Attributes are not generally shown on the entity relationship diagram itself but are typically defined in supporting documentation (entity descriptions) or recorded in a data dictionary.
Relationships
A relationship is a relevant business connection between two entities. A relationship is represented on a data model by a line linking the associated entities. Relationships may be:
- one-to-many (1:m);
- one-to-one (1:1);
- many-to-many (m:m).
It is good practice to name the relationships on the model so as to provide anyone viewing it with more information about the nature of the relationship. This is discussed later in this chapter.
One-to-many relationships
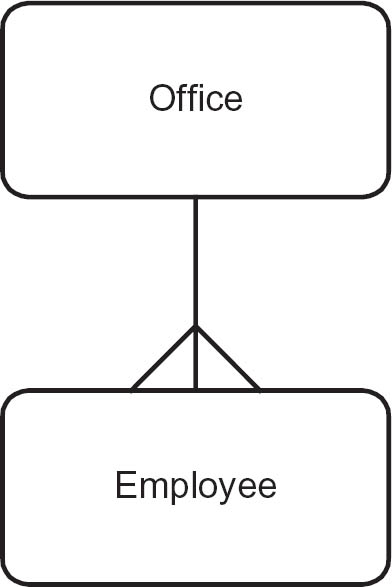
Relationships are often of the degree one-to-many (1:m). For example, an Employee is allocated to one Office, but each Office must have one or more Employees allocated to it. We represent this as shown in Figure 12.5. Here, the notation of a ‘crow’s foot’ is used to indicate that an Office is related to between one and many Employees. At the other end of the line, a solid line indicates that an Employee is related to exactly one Office.
Figure 12.5 One-to-many relationship between two entities
Similarly, in an order processing entity model there appears to be an obvious 1:m relationship between Customer and Order. A customer will place one or many orders but a particular order will only be placed by only one Customer.
One-to-one relationships
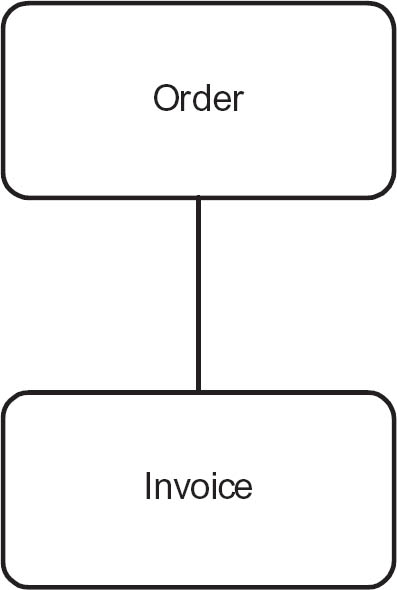
If we were looking at a system to hold data about a company, its offices and the employees working in the offices and each office was allocated to only one employee and each employee allocated to only one office, then the relationship between Office and Employee would be one-to-one. Similarly, as shown in Figure 12.6, an order is related to one invoice and an invoice is concerned with only one order. The relationship between the two entities is exactly one-to-one. A solid line is used to indicate that the relationship is exactly one.
Figure 12.6 One-to-one relationship between two entities
These relationships are not permitted in some data modelling approaches and, where this is the case, it is usually suggested that the two entities are merged. If this happens, one of the identifiers is selected to identify the merged set and the entity is named accordingly. An identifier is the attribute or set of attributes used to identify the entity. The identifier that is created first is usually used to identify the entity created from the merged entities. If the Order and Invoice entities from the example above were merged, the identifier for the Order entity is likely to be the chosen identifier as the order is created before the Invoice.
Optionality
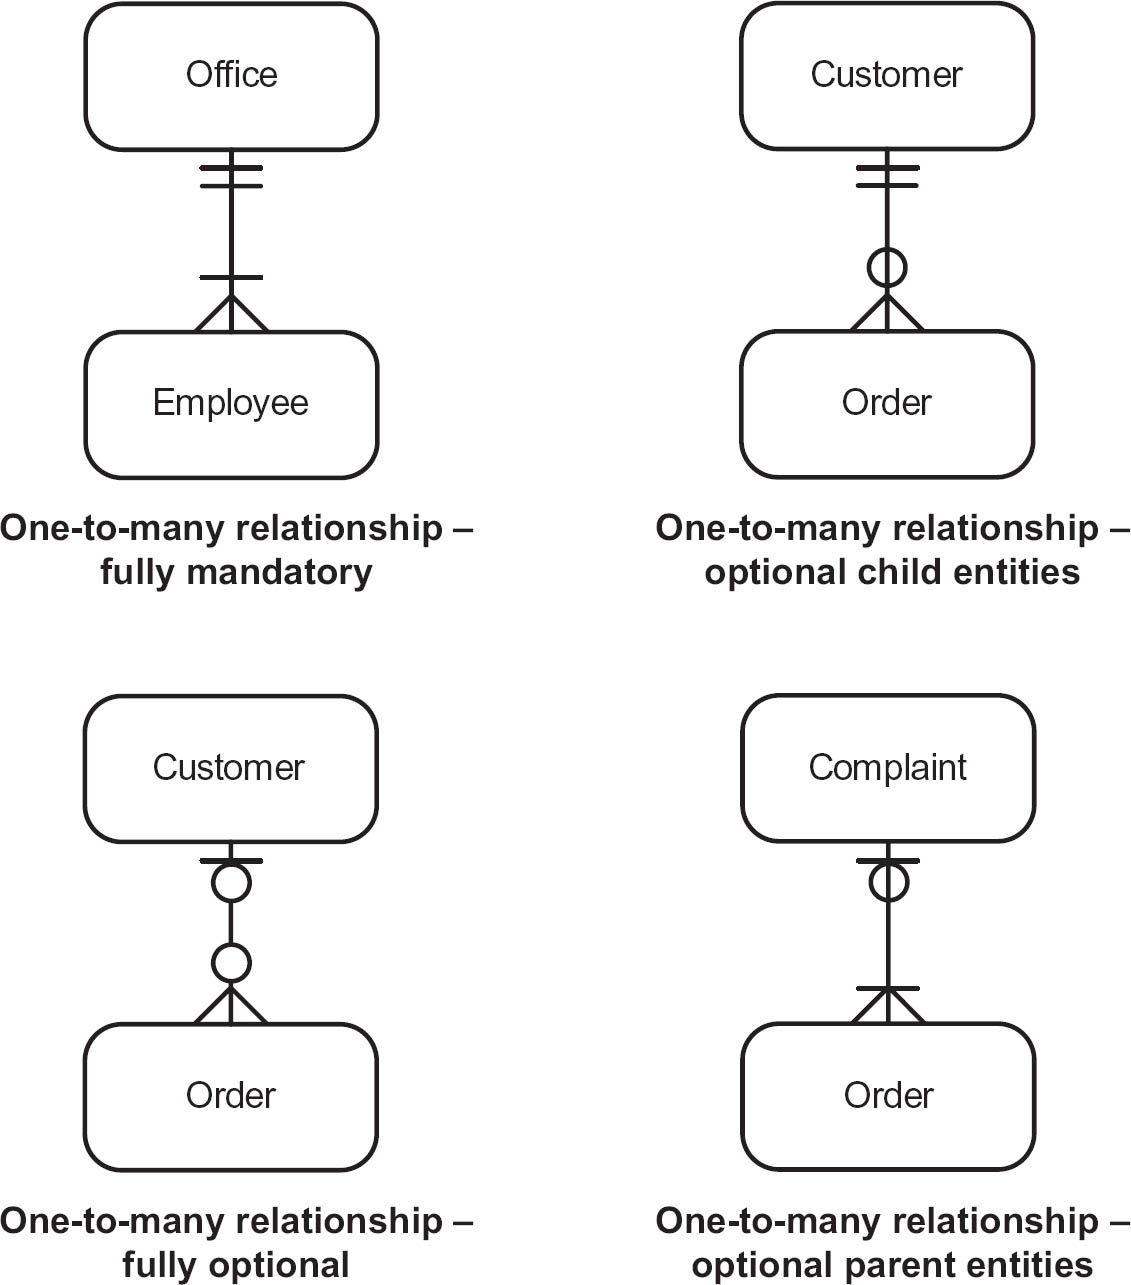
More detailed information about the business rules that underpin the data model is represented by including optionality in the relationship between two entities. The optionality of the relationship describes whether or not the entities at both ends of the relationship must always co-exist or whether one entity can exist without the other entity. Where there is not optionality and both entities must always co-exist, the relationship is drawn using a solid line. In the examples in Figures 12.5 and 12.6, the entities are joined by a solid line. This indicates that both entities must exist and that neither can be stored on a system without the other being present; this is sometimes called a fully mandatory relationship. Another example of this type of relationship is shown in Figure 12.7. In this case, each Order input to the system must always have at least one Order line and each Order line must be related to exactly one Order.
Figure 12.7 Fully mandatory one-to-many relationship

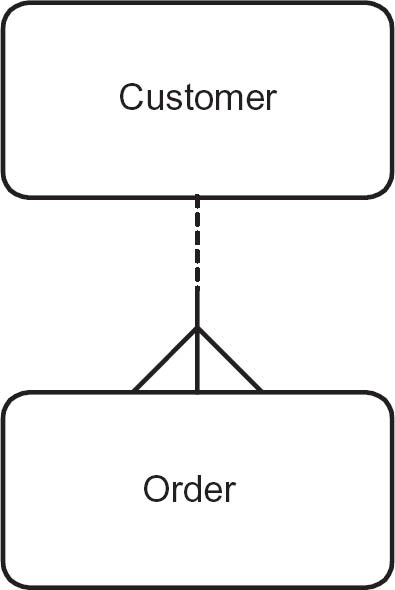
The complete opposite of a fully mandatory relationship occurs where a relationship is fully optional. This means that both entities can exist completely independently of each other. In the example in Figure 12.8 the relationship is using a dotted line. This indicates that an Order can be placed without a Customer call being made and a Customer call need not result in an Order.
Figure 12.8 Fully optional one-to-many relationship

The remaining two alternatives show how relationships need to be analysed in two directions: from the ‘one’ end of the relationship, known as the parent or master entity, to the ‘many’ end of the relationship, known as the child or detail entity. The first situation is where a parent entity can exist without any child entities but a child entity must have a parent. In the example in Figure 12.9 we can see that a Customer may not have placed any Orders as yet, but an Order must always be placed by a Customer.
Figure 12.9 Mandatory parent entity with optional child entity
The second situation is the opposite of this, where the parent entity must be linked to at least one child, but the child entities can exist without a parent. The example in Figure 12.10 shows that an Order need not be related to any Complaints but a Complaint must concern at least one Order.
Figure 12.10 Optional parent entity with mandatory child entity

Many-to-many relationships
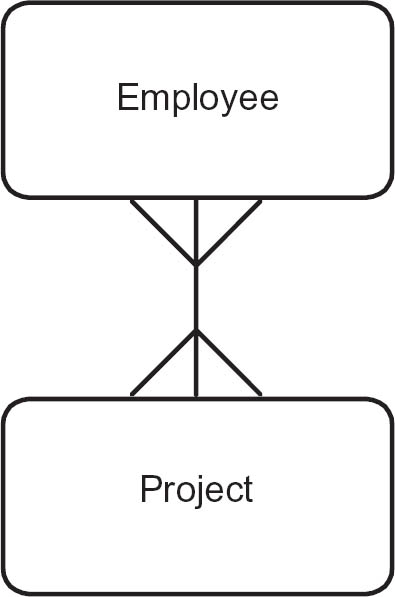
Many-to-many (m:m) relationships occur frequently. For example, as shown in Figure 12.11, an employee may be contracted to work on one or more projects and a project may have one or more employees contracted to it.
Figure 12.11 Many-to-many relationship
Many-to-many relationships are normally decomposed into two 1:m relationships with the definition of an additional link entity. Figure 12.12 shows how the link entity Contract has been added so that the many-to-many relationship can be removed. The extended structure shows the following:
- an Employee is linked to one or more Contracts and a Contract is for exactly one Employee;
- a Project is linked to one or more Contracts and a Contract is for exactly one Project.
Figure 12.12 Resolved many-to-many relationship

This allows all the contract details which an individual employee is associated with to be accessed as detail entity occurrences. It also allows access from the project entity to all the contracts associated with a specific project occurrence. Attributes of the original relationship, for example, ‘date employee contracted to the project’ and ‘duration of each contract’, can now be recorded as attributes of the link entity. Note that the name of the link entity is normally the noun form of the verb which described the relationship, thus the contracted relationship is replaced by a Contract entity.
If we look at an order processing example there appears to be a many-to-many relationship between the entities Product and Order. An order may be for more than one product and we would expect most products to be ordered more than once so they would appear on more than one order. This is solved by introducing a link entity (Order line) which has one-to-many relationships with both of the original entities. (This structure is shown on the diagram in Figure 12.15.)
Many-to-many relationships can be problematic for at least two important reasons:
- First, they may mask omitted entities. Two examples have already been given above.
- Second, most Data Base Management Systems (DBMS) do not support many-to-many relationships.
Relationship names
The nature of the relationship between two entities is clarified by relationship naming and identification. A relationship link phrase is constructed from the perspective of each entity. In the example in Figure 12.13, a Sales region is responsible for zero, one or more Customers.
Figure 12.13 Named relationship between entities

This reads from the Sales region end as:
each Sales region may be responsible for one or more Customers
and from the Customer end:
each Customer must be allocated to exactly one and only one Sales region
Exclusive relationships
In an exclusive relationship, the participation of an entity occurrence in one relationship precludes it from participating in another. This is indicated by an exclusivity arc (Figure 12.14).
Figure 12.14 Exclusive relationships
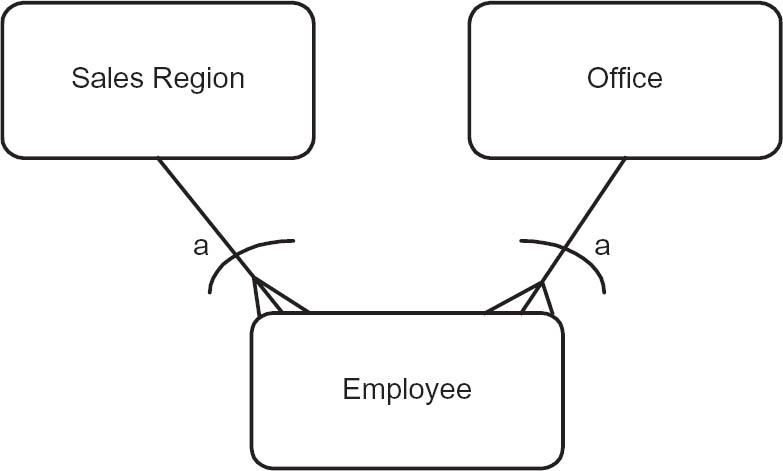
In Figure 12.14, the diagram uses the exclusive arc notation to show that:
- each Employee must be allocated to one and only one Sales region or to one and only one Office;
- each Office is occupied by one or more Employees;
- each Sales region has one or more Employees.
The exclusive relationship may extend to more than two alternatives. For example, if the Employee could be allocated to a Sales region, Office or Data centre, there would be three entities related to Employee and the exclusive arc would extend across all three relationships.
Entity relationship diagram for the sales system
If we put these examples together we can build an entity relationship diagram (Figure 12.15) that reflects the data requirements for our system.
Figure 12.15 Entity relationship diagram for a sales system

Alternative notation
There are many notations used when modelling data. Class modelling from the UML is such an alternative and is described below. A further alternative uses horizontal lines to indicate ‘one’ and circles to indicate optionality. Examples using this notation are shown in Figure 12.16.
Figure 12.16 Alternative data modelling notation
CLASS MODELS
A class model shows graphically the classes in a system and their associations with each other. These models have similarities to entity relationship diagrams and apply many of the same principles. In a business system, a class model captures information about the particular things involved in the organisation’s operations, for example projects, customers and team members for a project control system.
Objects
An object is something that we wish to hold data about because that data is needed within the system we are analysing. For example, an object might be Order number UK74563 and we may wish to hold the following information about this object:
| Order number: | UK74563 |
| Customer: | C66430 |
| Date placed: | 25 August |
| Date fulfilled: | 1 September |
| Total value: | £147.50 |
Objects are sent messages that invoke them to respond in some way, typically by changing data. For example, a message might be sent to the object UK74563 to change the date the order was fulfilled.
Classes
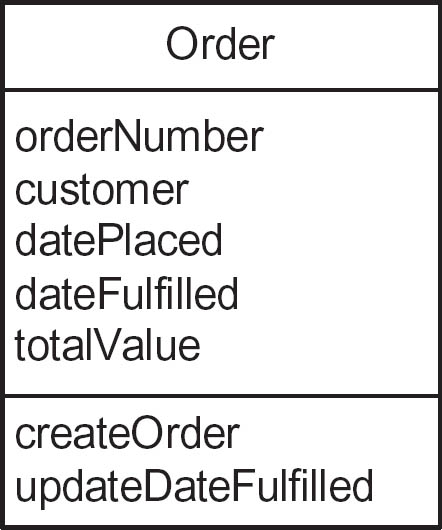
To build a model of the system data we consider classes of objects rather than individual objects. We explained earlier the difference between entity types and entity occurrences. Similarly, in object class modelling, we have classes that provide the generic definition of the data items or attributes, and objects that are the instances of a particular class. Thus order UK74563 is an object of the class Order. The class Order Account has attributes such as orderNumber and totalValue and, as we saw above, the object UK74563 has values associated with these attributes. When we define a class we also include operations that the Order is subject to. These might include updateDateFulfilled and recordDatePlaced. All of the orders in the system will contain these attributes and be subject to the same operations. A class, therefore, is a template for its object instances in the same way that an entity type is the template for its entity occurrences. Every object is an instance of some class that defines the common set of features (attributes and operations) that are shared by all objects in that class.
In the UML, classes are represented by rectangular boxes with three sections. The name of the class is shown in the top part and is a noun. The first letter is capitalised, for example, Order, Customer and Complaint. If the name has more than one word then each word is joined and capitalised in the class name, for example, OrderLine.
The attributes – the individual items of data about the class – are stored in the middle section. The attribute names are usually shown in lower case with constituent parts shown with a capital letter. The first letter of the attribute name is not capitalised, for example, orderNumber, customer and datePlaced.
Operations are stored in the bottom part of the class and are invoked by messages being sent to the class by other classes. It is usual to name the operation in the class with the same name as the message. The detailed content of the operation – what the class will do when that operation is invoked – will be defined in the method associated with the operation; this is usually left to the later stages of the development process.
Attributes held within a class are only accessible to the operations of that class as they are hidden from all other classes in the system. This is known as encapsulation and is an important principle of the object-oriented approach. Any other part of the system that needs to access or modify the data of that class has no need to understand how it is structured. It just sends a message and the receiving class responds appropriately.
For example, in Figure 12.17 the object class Order has the operation updateDateFulfilled which may take place when all of the goods have been despatched to the customer. To enable this to take place a message is sent to the object Order to updateDateFulfilled and the parameters of orderNumber, newDateFulfilled are also sent to indicate the order in question and the new date fulfilled. In the class Order, we have defined an operation also called updateDateFulfilled to respond to the message of the same name. This operation has been specified as ‘replace dateFulfilled with new dateFulfilled’ which uses the value passed in the message to update the date on the appropriate order.
Figure 12.17 Definition of the class ‘Order’
Associations
As in entity relationship modelling, we now need to establish how different classes are linked to each other and the nature of these connections. We call the connections between classes ‘associations’. For instance, an Order class must have an association with an OrderLine class so that the system will be able to identify the items on the order. Figure 12.18 shows this association.
Figure 12.18 Association between two classes

We have already said that classes interact and this is done by the messages moving along the association lines defined in the class model. If there is no association between classes, then they cannot communicate directly.
The class model reflects the business rules that will govern the classes and the operations performed upon them. Multiplicity is used to show the business rules for an association between classes. For example, the multiplicity of the association shown in Figure 12.19 indicates that an Order may include many Order lines but an individual Order line project may only be part of one Order.
Figure 12.19 Association showing one-to-many multiplicity

The multiplicity entries can be extended to show the minimum and maximum values in the association. This is shown using two dots between the minimum and maximum values. For example the asterisk in the example in Figure 12.19 is a simplification of the range 0..* and the ‘1’ is a simplification of 1..1.
The JobSheet to Task association shown in Figure 12.20 shows that an instance of Task has an optional association with JobSheet. In addition, this shows that, although there may be no JobSheets associated with a Task, there is also a maximum of one JobSheet for a given Task.
Figure 12.20 Association showing optional multiplicity

In the example in Figure 12.21, the class Customer has a mandatory association with Order. There must be at least one instance of Order for each instance of Customer (though the asterisk indicates there is no upper limit). An Order is for only one Customer. (This shows, by the way, how associations are manifestations of business rules, in this case that in this organisation a customer is defined as someone who has placed at least one order with us.)
Figure 12.21 Association showing mandatory one-to-many multiplicity

In some circumstances the actual minimum and maximum values may be defined. For example, if we assume there is a business rule that no more than 20 people can be allocated to a project this would be modelled as shown in Figure 12.22.
Figure 12.22 Association showing defined range of multiplicity

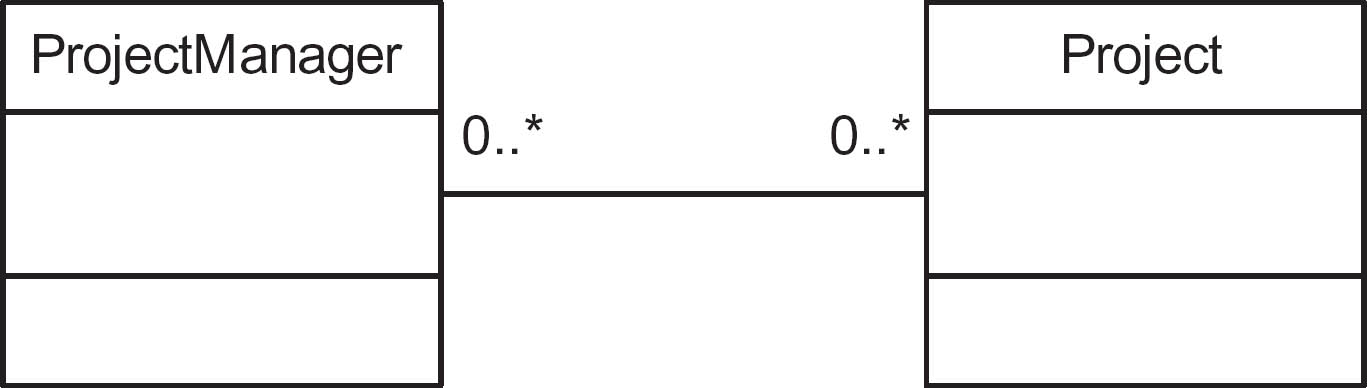
The class model supports associations where the multiplicity is many to many. For example, Figure 12.23 shows that a Project may have many ProjectManagers and each ProjectManager may control many Projects. Should this happen, it is likely that this would occur over a period of time. The zeroes on this diagram indicate that a ProjectManager may be newly appointed and thus not yet have been allocated a Project; and that a Project may be set up without knowing the name of the ProjectManager.
Figure 12.23 Association with many:many multiplicity
In some circumstances, the association between the classes also holds information. If we consider the example in Figure 12.23, we would probably want to know which ProjectManager was in charge of a project during a particular period. To do this we create an association class called Assignment to hold the start and end date for each ProjectManager. Figure 12.24 shows this additional class.
Figure 12.24 An association class

In this example, there is only one instance of the class Assignment for each combination of Project and ProjectManager. If there were more than one – for example, if a ProjectManager could be reassigned to a Project they had previously left – then it would be necessary to convert this association class into a class in its own right.
Generalisation and inheritance
Sometimes, as we get further into the analysis, we discover that there are different sub-categories for a class. For instance, a general and a private are both soldiers but while some of the information that we would like to hold about them is the same, other information may differ greatly. UML handles this situation through a concept known as generalisation and this is illustrated in Figure 12.25.
Figure 12.25 Generalisation structure

Figure 12.25 shows that some attributes are shared by all employees, whether they are office-based or work in sales. So, these are shown in the general class called Employee. However, other details are very different for office employees and sales employees so different attributes are held for them. The upward-facing arrow indicates that these two sub-classes inherit the attributes of the generalised class.
When we come to identify associations with other classes, we may find that some are with the generalisation class and some are only with one or either of the sub-classes. This is illustrated in Figure 12.26.
Class model for the sales system
By way of comparing the two different approaches, Figure 12.26 is the sales system shown as a UML class model that was previously modelled as an entity relationship diagram in Figure 12.15.
The UML notation does not cover the ‘exclusive relationship’ between employee and office or region shown in Figure 12.15 and so, in Figure 12.26, this is addressed in a different way. CustomerCall is associated with the generalised class Employee and then a specific type of employee, OfficeEmployee, is associated with Office. Similarly, SalesPerson is associated with SalesRegion. This shows how a particular issue can be tackled in different ways depending on the method or notation that is being used.
Figure 12.26 Class model for a sales system

MODELLING IN AGILE APPROACHES
It is sometimes thought that models are not used in projects that follow the Agile approach because, in these projects, there is not the need to fully define the system ‘up front’. Indeed, the Agile Manifesto stated that working software is valued over comprehensive documentation.
However, the Manifesto does not say that there is no value in documentation, only that working software is more valuable. It is our view that, even in an Agile project, models can be useful to help the user community understand the scope and scale of the proposed system before detailed development commences. In addition, once the system is delivered, there is the question of ongoing maintenance to consider and models can be invaluable to the maintenance team, as described in the next section.
THE USE OF MODELS IN SYSTEM MAINTENANCE
It is a fact that, if the lifetime cost of an IT system is considered, by far the bulk of the expenditure – 70 per cent according to some authorities – is incurred after the system has been implemented. This is because errors are discovered in the software that have to be fixed and, of course, the users require changes to the system to meet their changing business needs.
A common problem that faces support and maintenance teams – which often consist of different people and sometimes even different firms than originally built the system – is understanding the overall scope of a system and how it all fits together. In addition, although inspection of the code can usually reveal how a system works, the business reasons for it being built that way are often lost in the mists of time.
It is here that models can prove invaluable, whether the system was created using Agile or more conventional development methods. Use case diagrams can help the support staff to understand the overall shape of the system and data models, either ERDs or class models, capture the business rules that control the creation, manipulation and deletion of data.
SUMMARY
This chapter has provided an introduction to some of the key techniques used to model system requirements. The benefit of using models is that they provide an unambiguous view of the system, albeit from one specific perspective. Another benefit is that these views may be compared and cross-checked. So we might develop a use case diagram and cross-check it against a model of the data in order to identify any gaps such as missing data items or use cases. The models also help to generate further questions and improve our understanding of the business requirements and the business rules to be implemented in the system.
FURTHER READING
Arlow, J and Neustadt, I. (2005) UML and the Unified Process, 2nd edn. Addison-Wesley, Upper Saddle River, NJ.
Cadle, J., Paul, D. and Turner, P. (2014) Business Analysis Techniques: 99 essential tools for success, 2nd edn. BCS, Swindon.
Simsion, G. C. and Witt, G. C. (2004) Data Modelling Essentials, 3rd edn. Morgan Kaufmann, Burlington, MA.
Skidmore, S. and Eva, M. (2003) Introducing Systems Development. Palgrave Macmillan, Basingstoke.
Yeates, D. and Wakefield, T. (2003) Systems Analysis and Design. FT Prentice Hall, Harlow.