
Chapter 8. Storm internals
This chapter covers
- How an executor works under the covers
- How tuples are passed between executors
- Storm’s internal buffers
- Overflow and tuning of Storm’s internal buffers
- Routing and tasks
- Storm’s debug log output
Here we are, four chapters into covering Storm in production. We’ve explained how you can use the Storm UI to understand what’s going on in your topologies, how to use that information to tune your topologies, and how to diagnose and treat cross-topology contention issues. We’ve explored a number of tools you can put to good use. In this chapter, we’ll introduce you to one more: a deeper understanding of Storm’s internals.
Why do we think this is important? Well, in the previous three chapters we’ve given you the tools and strategies for handling issues you’re likely to encounter, but we can’t know every possible problem you will encounter. Each Storm cluster is unique; your combination of hardware and code is bound to encounter issues we’ve never seen and, perhaps, that other people haven’t seen either. The deeper the understanding you have of how Storm works, the better equipped you’ll be to handle such issues. The intent of this chapter, unlike the previous chapter, isn’t to provide solutions to specific problems.
To become a master of tuning Storm, debugging Storm issues, designing your topologies for maximum efficiency, and all the other myriad tasks that are part of running a production system, you need to have a deep understanding of the tool you’re using. We aim in this chapter to take you deep into the abstractions that make up Storm. We aren’t going to take you all the way down to the bottom, because Storm is a living project that’s actively being developed and a lot of that development is going on at the core. But there’s a level of abstraction deeper than any we’ve covered so far, and it’s this level of abstraction that we’ll endeavor to familiarize you with. How you’ll deploy the knowledge you get from this chapter we can’t say, but we know you won’t master Storm until you have a firm grasp of the internals that are the subject of this chapter.
Note
Some of the terminology we use throughout this chapter doesn’t map directly to the verbiage in the Storm source code but is true to the spirit. This is intentional, because the focus should be on how the internals work, not necessarily how they’re named.
To focus on Storm’s internals rather than the details of a new use case, we’re going to bring back an old friend, the commit count topology from chapter 2. Let’s go through a quick rundown of this topology just in case you’ve forgotten.
8.1. The commit count topology revisited
The commit count topology provides a simple topology (one spout and two bolts) we can use to explain Storm’s internals within the context of a particular use case but without getting bogged down with the details of the use case. Having said that, there are a few additional qualifiers we’ll add to this topology for teaching purposes. But before we get to those qualifiers, let’s quickly rehash the topology itself.
8.1.1. Reviewing the topology design
As you’ll recall from chapter 2, the commit count topology is broken down into (1) one spout that’ll read commits from a feed, and (2) two bolts that’ll extract the email from the commit message and store counts for each email, respectively. This can all be seen in figure 8.1.
Figure 8.1. Commit count topology design and flow of data between the spout and bolts

This design is straightforward and easy to understand. As such, it provides us with a nice scenario to delve into the internals of Storm. One thing we’ll do differently in this chapter is present the topology deployed to a remote Storm cluster, as opposed to having it run in local mode. Let’s discuss why this is needed and how our topology may look when deployed to a remote cluster with multiple worker nodes.
8.1.2. Thinking of the topology as running on a remote Storm cluster
Presenting the topology as running on a remote Storm cluster is essential for this chapter, because the Storm internals we want to cover exist only in a remote cluster setup. For this, we’ll say our topology is running across two worker nodes. Doing this allows us to explain what happens when tuples are passed between components within the same worker process (JVM) as well as across worker processes (from one JVM to another). Figure 8.2 illustrates the two worker nodes along with specifics on where each spout and bolt is executing. This diagram should look familiar, as we presented something similar in chapter 5 when providing a hypothetical configuration of the credit card authorization topology.
Figure 8.2. Commit count topology running across two worker nodes, with one worker process executing a spout and bolt and another worker process executing a bolt

8.1.3. How data flows between the spout and bolts in the cluster
Let’s trace the flow of a tuple through the topology, much as we did in chapter 2. But rather than showing the data flow from the viewpoint of figure 8.1, we’ll show it from the viewpoint of data being passed between instances of our spout and bolts across executors and worker processes (figure 8.3).
Figure 8.3. Breaking down the flow of data through the topology into six sections, each of which highlights something different within an executor or how data is passed between executors

Figure 8.3 illustrates nicely how the tuples will flow between instances of our spout and bolts across threads (executors) within a single JVM (worker process) along with data flowing between worker nodes to a completely separate JVM (worker process). Think of figure 8.3 as the 10,000-foot view of how tuples are being passed between components. The goal of this chapter is to dive down much deeper into what’s happening in figure 8.3, so let’s do exactly that, following the flow of data within and between executors in our scenario.
8.2. Diving into the details of an executor
In previous chapters, we’ve described executors as a single thread running on a JVM. That has served us well until now. In our day-to-day reasoning about our own topologies, we usually think of an executor at that level of abstraction as well. But an executor is more than a single thread. Let’s discuss what we mean by this, starting with the executor running our spout instance that reads data from a data source.
8.2.1. Executor details for the commit feed listener spout
Data enters the commit count topology via the commit feed listener spout that listens to a feed of data containing individual commit messages. Figure 8.4 illustrates where we are in our data flow for the topology.
Figure 8.4. Focusing on data flowing into the spout

There’s a bit more to this executor than a single thread. It’s actually two threads and one queue. The first thread is what we call the main thread and is primarily responsible for running user-supplied code; in this instance, it’s the code we wrote in nextTuple. The second thread is what we’ll call the send thread, which we’ll talk about shortly in the next section, and it handles transferring tuples to the next bolt in the topology.
In addition to the two threads, we have a single queue for transferring emitted tuples out of the executor. Think of this queue as a post-execute-spout function. This queue is designed for high-performance messaging between executors. It’s achieved by having the queue implementation rely on a library known as the LMAX Disruptor.[1] All you need to know about a disruptor queue for now is that Storm uses it for the internal executor queue implementations. Figure 8.5 illustrates this more detailed understanding of the executor for our spout, with two threads and one queue.
1 The LMAX Disruptor is a high-performance inter-thread messaging library. It’s an open source project available at http://lmax-exchange.github.io/disruptor.
Figure 8.5. The spout reads messages off the queue containing commit messages and converts those messages into tuples. The main thread on the executor handles emitted tuples, passing them to the executor’s outgoing queue.
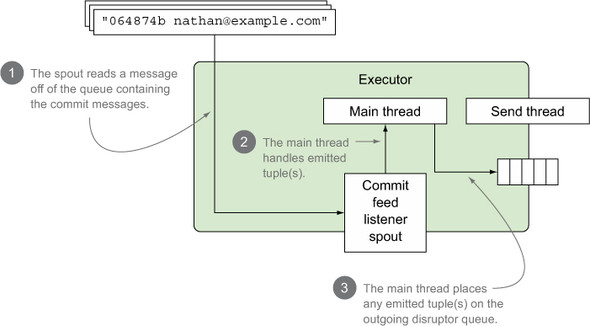
The illustration in figure 8.5 covers data being read in by the spout instance and the main thread taking the tuple emitted by the spout and placing it on the outgoing queue. What hasn’t been covered is what happens once the emitted tuple has been placed on the outgoing queue. This is where the send thread comes into play.
8.2.2. Transferring tuples between two executors on the same JVM
Our tuple has been placed on the spout’s outgoing disruptor queue. Now what? Before we get into what happens here, let’s take a look at figure 8.6, which shows where we are in our topology’s data flow.
Figure 8.6. Focusing on passing tuples within the same JVM

Once the data has been placed on the spout’s outgoing disruptor queue, the send thread will read that tuple off the outgoing disruptor queue and send it to the appropriate executor(s) via a transfer function.
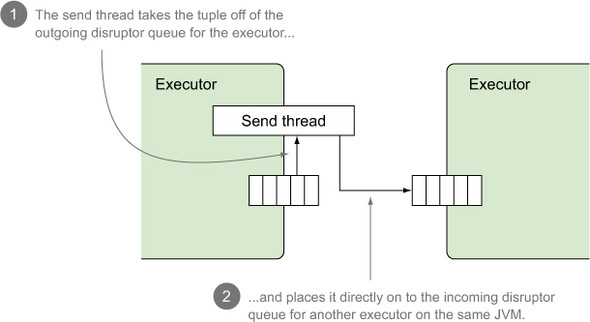
Because the commit feed listener spout and email extractor bolt are both on the same JVM, this transfer function will execute a local transfer between executors. When a local transfer occurs, the executor’s send thread publishes outgoing tuples to the next executor directly. Both executors here are on the same JVM, so there’s little to no overhead during the send, making this an extremely fast type of transfer function. This is illustrated in more detail in figure 8.7.
Figure 8.7. A more detailed look at a local transfer of tuples between the commit feed listener spout and the email extractor bolt
How exactly does the executor for our first bolt receive tuples directly? This is covered in the next section, where we break down the executor for the email extractor bolt.
8.2.3. Executor details for the email extractor bolt
So far we’ve covered our spout reading a commit message from a feed of data and emitting a new tuple for each individual commit message. We’re at the point where our first bolt, the email extractor, is ready to process an incoming tuple. Figure 8.8 highlights where we are in our data flow.
Figure 8.8. Focusing on a bolt that emits a tuple

You probably have some idea of what the executors for our bolts look like given that we’ve already covered the executor for a spout. The only real difference between executors for spouts and for bolts is that an executor for a bolt has an additional queue: the queue for handling incoming tuples. This means our bolt’s executor has an incoming disruptor queue and a main thread that reads a tuple off the incoming disruptor queue and processes that tuple, resulting in zero or more tuples to be emitted. These emitted tuples are placed on the outgoing disruptor queue. Figure 8.9 breaks down the details.
Figure 8.9. The executor for our bolt, with two threads and two queues

Once the email extractor bolt has processed the tuple, it’s ready to be sent to the next bolt down the line, the commit counter bolt. We’ve already discussed what happens when a tuple is sent between the commit feed listener spout and the email extractor bolt. This happens with a local transfer. But we’re in a different situation when sending data between the email extractor bolt and the commit counter bolt. The bolt instances are running on different JVMs. Let’s discuss what happens in this scenario next.
8.2.4. Transferring tuples between two executors on different JVMs
As we mentioned previously, the email extractor and commit counter bolts are running on separate JVMs. Figure 8.10 shows you exactly where we are in the data flow for our topology.
Figure 8.10. Focusing on sending tuples between JVMs

When a tuple is emitted to an executor running on a separate JVM, the sending executor’s send thread will execute a transfer function that performs what we call a remote transfer. A remote transfer is more involved than a local transfer. What happens when Storm needs to send tuples from one JVM to another? The first step in the process is to serialize our tuple for transport. Depending on your tuple, this could be a rather expensive operation. When serializing tuples, Storm attempts to look up a Kryo serializer for that object and ready it for transport. Lacking a Kryo serializer, Storm will fall back on standard Java object serialization. Kryo serialization is far more efficient than Java serialization, so if you care about pulling every last bit of performance out of your topologies, you’ll want to register custom serializers for your tuples.
Once a tuple has been serialized for inter-JVM transport, our executor’s send/transfer thread publishes it to yet another disruptor queue. This queue is the transfer- queue for our entire JVM. Any time an executor on this JVM needs to transfer tuples to executors on other JVMs, those serialized tuples will be published to this queue.
Once a tuple is on this queue, another thread, the worker process’s send/transfer thread, picks it up and, via TCP, sends it over the network to its destination JVM.
At the destination JVM, another thread, the worker process’s receive thread, is waiting to receive tuples that it in turn passes off to yet another function, the receive function. The worker receive function, much like an executor’s transfer function, is responsible for routing the tuple to the correct executor. The receive thread publishes our tuple to the incoming disruptor queue where it’s available to be picked up by the executor’s primary thread for processing. This entire process can be seen in figure 8.11.
Figure 8.11. The steps that occur during a remote transfer of a tuple between executors on different JVMs

In our commit counter example, an email address such as [email protected] was extracted from a commit by our email extractor bolt and placed on the executor’s transfer queue, where the executor’s send thread picked it up and passed it to the transfer function. There it was serialized for transport and placed on the worker’s transfer queue. Another thread then picked up the transfer and sent it via TCP to our second worker, where the receive thread accepted it and, via the receive function, routed it to the correct executor by placing it on that executor’s incoming disruptor queue.
In this section, we’ve used the term TCP to discuss connections between JVMs that make up a Storm cluster. As of the current version of Storm, network transport is provided by Netty, a powerful framework designed to make it easy to build high-performance- asynchronous network applications. It has a wealth of settings that allow you to tune its performance.
For a standard Storm installation, you shouldn’t need to tweak any Netty settings exposed by Storm. If you find yourself running into Netty performance issues, as with any other settings, be prepared to measure before and after changes.
Providing enough information to allow you to confidently wade into tuning Netty is beyond the scope of this book. If you’re interested in learning more about Netty, we urge you to get Netty in Action (Manning, 2015) by Netty committer Norman Maurer.
8.2.5. Executor details for the email counter bolt
The executor for this bolt is similar to the executor for our previous bolt, but because this bolt doesn’t emit a tuple, no work needs to be done by the executor’s send thread. Figure 8.12 highlights where we are in our flow of a tuple between executors.
Figure 8.12. Focusing on a bolt that does not emit a tuple

The details of what happens within this executor can be seen in figure 8.13. Notice that the number of steps is reduced, because we aren’t emitting tuples in this bolt.
Figure 8.13. The executor for the email counter bolt with a main thread that pulls a tuple off the incoming disruptor queue and sends that tuple to the bolt to be processed

Our data has now managed to flow from the spout where it started through the email counter bolt. Its life cycle is almost done. It’ll be deserialized and processed, and the count for that email address will be updated. Our email counter bolt doesn’t emit a new tuple—it acks its incoming tuple.
8.3. Routing and tasks
A few times in the book, we’ve explained something only to later admit we lied via omission in order to explain the basics of a concept. And so it is again with our explanation that we’ve given so far in this chapter. We’ve omitted a very important part of the conversation. But don’t worry; now that you have a handle on the core parts of Storm, we can discuss tasks and routing.
Way back in chapter 3, we introduced executors and tasks. Figure 8.14 should look familiar—it’s the figure breaking down a worker node as a JVM running an executor with a task (spout/bolt instance), but updated with your current understanding of how an executor works.
Figure 8.14. A worker process broken down with its internal threads and queue along with an executor and its internal threads, queues, and a task

Let’s dig a little bit more into tasks. As we stated in chapter 3, an executor can have one or more tasks, where the executor is responsible for “executing” the user logic that’s in the task. How does this work when an executor has multiple tasks (figure 8.15)?
Figure 8.15. An executor with multiple tasks

This is where routing comes into the picture. Routing in this context means how a worker process’s receive thread (remote transfer) or an executor’s send thread (local transfer) sends a tuple to its correct next location (task). It’s a multistep process that’ll be easier with a concrete example. We’ll use the email extractor as an example. Figure 8.16 illustrates what happens after the email extractor’s main thread has run its execute method and a tuple has been emitted.
Figure 8.16. Mapping out the steps taken when determining the destination task for an emitted tuple

Figure 8.16 should look somewhat familiar. It includes some of the internal queues and threads we’ve been discussing along with annotations for the steps that are taken when determining which task is supposed to execute an emitted tuple. The figure references a task ID and tuple pair, which comes in the form of an object of type TaskMessage:
public class TaskMessage {
  private int _task;
  private byte[] _message;
  ...
}
This brings our explanation of Storm’s internal queues to a close. We’ll now move on to how these queues may overflow and some ways to address such overflow.
8.4. Knowing when Storm’s internal queues overflow
We’ve covered an awful lot in a relatively short period of time. By now, you should have a decent grasp of what constitutes an executor. But before we get into the details of debug logs, we want to bring you back to the three queues internal to Storm we’ve discussed so far.
8.4.1. The various types of internal queues and how they might overflow
In our discussion of executors, we identified three queues that are internal to Storm:
- An executor’s incoming queue
- An executor’s outgoing queue
- The outgoing queue that exists on a worker node
We love to talk about troubleshooting and what can go wrong, so we pose the question: What would it take to overflow each of those queues?
Go ahead. Take a minute. We’ll wait. For a queue to overflow, anything producing data that goes on to the queue has to be generating that data faster than it can be consumed. It’s the relationship between producers and consumers that we want to focus on. We’ll start by looking at the executor’s incoming queue.
Executor’s incoming queue
This queue receives tuples from the spout/bolt preceding it in the topology. If the preceding spout/bolt is producing tuples at a faster rate than the consuming bolt can process them, you’re going to have an overflow problem.
The next queue a tuple will encounter is the executor’s outgoing transfer queue.
Executor’s outgoing transfer queue
This one is a bit trickier. This queue sits between an executor’s main thread, executing user logic, and the transfer thread that handles routing the tuple to its next task. In order for this queue to get backed up, you’d need to be processing incoming tuples faster than they can be routed, serialized, and so forth. That’s a pretty tall order—one we’ve never actually experienced ourselves—but we’re sure someone has had it happen.
If we’re dealing with a tuple that’s being transferred to another JVM, we’ll run into the third queue, the worker process’s outgoing transfer queue.
Worker process’s outgoing transfer queue
This queue receives tuples from all executors on the worker that are bound for another, different worker process. Given enough executors within the worker process producing tuples that need to be sent over the network to other worker processes, it’s quite possible that you could overflow this buffer. But you’re probably going to have to work hard to do it.
What happens if you start to overflow one of these buffers? Storm places the overflowing tuples in a (hopefully) temporary overflow buffer until there’s space on a given queue. This will cause a drop in throughput and can cause a topology to grind to a halt. If you’re using a shuffle grouping where tuples are distributed evenly among tasks, this should present a problem that you’d solve using the tuning techniques from chapter 6 or the troubleshooting tips from chapter 7.
If you aren’t distributing tuples evenly across your tasks, issues will be harder to spot at a macro level and the techniques from chapters 6 and 7 are unlikely to help you. What do you do then? You first need to know how to tell whether a buffer is overflowing and what can be done about it. This is where Storm’s debug logs can help.
8.4.2. Using Storm’s debug logs to diagnose buffer overflowing
The best place to see whether any of Storm’s internal buffers are overflowing is the debug log output in Storm’s logs. Figure 8.17 shows a sample debug entry from a Storm log file.
Figure 8.17. Snapshot of a debug log output for a bolt instance

In figure 8.17 we’ve highlighted the lines related to the send/receive queues, which present metrics about each of those queues respectively. Let’s take a more detailed look at each of those lines.
The example in figure 8.18 shows two queues that are nowhere near overflowing, but it should be easy to tell if they are. Assuming you’re using a shuffle grouping to distribute tuples evenly among bolts and tasks, checking the value for any task of a given bolt should be enough to determine how close you are to capacity. If you’re using a grouping that doesn’t evenly distribute tuples among bolts and tasks, you may have a harder time quickly spotting the problem. A little automated log analysis should get you where you need to be, though. The pattern of the log entries is well established, and pulling out each entry and looking for population values that are at or near capacity would be a matter of constructing and using an appropriate tool.
Figure 8.18. Breaking down the debug log output lines for the send/receive queue metrics

Now that you know how to determine whether one of Storm’s internal queues is overflowing, we’re going to show you some ways to stop the overflow.
8.5. Addressing internal Storm buffers overflowing
You can address internal Storm buffers overflowing in one of four primary ways. These aren’t all-or-nothing options—you can mix and match as needed in order to address the problem:
- Adjust the production-to-consumption ratio
- Increase the size of the buffer for all topologies
- Increase the size of the buffer for a given topology
- Set max spout pending
Let’s cover them one at a time, starting with adjusting the production-to-consumption ratio.
8.5.1. Adjust the production-to-consumption ratio
Producing tuples slower or consuming them faster is your best option to handle buffer overflows. You can decrease the parallelism of the producer or increase the parallelism of the consumer until the problem goes away (or becomes a different problem!). Another option beyond tweaking parallelism is to examine your user code in the consuming bolt (inside the execute method) and find a way to make it go faster.
For executor buffer-related problems, there are many reasons why tweaking parallelism isn’t going to solve the problem. Stream groupings other than shuffle grouping are liable to result in some tasks handling far more data than others, resulting in their buffers seeing more activity than others. If the distribution is especially off, you could end up with memory issues from adding tons of consumers to handle what is in the end a data distribution problem.
When dealing with an overflowing worker transfer queue, “increasing parallelism” means adding more worker processes, thereby (hopefully) lowering the executor-to-worker ratio and relieving pressure on the worker transfer queue. Again, however, data distribution can rear its head. If most of the tuples are bound for tasks on the same worker process after you add another worker process, you haven’t gained anything.
Adjusting the production-to-consumption ratio can be difficult when you aren’t evenly distributing tuples, and any gains you get could be lost by a change in the shape of the incoming data. Although you might get some mileage out of adjusting the ratio, if you aren’t relying heavily on shuffle groupings, one of our other three options is more likely to help.
8.5.2. Increase the size of the buffer for all topologies
We’ll be honest with you: this is the cannon-to-kill-a-fly approach. The odds of every topology needing an increased buffer size are low, and you probably don’t want to change buffer sizes across your entire cluster. That said, maybe you have a really good reason. You can change the default buffer size for topologies by adjusting the following values in your storm.yaml:
- The default size of all executors’ incoming queue can be changed using the value topology.executor.receive.buffer.size
- The default size of all executors’ outgoing queue can be changed using the value topology.executor.send.buffer.size
- The default size of a worker process’s outgoing transfer queue can be changed using the value topology.transfer.buffer.size
It’s important to note that any value you set the size of a disruptor queue buffer to has to be set to a power of 2—for example, 2, 4, 8, 16, 32, and so on. This is a requirement imposed by the LMAX disruptor.
If changing the buffer size for all topologies isn’t the route you want to go, and you need finer-grained control, increasing the buffer sizes for an individual topology may be the option you want.
8.5.3. Increase the size of the buffer for a given topology
Individual topologies can override the default values of the cluster and set their own size for any of the disruptor queues. This is done via the Config class that gets passed into the StormSubmitter when you submit a topology. As with previous chapters, we’ve been placing this code in a RemoteTopologyRunner class, which can be seen in the following listing.
Listing 8.1. RemoteTopologyRunner.java with configuration for increased buffer sizes
publc class RemoteTopologyRunner {
  public static void main(String[] args) {
    ...

    Config config = new Config();
    ...
    config.put(Config.TOPOLOGY_EXECUTOR_RECEIVE_BUFFER_SIZE,
               new Integer(16384));
    config.put(Config.TOPOLOGY_EXECUTOR_SEND_BUFFER_SIZE,
               new Integer(16384));
    config.put(Config.TOPOLOGY_TRANSFER_BUFFER_SIZE,
               new Integer(32));

    StormSubmitter.submitTopology("topology-name",
                                  config,
                                  topology);
  }
}
This brings us to our final option (one that should also be familiar): setting max spout pending.
8.5.4. Max spout pending
We discussed max spout pending in chapter 6. As you may recall, max spout pending caps the number of tuples that any given spout will allow to be live in the topology at one time. How can this help prevent buffer overflows? Let’s try some math:
- A single spout has a max spout pending of 512.
- The smallest disruptor has a buffer size of 1024. 512 < 1024
Assuming all your bolts don’t create more tuples than they ingest, it’s impossible to have enough tuples in play within the topology to overflow any given buffer. The math for this can get complicated if you have bolts that ingest a single tuple but emit a variable number of tuples. Here’s a more complicated example:
- A single spout has a max spout pending of 512.
- The smallest disruptor has a buffer size of 1024.
One of our bolts takes in a single tuple and emits 1 to 4 tuples. That means the 512 tuples that our spout will emit at a given point in time could result in anywhere from 512 to 2048 tuples in play within our topology. Or put another way, we could have a buffer overflow issue. Buffer overflows aside, setting a spout’s max spout pending value is a good idea and should always be done.
Having addressed four solutions for handling buffers overflowing, we’re going to turn our attention to tweaking the sizes of these buffers in order to get the best performance possible in your Storm topologies.
8.6. Tweaking buffer sizes for performance gain
Many blog posts are floating around that detail performance metrics with Storm that are based in part on changing the sizes of internal Storm disruptor buffers. We’d be remiss not to address this performance-tuning aspect in this chapter. But first, a caveat: Storm has many internal components whose configuration is exposed via storm.yaml and programmatic means. We touched on some of these in section 8.5. If you find a setting and don’t know what it does, don’t change it. Do research first. Understand in general what you’re changing and think through how it might impact throughput, memory usage, and so forth. Don’t change anything until you’re able to monitor the results of your change and can verify you got your desired result.
Lastly, remember that Storm is a complicated system and each additional change builds on previous ones. You might have two different configuration changes—let’s call them A and B—that independently result in desirable performance changes but when combined result in a degenerate change. If you applied them in the order of A and then B, you might assume that B is a poor change. But that might not be the case. Let’s present a hypothetical scenario to show you what we mean:
- Change A results in 5% throughput improvement.
- Change B results in 10% throughput improvement.
- Change A and B result in a 2% drop in throughput.
Ideally, you should use change B, not change A, for your best performance. Be sure to test changes independently. Be prepared to test in both an additive fashion, applying change B to an existing configuration that already involves A, as well as applying B to a “stock” Storm configuration.
All of this assumes that you need to wring every last bit of performance out of your topology. We’ll let you in on a secret: we rarely do that. We spend enough time to get acceptable performance in a given topology and then call it a day and move on to other work. We suspect most of you will as well. It’s a reasonable approach, but we still feel it’s important, if you’re ramping up your Storm usage, to learn about the various internals and start tweaking, setting, and understanding how they impact performance. Reading about it is one thing—experiencing it firsthand is entirely different.
That concludes our chapter on Storm’s internals. We hope you’ve found some value in knowing a bit more about what happens “under the covers” with Storm’s internal buffers, how those buffers might overflow, how to handle the overflow, and some thoughts on how to approach performance tuning. Next we’ll switch gears and cover a high-level abstraction for Storm: Trident.
8.7. Summary
In this chapter, you learned that
- Executors are more than just a single thread and consist of two threads (main/sender) along with two disruptor queues (incoming/outgoing).
- Sending tuples between executors on the same JVM is simple and fast.
- Worker processes have their send/transfer thread, outgoing queue, and receive thread for handling sending tuples between JVMs.
- Each of the internal queues (buffers) can overflow, causing performance issues within your Storm topologies.
- Each of the internal queues (buffers) can be configured to address any potential overflow issues.