
The Customer Database and Analytics
Data Analysis Provides a Consistent Framework
In the beginning of this book, I said it if can be digitized, it can be measured. Without the customer database, digitized for access, we cannot perform marketing analytics. We might think of the types of analyses we wish to perform first, so that we make sure we collect the right data and have the right processes in place to clean that data. However, the database is the best place to start to develop an analytics program. In general, customer database includes internal, external, and modeled data (Figure 9.1).

Figure 9.1 Types of data that create the customer database
Internal data is that we collect about the customer. External data is that we purchase from elsewhere to “enhance” our database. Modeled data is data that has been manipulated to include customer insights. Using the customer lifecycle from Figure 3.2 as a guide, we can determine what data we need at each stage of our customer lifecycle development process and collect and analyze data accordingly. When we are looking at a prospect we may want to analyze website interactions and general demographic characteristics. When we are looking at an established customer, transaction history may be more relevant. Throughout this entire process it is important to uniquely identify the prospect or customer, typically using a unique customer identifier code. We need to identify customers to develop an effective messaging strategy and to interact with the customer most effectively.
For example, if the customer has recently left, we might need to understand their most recent purchase behavior. The company Screwfix, a UK distributor of power tools, identified its lapsed customers and tested various offers and subject lines in an e-mail “winback” campaign that had an 85 percent higher conversion rate than a standard e-mail from the company. The e-mails showed knowledge of past purchases from the company database, but used different messages to get the customer to purchase again.91 For long-standing customers, we want to focus on the entire relationship and deliver offers of value. Hilton Worldwide, for example, tracks its customers in detail, knowing their preferences down to the type of pillow preferred. This data is used to provide superior customer service, resulting in extremely high customer loyalty.92
Designing a Database Structure
Given the importance of customer data in marketing efforts, it is useful to consider at a high level the type of database to construct to store customer data. Companies frequently store unique customer identifying codes and other customer information in a single customer database, often using what is known as a data warehouse to store all their data in a single repository. The two broad categories of databases to consider when thinking in terms of reference and retrieval of relevant data are hierarchical and relational databases.
Hierarchical databases are built around a single, central record. All information relative to an individual customer is contained therein. There is no need in such a system to cross-refer to other data sources. Airline and hotel reservation systems have been developed in this way. Although hierarchical databases provide high-volume access and ease of use, their analytical capabilities can be limited by the extent of the data available. These databases are also known as transactional databases and are suitable for online-transaction processing (OLTP). Data input and data maintenance are easy, but reports and queries are more difficult.
Relational databases are a more recent approach to database development and utilization. They provide the advantages of simplicity and flexibility, minimizing redundancy and are more suited to ad hoc reporting. Typically, relational tables can be linked for reporting purposes. Related information is drawn from different, independent database sources as needed. A product database can be linked to a customer name/address database to direct promotion to specific product buyers. The separate product file enables analysis of a product line regardless of customer. Links can be established, too, with billing and/or shipping and inventory records.
How a Relational Database Is Built
A customer table can be built by using database software such as Microsoft Access. This Database Management System is one of many applications that allow creation, modification, and access via other applications for record manipulation. A data dictionary contains descriptions of the data within the database and allows flexibility in layout and formatting of files. Data is stored in tables having rows and columns linked together with a common key, such as a unique customer ID number. One column in a table could represent a customer name and each row an individual customer. Another column could contain the unique customer number that would allow a reporting system to link this table to another table that contains historical transaction data by customer number. Yet another table could be linked with information pertaining to the promotional efforts to that customer. Typically, a primary key of customer number links a “parent” table with a “child” table. This unique field will not contain duplicate values and can link one table to another in a one-to-many relationship. It is one-to-many because each customer can relate to many orders or promotional efforts.
One simple way to start is to use the Database wizard in Microsoft Access to build a contact management system with predefined templates. The wizard leads the user through a series of design steps that provide several functions, including the ability to add optional and suggested fields, select a screen display, select a report style, and enter a title or name for a new database. Once the application is complete, the user can enter and modify data and develop new tables that link to keys within the customer file in order to expanding the use of the database. Other cloud-based systems can also manage contacts effectively.
Relational databases are especially useful in tracking customer data because they have the flexibility needed to track this data, which often changes frequently. Relational databases offer the most flexibility in working with customer data as information to track may change frequently. Because of the table-driven features, relational technology is also more scalable and portable.
Beyond Relational Database Processing: OLAP and HADOOP
As database processing needs have increased, other forms of storing and accessing data have developed. For example, online-analytical processing (OLAP) stores data not in a table but in a “cube” or multidimensional format and enables the user to select data from different points of view. OLAP software can display all products sold to a particular customer segment over a certain price at a particular time period quite easily because of how the data is stored.
Apache Hadoop is an open source program that allows for the processing of all sorts of data, e-mails, webfiles, videos, and pictures. More importantly, the data does not have to be defined in terms of structure before it is accessed as in other database formats. Also, Hadoop allows for efficient processing of large amounts of data, such as the information created from large-scale website transactions or Twitter feeds. You will hear more about Hadoop and similar programs as the trend toward “Big Data” analysis continues. Real-time data processing to meet customer needs is another growing trend.
What to Put in the Database
Regardless of the technical specifications involved, the most critical portion of database development is to decide what types of data to include in the database. The exact records to include is based on the type of company and its strategic goals and what information it needs to create its segmentation scheme and determine its most profitable customers. Basically, a customer database involves three sections. Figure 9.1 shows the three major aspects of a customer database: internal, external, and modeled data.
The three data types are described below with examples in the Exhibit below:

Internal versus External Data
Although internal data comes from just where the name indicates, the company internal records, and includes typically transactions data, what was purchased and when and responses to sales promotions, it can also include data collected from the web and from interactions with salespersons and customer representatives. External data providers abound and will be covered in more detail in a later chapter, the types of data most of interest to companies includes credit reporting, lists compiled from other sources and commercial segmentation schemes (segmentation based on multiple records and used to create categories of customers) such as those from Acxiom, Experian, or AC Nielson.
Modeled Data and Profiling
The modeled data in a database is developed from the internal and external data that the firm has collected or purchased and then uses to develop its marketing plans and strategies. Modeled data often results from analytical or statistical procedures. A simple analytical procedure such as will yield “scores” that then can be input into a database. These scores can also be developed based on models using other types of internal and external information. Scoring is linked to the concept of profiling in that we seek out the best customers in our database and can develop a model that creates a score associated with our best customers (1 to 10, for example, with 1 being highest). Other types of modeled data based on the predictive techniques discussed in Chapter 10 can also help us identify and target our best customers and provide insight into marketing persona development. The model does not need to be based on RFM (Recency, Frequency and Monetary Value) but can be also adapted to incorporate fields such as capacity to buy or other characteristics.

Market Segmentation for Consumer Markets
Internal customer information for consumer databases can vary depending upon how much information is collected from the customer at the time of purchase or after the purchase. If the information is not obtained from internal sources, external sources will have to be used to augment or enhance the data. The Exhibit above gives an example of some information that might be held in a customer database. This data can be used for market segmentation. Unlike a persona, a fictionalized description of the likely customer for the product, which includes a rich description of behaviors and preferences. a market segment is a homogenous subgroup of a heterogeneous aggregate market that is selected as a target market. Segments are often created out of database characteristics. Cluster analysis for example, is an analytical technique for grouping of smaller entities, such as ZIP code areas or comparable individuals, into a market segment. Database marketing was the term for a group of techniques that eventually evolved into data analytics. Using a database wisely enables a marketer to target and focus on increasingly well-defined and profitable market segments. The process of segmentation (or market segmentation) begins with observing customers’ actions and continues with learning about the demographic and psychographic (reflected in lifestyle) characteristics of these customers.
Market segmentation is a staple of marketing because it reflects a customer orientation and is facilitated by database information. It uses a rifle-shot approach that enables the marketer to target appeals to specific markets rather than a shotgun or scattershot approach that includes likely prospects but also includes many unlikely individuals. The most basic form of market segmentation is the division between ultimate consumers and business-to-business markets. But this segmentation is only the beginning. Brand preferences, product characteristics, potential purchase volume, price/cost, and recency and frequency of purchase are just a few additional ways of segmenting markets.
Segments should have similar characteristics and we should be reasonably assured that they will respond the same way to marketing actions. For example, segments of customers for a fast-food restaurant might be broken into groups of students/nonstudents and whether they live in the area or on campus or commute to campus. Over the years, there have developed some standard ways of segmenting markets. Consumer markets are segmented by geography, demographics, or psychographic (lifestyle) features that can be used to identify and to organize (or cluster) them into logical groupings using a variety of techniques. Commercial database firms such as Experian and Acxiom create various clusters of customers and segment them according to interests and stage of life in an attempt to make it easier for marketers to market relevant products.
Segmentation Based on Actions Taken
Direct marketers have used market segmentation based on actions taken as the traditional way to select response or e-mail lists. The number of choices is nearly limitless, with consumer lists including buyers of all types of products, subscribers to specialized magazines, members of differentiated loyalty programs, donors to causes, collectors, and members. Lists of respondents are enhanced when there is an affinity, a relationship, a membership, or some form of expressed loyalty or connection to the organization.
These lists are enhanced, too, when subgrouped by characteristics of recency, frequency, and monetary value. For example, recent buyers (“hotline” buyers) of books about the Civil War are a segment within a segment (i.e., recent buyers of Civil War books as a segment of buyers of Civil War books). So are those who have been buying the annual update of an online directory for 10 or more years. So are those who buy “the best.”
The number of segments and subsegments is limited only by the amount of data and the ability of the database manager to manipulate it. So, those who send gifts to others, as distinct from buying for their own consumption, comprise a segment within a segment. So are those who purchase as members of a select “club.” So is the very large segment of “conscientious wheelers and dealers”—the millions of people who enter contests and sweepstakes, solve puzzles, buy lottery tickets, and order “genuine synthetic diamonds!” At heart, every mail or e-mail list represents a market segment that has demonstrated interest in certain offers by responding to them.


Market Segmentation for Business Markets
In the United States, there are at least 10 times as many purchasing households (i.e., consumer purchasing entities or units) as there are B2B organizations, and about 25 times as many individual consumers. Not surprisingly, B2B information is different from B2C.
Although, information about an individual purchaser is similar whether the person is acting on his or her own behalf or that of an organization, it is obtained through a different set of segmenting tools.
Because the typical B2B buying decision is more complex than the typical consumer buying decision, targeted marketing has long played an important role in B2B marketing. For example, lead generation and qualification with digital technology are used extensively in B2B direct marketing to enhance the effectiveness of personal selling. Tools such as Marketo, HubSpot and Eloqua facilitate the lead nurturing and demand generation process in B2B firms, making the process of selling more cost-effective and eliminating the need for as many in person sales calls. Digital technology such as search is also transforming the buying process, meaning the salesperson enters the process later in the sales cycle.
Direct contact in the form of sales calls to B2B buyers takes more time and is more costly than “calls” on consumers, which generally means that the consumer goes to the seller’s place of business. B2B purchases typically involve much larger dollar amounts, and B2B buyers are usually much better informed, have more specialized interests, and are involved in a process of joint decision making with others in their organizations. Repeat purchases, too, are more frequent in industrial situations. These factors have combined to explain the need for, as well as the growing use of, market segmentation techniques described below in B2B direct marketing.
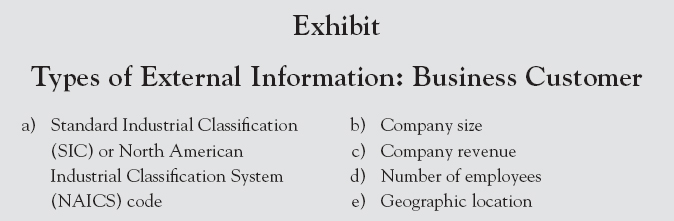
The exhibit above shows that the company may have quite a bit of information about its business customers in its databases. Not only must a company understand an individual when it is marketing B2B but it must also understand who is involved in the purchase (the buying center). The customer lifecycle in the case of B2B can be particularly long, taking months and even years, so lead nurturing information must be collected and processed. Did someone at the company download a whitepaper or attend a webinar as a result of a content marketing campaign? This activity might bring them close to a purchase and must be noted in the database.
As illustrated above, there are really five major data items that are generally used by B2B marketers to augment or enhance their internal data. These items are SIC or NAICS code, company size, company revenue, number of employees, and geographic location. Beyond that, the information becomes quite specific to the industry. For example, companies selling computer software to be installed internally might want to know what operating system or systems the company was using.
Standard Industrial Classification Coding System
In the United States, the common means of external information used industrial market segmentation is the SIC coding system developed and maintained by the federal government. This system is used to designate industry groups by function and product and, in a way, parallels the demographic characteristics used for segmenting markets and analyzing demand of consumer markets. The first two digits of the four-digit code indicate major classifications of industry, of which there are often many subcategories.
01–09 |
Agriculture, Forestry and Fisheries |
15–17 |
Construction |
20–39 |
Manufacturing |
40–49 |
Transportation, Communications, Public Utilities |
50–51 |
Wholesale Trade |
52–59 |
Retail Trade |
60–67 |
Finance, Insurance, Real Estate |
70–89 |
Services |
91–97 |
Public Administration |
99 |
Non-classifiable Establishments |
The final two digits of the four-digit SIC code classify individual organizations by subgroup and further detail within industry. For example, SIC #2300 identifies manufacturers of wearing apparel. Within this classification, SIC #2311 identifies men’s suit and coat manufacturers.
North American Industrial Classification System
SIC codes did a good job detailing the manufacturing industry in the post-World War II era, but many feel the system fails to recognize today’s information technology age. With rapid growth of the service industry, high technology, and international trade, a new system has arisen, largely in response to the North American Free Trade Agreement (NAFTA) of 1994. It was felt that a new system was needed to compare U.S. statistical information with that of Canada and Mexico. Desirable, too, would be future compatibility with an International Standard Industrial Classification System being developed by the United Nations.
All three groups have agreed on a system now called NAICS). This system has formulated a six-digit code, with the first five digits denoting the NAICS levels used by all three countries to produce compatible data. NAICS is an entirely different classification system focused on production activities rather than on the industries served, which is what SIC codes do. Different agencies within governments have converted to NAICS coding, but business has done been slow to adopt the new coding system in marketing applications and SIC codes continue to be prominent.
Using Merge/Purge and Match Codes to Eliminate Duplication
In an earlier chapter, we spoke about the need to maintain data quality. A database must be designed to eliminate duplicated information and, thus, wasted effort. The more external lists are used to supplement a house list, the more complex this becomes. Lists are perishable. Customers move frequently and business professionals change jobs and job titles. Customer lists from different sources may duplicate each other; compiled lists may contain duplications within, between, and among lists; and, many names may already be on a house list. The solution to use merge/purge and match codes eliminates duplication. Merge/purge can also be used to identify cross-channel behavior. Basic contact information must be constantly updated because of the mobility of both businesses and consumers. Transactions must also be kept up to date.
Organizing for the Customer Database
In summary, as companies put the customer database together, they look at internal, external, and modeled data to effectively create a complete view of the customer for analytical purposes. Although this chapter covers the technical details of the database, as discussed earlier, often the most important part of database marketing is how the organization is structured to handle the explosion of data that firms typically face. The term “Big Data” refers to databases which are so large that they cannot be handled by traditional data structures or data analysis methods. However, most organizations need to worry about “Broad Data” or getting a 360 degree view of the customer from all areas of the organization. Typically, information is stored throughout the organization in older systems, known as legacy systems, which often make it difficult to extract data for analysis.
Also, data is stored in many different databases which often don’t speak to each other. These are known as data “silos” because the databases cannot easily communicate. A challenge is that the explosion in data from new sources such as Twitter feeds and website interactions, as well as video and other types of unstructured data, makes it difficult to look at a single view of the customer. As discussed previously, it takes good cooperation between marketing and IT, as well as general cooperation throughout the company, to manage data well. Key to an integrated company database is also top management support, including a vision for managing customer information that is made known throughout the organizations.93 So database development, maintenance, and updates must be made an organizational priority.
Where Do Analytics Fit?
Analytics is a broad term that means gaining insight from data. Most tools on the Internet have some form of analytics attached to them. If you set up a Facebook page or YouTube channel, you will get some degree of data analysis to help guide your processes. You will typically be able to see how many people visited the site, where they came from, if they are new versus returning customers, how long they stayed and the like. Analytics can be used to measure what goes on during a website visit or to explain both offline and online customer behavior. An easy way to get some ideas about analytics is to create a blogger blog and link that blog to Google Analytics so you can get a little practice. The steps are under the admin tab in Google Analytics. You first add a web property and then copy and paste the UA code number (i.e., UA-1237877-46) into the settings (other) section of your blogger blog. Soon you will be able to see the traffic sources to your blog, how long they stayed and other useful metrics.
One form of analytics is data analytics. In this chapter, we have focused on setting up a customer database to develop any kind of analytics application. Although we can analyze market research or other types of data derived from outside the firm, we are primarily analyzing the company’s internal data, augmented with external information and the results of our internal models. This data can be supplemented with website data and data from social media sites to get a true picture of the customer. With data analytics we look at the customer database and make insights. We might do an RFM analysis or look at our data in other ways to determine who the best customers are and how to market to them (Figure 9.2).
Data analytics can be descriptive but its greatest value to the company is in the predictive aspect. Therefore we sometimes see the term predictive analytics mentioned online and in job descriptions in conjunction with data analytics. This type of data is referred to as modeled data above and RFM is a simple example of modeled data in marketing. We try to use information about customer purchase patterns, such as how recently, how frequently, and how much was purchased, to predict future patterns and identify potential “best” or “high-value” customers. Predictive analytics often include regression or logistic regression models. Logistic regression predicts a 0/1 or binary dependent variable and is very useful in marketing. Did the user buy or not? Is this someone to whom I should extend credit? There are many other binary logistic regression examples in marketing. There are many other examples in the marketing world.
Logistic regression is used to model data that does not follow a standard linear pattern where the data move in a one-to-one relationship. In linear regression, the effect of the predicted variable by a one unit increase in the predictor variable stays the same. In logistic regression, the data follows a nonlinear fashion and the effects are different along the curve. (Charlotte Mason’s 2003 note, Applied Logistic Regression, is available upon request for a more detailed explanation. Karl L. Wuensch’s note, Binary Logistic Regression with SPSS, 2014 at is also useful.)94 Linear regression and logistic regression are compared below.

Figure 9.2 The two types of marketing analytics
You might be more familiar with web analytics such as the analysis provided by Google Analytics or similar programs. Web analytics, although it can use predictive models, often involves measuring the activity to a company’s website with the objective of improving the flow of the site and meeting the company’s objectives. In some of web analytics, analysis is routine and some is more exciting in nature as Justin Cutroni & Adam Singer from Google say in a recent Analytics Academy video.95 Reporting is necessary and it is helpful if we can automate the process. Dashboards and custom reports can help standardize information and make it easier to manage the business. You will always want to select your analytics goals based on your business objectives. You will have set goals for your website from a business point of view and will want to track those goals that are important. If you want to increase traffic to the site, you can track number of visitors. If you want to see if people clicked on a particular link, you can measure that. Typically measuring “conversion,” the action you would like the consumer to take, in its various forms means doing some extra programming in whatever tool you are using. A conversion is usually linked to some kind of “call to action” taken by the customer. A while back Google Analytics changed and they now have limited the information formerly available on the keyword source, how people search for your site. This information is available on a limited basis in the Webmaster tool or (of course) if you are running a paid search campaign in AdWords.
There are dashboards in Google Analytics which are essentially standard reports help to see from which platform users are visiting the site, how long they stayed, and where they are from. If you want to get more sophisticated conversion reporting in Google Analytics or any other analytics tool you need to do something called “tag management.” Using tags, or bits of code, on the website, you can then track conversions and other actions customers are taking. You can see how they moved through the site and where you might need to make corrections in the site to improve the customer experience. Tag management tools help marketers manage tags without having to go to the IT department for every change, thereby facilitating real-time changes based on customer response.
Google Analytics has a solutions gallery where various tools are shared so you don’t have to build reports from scratch. This repository is helpful because analytics are getting more challenging as customers are on multiple channels. E-mail marketing tools have analytics built into them but often we can’t see how the customer is responding across channels. To measure and allocate response across channels is called attribution modeling, and many analytics tools are starting to try to pull this information together. Analytics tools can attribute performance to the first “click” or interaction on a channel to the last “click” or interaction to try to determine which channels are most efficient and effective Analytics as a discipline is getting more sophisticated in general. If you take the Google e-commerce class, you will see that we can now analyze groups of users. Segments are created to think about users with more than five transactions for example.
One of the most popular web analytics tool is Google Analytics, but there are other options that are well known such as Adobe Omniture and Core Metrics. The idea is to get an idea of where the traffic is coming from in your website and who is converting and how so you can make better marketing decisions. Analytics is set up in terms of dimensions and metrics. Not all dimensions have associated metrics. A dimension might be the type of user and a metric might be the total number of users in a period.
Usually, we want to measure the result of some typical action and improve our marketing efforts. The analytics available without special coding include the type of browser being used and where the traffic originates, the time spent on the site and the bounce rate (how long before the typical viewer leaves the site). As mentioned above, in most cases, you will need to enlist the aid of a developer to get the fine-tuned type of information needed for most marketing analysis, particularly e-commerce. The most important thing from a management point of view is to think about what you really want to measure. For example, Google Analytics will tell you what country or region your traffic is coming from, but if you are primarily a domestic business you may not care about that information. One final note is that, as in everything, real-time analytics are going to be more and more important in the future as customers demand offers and answers in real-time. Mobile analytics will also play an increasingly important role as most of our customer interactions will be on mobile devices.
What to Do Next after Chapter 9:
1. Make a list of the three types of data, internal, external, and modeled. Then rate which data your company or a company you select has most easily available.
2. Based on the campaigns and actions you said might like to develop for Chapters 4 through 7, which type of data would most easily support these campaigns? Make a matrix of the campaign and the type of data needed and analyze the deficiencies you may have. What types of data do you need to further support these campaigns?
3. What would you hope to learn from both data analytics and web analytics to manage these campaigns and actions?
Chapter 9 Discussion Questions:
Discussion 9.1: Of internal, external, and modeled data in a customer database, which is the most important to marketing efforts and why? How do the three types of data work together?
Discussion 9.2: RFM is a long-standing type of modeled data. Why has it been so popular and how can the technique be adapted to your company or a company of your choosing?
Discussion 9.3: What are the top segmentation techniques for B2C and B2B customers? Give an example of the usage of these types of segmentation from your own or another company.
Discussion 9.4: What are the two main types of marketing analytics and how can they each be used to gain customer insight?
Chapter 9 Glossary:
External data: Data that the company purchases from a third party to enhance its customer database.
Former customers: Those that are no longer active purchasers.
Internal data: Data that a company collects as part of the customer lifecycle and doing business with that customer.
Modeled data: Data that is created as part of a “scoring” or other model to classify customer propensity to purchase or other characteristic.
Match code: Abbreviated information about a customer record that is constructed so that each individual record can be matched, pair wise, with each other record.
Merge/purge: A computerized process used to identify and delete duplicate names/addresses within house lists.
Multi-buyers: An individual’s name/address that appears on two or more response lists simultaneously.
New customers: Those who have made an initial purchase of a product or service. Often, the early behavior of customers is predictive of future behavior. Regardless, once acquired, the focus shifts toward encouraging repeat purchases and customer loyalty.
Prospects: In the target market, but are not yet customers.
Recency/Frequency/Monetary (RFM): An assessment of the date and volume of purchases, in the master list record over a period of time marketers can determine the transaction record of each customer in a given period, which helps determine the future potential of that customer.
Responders: Those who have made some contact with the business, but are not yet customers.
Retained or repeat customers: Customers who have made more than the initial purchase. Over time, customers can be characterized according to their value to the firm.
Web analytics: Focusing on website logs and activity to gain customer insight.
Predictive analytics: A form of data analytics that uses statistical or other techniques to predict customer response.
Data analytics: Focusing on the customer database to gain customer insight.
Chapter 9, pages 113 to 125 include information from the textbook noted below: This material has been included with permission from the Racom Communications, Contemporary Database Marketing and Analytics, by Lisa Spiller, Debra Zahay and Kurtis Ruf, (editors), forthcoming March 2015.
91 Young. 2014. “Relighting the Flame, Tested Email Strategies to Win-back.” DMA Case Studies. http://www.slideshare.net/dmaemail/email-customer-lifecycle-2011-win-back-case-study-screwfix (10/13/2014).
92 1 to 1 media. 2014. “Hilton Worldwide Puts Loyalty at the Heart of Its Service Strategy.” Weekly Digest. http://www.1to1media.com/view.aspx?DocID=34835 (10/13/2014).
93 D. Zahay, J. Peltier, A. Krishen, and D. Schutlz. 2014. “Organizational Processes for B2B Services IMC Data Quality.” The Journal of Business and Industrial Marketing 29, no. 1, pp. 63–74.
94 Wuencsh. 2014. “Binary Logistic Regression with SPSS.” Note. http://core.ecu.edu/psyc/wuenschk/MV/MultReg/Logistic-SPSS.pdf (10/13/2014).
95 Google. 2014. Analytics Academy Live with Justin Cutroni & Adam Singer. Google Analytics Academy. https://www.youtube.com/watch?v=cNr9QrzpEy8 (10/13/2014).