
8
Black Belt Nonstatistical Tools (O Through Q)
In this chapter we discuss the following tools:
- Organizational change management
- Pareto diagrams
- Prioritization matrix
- Project management
- Quality function deployment
ORGANIZATIONAL CHANGE MANAGEMENT (OCM)
Just the Facts
Organizations today are in a continuous state of change. In the past, individuals were called upon once in a while to adjust and change their work patterns and then had time to master this new process. Today things are changing so fast we seldom become comfortable with one change in the way we do business before it has been changed again. There literally are hundreds of change activities going on in all organizations at the same time, and many individuals are impacted by a number of different processes that are changing simultaneously.
We like to think that the people in our organization are resilient and can handle this rapidly changing environment without additional help. The truth is that everyone is for change as long it does not impact him or her. But when the change becomes personal, everyone is subjected to the four C’s:
- Comfort: Their comfort level has been destroyed.
- Confidence: They lose confidence in their ability to meet the requirements in the future state solution.
- Competence: They are not sure if they will have the skills required to perform. They are no longer the individuals that know the most about the job.
- Control: They have lost control over their own destiny. Someone else is defining what they will do and how they will do it.
As a result of the disruption of the four C’s, the individuals and groups within the organization suffer some severe emotional changes. The stress level within the organization goes way up as people worry about the future. Productivity declines because people spend excessive amounts of time discussing what’s going to happen to them and how it is going to impact them. Anxiety levels increase as the uncertainty of the future state remains unclear and the individuals begin to fear loss of security. This results in a great deal of increased conflict between groups and individuals. An attitude develops of “What’s wrong with the future state solution,” rather than “How can we help to implement the future state solution?” Everyone is most comfortable and happiest in their current state (status quo). Human beings are extremely control-oriented. We feel the most competent, confident, and comfortable when our expectations of control, stability, and predictability are being met.
We resist change because we don’t know if we will be able to prosper or even survive in the new environment. Organizational change management (OCM) is a methodology designed to successfully manage the change process. Today, managers at all levels of the organization must have the ability and willingness to deal with the tough issues associated with implementing major change. They must be capable of guiding their organization safely through the change process. This involves convincing people to leave the comfort of the current state and move through the turbulence of the transition state to arrive at what may be an unclear, distant future state. (See Figure 8.1.)

The change process.
Specifically, these four states are defined as:
- Current state: The status quo, or the established pattern of expectations. The normal routine an organization follows before implementing an improvement opportunity.
- Present state: The condition where you know and understand what will happen, when your expectations are being met. (You may not like the current state, but you have learned how to survive in it and you know what to expect.)
- Transition state: The point in the change process where people break away from the status quo. They no longer behave as they have in the past, yet they have not thoroughly established a new way of operating.
- Future state: The point at which change initiatives are implemented and integrated with the behavioral patterns that are required by the change.
The focus of the OCM implementation methodology is on the transformation between these various states. The journey from the current state to the future state can be long and perilous, and if not properly managed with appropriate strategies and tactics, it can be disastrous.
There are literally hundreds of changes going on within your organization all the time, and the OCM methodology should not be applied to all of them. You need to look very carefully at the changes and select the ones that should be managed. Typical changes that should have the OCM methodology applied to them are:
- When the change is a major change
- When there is a high risk that certain human factors would result in implementation failure
In most organizations there are critical, major, and minor changes. Certainly all of the critical changes as well as most major changes should use this methodology. Few of the minor changes will require the discipline involved in the organizational change management methodology.
Seven Phases of OCM
Phase I: Defining Current State Pain
The individuals involved in the change need to feel enough heat related to their present situation to make them want to leave the security of the status quo and move into the uncertainty in the transformation part (transition phase) of the change management process. Management may reason that the employees have an excellent understanding of the pain related to the status quo, and that is probably true related to the current situation, but they have little understanding of the lost opportunities that will impact them and the organization if the change does not take place. As a result, management needs to surface the pain related to lost opportunities.
The pain related to the current state must be great enough to get the employees to consider leaving the safety of the current state platform and move on to the transformation phase. The highlighting of pain is called “establishing the burning platform.” This term comes from an oil rig that was on fire in the North Sea. The platform got so hot that the workers jumped off the rig into the sea because they realized that their chances of survival were better in the cold North Sea than on the burning oil rig platform.

Phase II: Establishing a Clear Vision of the Future State Solution
Employees are going to weigh the pain related to the present situation and compare it to the pain they will undergo during the transformation and the pain related to the future state solution. (Note: Your employees are smart enough to realize that there will always be some pain in using even the very best future state solution.) As a result, management needs to provide the employees with an excellent vision of the future state solution and its impact upon them so they can compare the pain of the current state to the combined pain of the transformation state and future state. If the pain related to the current state is not greater than their view of the pain related to the transition state and future state combined, the change can only be implemented over the objections of the employees, and there is a high likelihood that it will not be successfully implemented. The vision has to crisply define:
- Why is the change necessary?
- What’s in it for me?
- Why is it important to the organization?
Phases I and II are often called pain management.
Phase III: Defining Change Roles
The roles of the individuals involved in the change must be clearly defined. These roles are divided into five general categories:
- Initiating sponsor: Individual/group that has the power to initiate and legitimize the change for all of the affected individuals.
- Sustaining sponsor: Individual/group that has the necessary political, logistical, and economic proximity to the targets to influence their behavior.
- Change agent: Individual/group that is responsible for implementing the change management aspects of the project.
- Change target (sometimes called a “changee”): Individual/group that must actually change.
- Advocate: An individual/group that wants to achieve change but does not have sufficient sponsorship.
Each person needs to be trained in his or her duties related to his or her change management role.
Phase IV: Mapping Change Roles
A change role map should be prepared identifying each individual’s role related to the change. (Note: This is a concept developed by Daryl Conner of ODR.) This map generates a visual picture of the individuals, groups, and relationships that must be orchestrated to achieve the change. It is important to note that one individual can serve many roles. For example, every sustaining sponsor is first a target or “change” before he or she can accept the role as a sustaining sponsor. (See Figure 8.2).
Phase V: Defining the Degree of Change Required
The communications system and the change management plan must be designed so that the proper degree of acceptance of the change initiative is accomplished. There is a great deal of difficulty and effort required to have a change internalized in comparison to just having it adopted. For example, there is much less change management required to have a new computer program standardized for use throughout the organization than there is to have the same software package accepted by the individuals as being the very best alternative. Typically, degrees of acceptance can be broken down into:

Typical role map diagram.
- Adoption: The change has been fully implemented, the new practice is being followed consistently, and its objectives are being met. “We are doing it this way.”
- Institutionalization: The change has not only been adopted, but is formalized in written policies, practices, and procedures. The organizational infrastructure (hiring, training, performance measures, rewards, etc.) is aligned to support continued conformance to the new practice. “We always do it this way.”
- Internalization: The new practice is understood to be fully aligned with individual and organizational beliefs, values, and norms of behavior, and as such, commitment to sustain the practice comes from within. “Of course we always do it this way. I believe in doing it this way, and to do otherwise would be inconsistent with the way we like to do things here.”
Phase VI: Developing the Organizational Change Management Plan
Any planning activity involves thinking out in advance the sequence of actions required to accomplish a predefined objective. A change management plan is now prepared to meet the degree of acceptance that is required to support the project.
Now the change management plan needs to be integrated into the project management plan. This normally is a timeline chart that reflects the movement throughout the change management process. (See Figure 8.3.) The change management plan should also include any risk related to internal or external events, such as the following:
- Competing initiatives
- Too many initiatives
- Loss of sponsorship


Typical change management plan.
Typical change management plan.
- Economic trends in the business
- Industry trends
Phase VII: Implementing the Change Management Plan
The OCM plan is now implemented in conjunction with the project plan. Usually a number of surveys are conducted to help refine the OCM plan. Typical surveys or evaluations that could be conducted are:
- Implementation architecture assessment
- Internal/external event assessment
- Vision clarity assessment
- Commitment versus compliance change management
- Strategy analysis
- Predicting the impact of the change
- Organizational effectiveness
- Business imperative analysis
- Sponsor evaluation
- Implementation history assessment
- X-Factor change readiness assessment
Examples
It is evident from Figure 8.3 that a number of change management activities are iterative and not confined to the QMS phase. (See also Figure 8.4.)

To win the game today, you need to get the most out of every player on the board.
Additional Reading
Beckhard, Richard, and Wendy Pritchard. Changing the Essence: The Art of Creating and Leading Fundamental Change in Organizations (San Francisco: Jossey-Bass, 1992).
Bouldin, Barbara M. Agents of Change: Managing the Introduction of Automated Tools (New York: Yourdon Press, 1988).
Conner, Darryl R. Leading at the Edge of Chaos: How to Create the Nimble Organization (New York: John Wiley & Sons, 1998).
Conner, Darryl R. Managing at the Speed of Change: How Resilient Managers Succeed and Prosper Where Others Fail (New York: Villard Books, 1993).
Conner, Daryl, H. James Harrington, and Richard Horney. Project Change Management—Applying Change Management to Improvement Projects (New York: McGraw-Hill, 1999).
Harrington, H. James, and James S. Harrington. Total Improvement Management: The Next Generation in Performance Improvement (New York: McGraw-Hill, 1995).
Huse, Edgar F., and Thomas G. Cummings. Organization Development and Change (New York: West, 1985).
Hutton, David W. The Change Agent’s Handbook: A Survival Guide for Quality Improvement Champions (Milwaukee, WI: ASQ Quality Press, 1994).
Kanter, Rosabeth Moss. Rosabeth Moss Kanter on the Frontiers of Management (Cambridge, MA: Harvard Business School Press, 1997).
Smith, Douglas K. Taking Charge of Change: 10 Principles for Managing People and Performance (Reading, MA: Addison-Wesley, 1996).
PARETO DIAGRAMS

Just the Facts
A Pareto diagram is a specialized type of column graph. Data are presented in a manner that allows comparison between a number of problems or a number of causes. The comparison is necessary to set priorities. The Pareto diagram facilitates the process by graphically distinguishing the few significant problems or causes from the less significant many. This diagram is the graphic representation of the Pareto principle.
The Pareto Principle (80/20 Rule)
The Pareto principle states as a “universal,” applicable to many fields, the phenomenon of the vital few and the trivial many. In our context, this means that a few significant problems or causes will be most important to our decision-making process.
This principle derives its name from Vilfredo Pareto, a 19th-century economist who applied the concept to income distribution. His observations led him to state that 80% of wealth is controlled by 20% of the people. (Hence, the principle is often referred to as the 80-20 principle.) The name Pareto and the universal applicability of the concept are credited to Dr. Joe M. Juran, who applied the Lorenz curve to graphically depict the universal.
The Pareto diagram is distinguished from other column graphs in that the columns representing each category are always ordered from the highest on the left to the lowest on the right. (See Figure 8.5.) The one exception to this rule is the “Other” column, a collection of less important factors. When it is used, it is always the last column on the right. With this arrangement it is possible to make a cumulative or “cum” line (the Lorenz curve), which rises by steps according to the height of the columns to show the total of the percentages, the cumulative percentage. With the cum line, the Pareto diagram becomes a combined column and line graph.
Uses of Pareto Diagrams
Like other graphic representations, Pareto diagrams visualize data to assist investigation and analysis. They are employed to:
- Establish priorities: By a comparison of related data, major categories of problems and causes are identified.
- Show percentage of impact: The cum line defines the proportionate importance of combined categories, and thus indicates the likely impact of dealing with all of the categories up to that point in the diagram.

Pareto diagram form.
- Show change over time: Two or more diagrams can be used to demonstrate the result of decisions and actions by showing before and after data. (See Figure 8.6.)
- Aid communication: The diagram is an accepted form of communication, readily understood.
- Demonstrate use of data: This can be particularly helpful in management presentations to show the activities are solidly rooted in facts, not just opinions.

Performance before (left) and after (right) corrective action.
Classifications of Data
The data collected for transfer to a Pareto diagram are of three major types:
- Problems: Including errors, defects, locations, processes, procedures.
- Causes: Including materials, machines, equipment, employees, customers, operations, standards.
- Cost: Of each category of data.
The purpose of using a Pareto diagram is to:
- Establish the biggest problem, and rank the rest
- Establish the most important cause, and rank the rest
“Biggest” and “most important” need to be measured not solely in terms of frequency but also in terms of cost. The number of occurrences may not be as significant as the cost of particular occurrences. Consequently, it is usually important to construct a Pareto diagram using cost data. Mere frequency can be misleading in judging significance.
Constructing a Pareto Diagram
Before a Pareto diagram can be constructed, it is necessary to collect data according to the classifications or categories judged most suitable. With these data the diagram is constructed as follows:
Data Table
| Problems with Overseas Shipments |
Number | % of Total |
Cum % |
|---|---|---|---|
| Containers opened | 112 | 40 | 40 |
| Containers broken | 68 | 24 | 64 |
| Items missing | 30 | 11 | 75 |
| No shipping forms | 28 | 10 | 85 |
| Wrong shipping forms | 18 | 6 | 91 |
| Other | 24 | 9 | 100% |
| Total | 280 | 100% | — |
Vertical scales for a Pareto diagram.
Step 1: Summarize the data on a worksheet by:
- Arranging the data in order of sequence from largest to smallest and total them. (See Table 8.1, “Number” column.)
- Calculating percentages (See Table 8.1, “% of Total” column.)
- Completing the cumulative percent column. (See Table 8.1, “Cum %” column.)
Step 2: Draw the horizontal and two vertical axes:
- Divide the horizontal axis into equal segments, one for each category. (See Figure 8.7.)
- Scale the left-hand vertical axis so that the top figure on the axis is the total of all the occurrences in the categories.
- Scale the right-hand vertical axis so that 100% is directly opposite the total on the left-hand axis. The percent scale is normally in increments of 10%.
Step 3: Plot the data. Construct a series of columns, putting the tallest column on the extreme left, then the next tallest, and so on. If several minor categories are consolidated into one “Other” column, it is plotted on the extreme right, regardless of its height. (See Figure 8.8.)
Step 4: Plot the cumulative line:
- Place a dot in line with the right side of each column, at a height corresponding to the number in the cumulative percentage column on the worksheet. In our example, the points would be at 40, 64, 75, 85, and 91%.
- Beginning with the lower left corner of the diagram (the zero point of origin), connect the dots to the 100% point on the right vertical axis. (See Figure 8.9.)
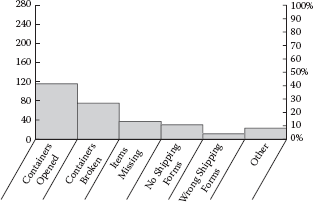
Plotted Pareto diagram without cumulative line.
Step 5: Add labels and the legend:
- Label each axis.
- Add the legend. It should include the source of the data, date prepared, where collected, who collected them, period covered, and any other pertinent information. (See Figure 8.10.)
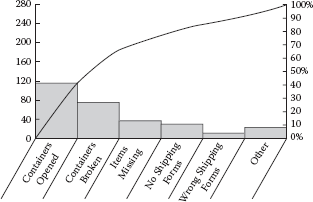
Pareto diagram with cumulative line plotted.
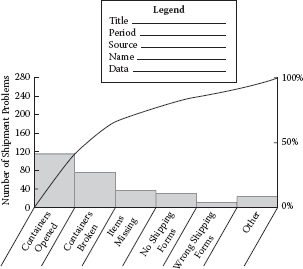
Completed Pareto diagram.
Example
See the examples in “Just the Facts.”
PRIORITIZATION MATRIX

Just the Facts
The matrix is used to prioritize complex or unclear issues, where there are several criteria for deciding importance. It requires actual data to aid in establishing the criteria. The matrix helps to reduce the list of possible causes and solutions.
The prioritization matrix is a tool for sorting a set of criteria by order of importance. It is also valuable in identifying each in terms of their relative importance by assigning a numerical value to the importance of each criteria—the larger the number, the more important the criteria.
Example
Each criterion is evaluated against each of a set of key criteria. The scores for each criterion are then summed to come up with a total score.
A good criterion reflects key goals and enables objective measurements to be made. Thus, material cost is measurable and reflects a business profit goal, while simplicity may not reflect any goals and be difficult to score.
When there are multiple criteria, it may also be important to take into account the fact that some criteria are more important than others. This can be implemented by allocating weighting values to each criterion. Figure 8.11 displays a simple matrix.
Additional Reading
Cox, Jeff, and Eliyahu M. Goldratt. The Goal: A Process of Ongoing Improvement (Croton-on-Hudson, NY: North River Press, 1986).
Picard, Daniel (ed.). The Black Belt Memory Jogger (GOAL/QPC and Six Sigma Academy, Salem, NH, 2002).
Wortman, Bill. The Certified Six Sigma Black Belt Primer (Quality Council of Indiana, West Terre Haute, 2001).

Simple matrix.
PROJECT MANAGEMENT (PM)

Just the Facts
Performance improvement occurs mainly from a number of large and small projects that are undertaken by the organization. These projects involve all levels within the organization and can take less than 100 hours or millions of hours to complete. They are a critical part of the way an organization’s business strategies are implemented. It is extremely important that these multitudes of projects are managed effectively if the stakeholder’s needs and expectations are to be met. This is made more complex because conflicting demands are often placed upon the project. For example:
- Scope
- Time
- Cost
- Quality
- Stakeholders with different identified (needs) and unidentified (expectations) requirements
The different stakeholders often place conflicting requirements on a single project. For example, management wants the project to reduce labor cost by 80% and organized labor wants it to create more jobs.
The Project Management Institute in Upper Darby, Pennsylvania, is the leader in defining the body of knowledge for project management. Its Project Management Body of Knowledge (PMBOK) approach to project management has been widely accepted throughout the world. In addition, the International Organization for Standardization’s Technical Committee 176 has released an international standard: ISO/DIS 10006: Guidelines to Quality in Project Management. These two methodologies complement each other and march hand in hand with each other.
- Project: A temporary endeavor undertaken to create a unique product or service.
- Program: A group of related projects managed in a coordinated way. Programs usually include an element of ongoing activities.
Large projects are often managed by professional project managers who have no other assignments. However, in most organizations, individuals who serve as project manager only a small percentage of the time manage many projects. In either case, the individual project manager is responsible for defining a process by which a project is initiated, controlled, and brought to a successful conclusion. This requires the following:
- Project completed on time
- Project completed in budget
- Outputs met specification
- Customers are satisfied
- Team members gain satisfaction as a result of the project
A good project manager follows General George S. Patton’s advice when he said, “Don’t tell soldiers how to do something. Tell them what to do and you will be amazed at their ingenuity.” Although a single project life cycle is very difficult to get everyone to agree to, the project life cycle defined in U.S. DOD’s document 5000.2 (Revision 2-26-92, entitled “Representative Life Cycle for Defense Acquisition”) provides a reasonably good starting point. It is divided into five phases (see Table 8.2).
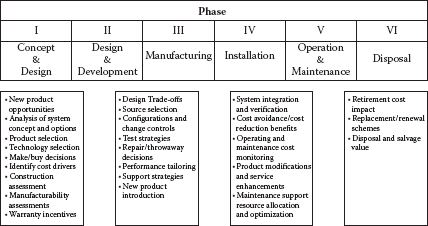
The following is a life cycle that we like better for an organization that is providing a product and service (see Figure 8.12):
- Phase I: Concept and definition
- Phase II: Design and development
Five Phases of Project Life Cycle
Note: This is the representative life cycle for defense acquisition, per U.S. DOD 5000.2.
- Phase III: Creating the product or service
- Phase IV: Installation
- Phase V: Operating and maintenance
- Phase VI: Disposal
Traditionally, projects have followed a pattern of phases from concept to termination. Each phase has particular characteristics that distinguish it from the other phases. Each phase forms part of a logical sequence in which the fundamental and technical specification of the end product or service is progressively defined. Figure 8.13 is the project management life cycle. Figure 8.14 shows the project phase gates for a typical new product development cycle.
The successful project manager understands that there are four key factors that have to be considered when the project plan is developed. All four factors overlap to a degree, but should first be considered independently and then altogether. (See Figure 8.15.)
Sample applications of PLC.

Project management life cycle.
In order to effectively manage a project, the individual assigned will be required to address the 10 elements defined in Figure 8.16. (The Project Management Institute includes only the first nine elements listed in Figure 8.16.)
Figure 8.17 is the 44-hour processes’ flow PMBOK Guide 2004 as they relate to the five process groups. They do not include OCM as a separate element, but it is placed under the element entitled “project risk management.” Of course, the depth and detail that each element needs in order to be evaluated and managed will vary greatly depending upon the scope and complexity of the project.

Project phase gates for typical new product development cycle.

The key program management factors.
Project Management Knowledge Areas
The book A Guide to the Project Management Body of Knowledge, published by the Project Management Institute, summarizes the project management knowledge areas as follows.
Project Integration Management
This is a subset of project management that includes the processes required to ensure that the various elements of the project are properly coordinated. It consists of:
- Project plan development: Taking the results of other planning processes and putting them into a consistent, coherent document.
- Project plan execution: Carrying out the project plan by performing the activities included therein.
- Overall change control: Coordinating changes across the entire project.

The 10 elements of project management.


Forty-four processes of project management.
Project Scope Management
This is a subset of project management that includes the processes needed to ensure that the project includes all the work required, and only the work required, to complete the project successfully. It consists of:
- Initiation: Committing the organization to begin the next phase of the project.
- Scope planning: Developing a written scope statement as the basis for future project decisions.
- Scope definition: Subdividing the major project deliverables into smaller, more manageable components.
- Scope verification: Formalizing acceptance of the project scope.
- Scope change control: Controlling changes to project scope.
Project Time Management
This is a subset of project management that includes the processes required to ensure timely completion of the project. It consists of:
- Activity definition: Identifying the specific activities that must be performed to produce the various project deliverables.
- Activity sequencing: Identifying and documenting interactivity dependencies.
- Activity duration estimating: Estimating the number of work periods that will be needed to complete individual activities.
- Schedule development: Analyzing activity sequences, activity durations, and resource requirements to create the project schedule.
- Schedule control: Controlling changes to the project schedule.
Project Cost Management
This is a subset of project management that includes the processes required to ensure that the project is completed within the approved budget. It consists of:
- Resource planning: Determining what resources (people, equipment, materials) and what quantities of each should be used to perform project activities.
- Cost estimating: Developing an approximation (estimate) of the costs of the resources needed to complete project activities.
- Cost budgeting: Allocating the overall cost estimate to individual work items.
- Cost control: Controlling changes to the project budget.
Project Quality Management
This is a subset of project management that includes the processes required to ensure that the project will satisfy the needs for which it was undertaken. It consists of:
- Quality planning: Identifying which quality standards are relevant to the project and determining how to satisfy them.
- Quality assurance: Evaluating overall project performance on a regular basis to provide confidence that the project will satisfy the relevant quality standards.
- Quality control: Monitoring specific project results to determine if they comply with relevant quality standards and identifying ways to eliminate causes of unsatisfactory performance.
Project Human Resource Management
This is a subset of project management that includes the processes required to make the most effective use of the people involved with the project. It consists of:
- Organizational planning: Identifying, documenting, and assigning project roles, responsibilities, and reporting relationships.
- Staff acquisition: Getting the human resources needed assigned to and working on the project.
- Team development: Developing individual and group skills to enhance project performance.
Project Communications Management
This is a subset of project management that includes the processes required to ensure timely and appropriate generation, collection, dissemination, storage, and ultimate disposition of project information. It consists of:
- Communications planning: Determining the information and communications needs of the stakeholders: who needs what information, when will they need it, and how it will be given to them.
- Information distribution: Making needed information available to project stakeholders in a timely manner.
- Performance reporting: Collecting and disseminating performance information. This includes status reporting, progress measurement, and forecasting.
- Administrative closure: Generating, gathering, and disseminating information to formalize phase or project completion.
Project Risk Management
This is a subset of project management that includes the processes concerned with identifying, analyzing, and responding to project risk. It consists of:
- Risk identification: Determining which risks are likely to affect the project and documenting the characteristics of each.
- Risk quantification: Evaluating risks and risk interactions to assess the range of possible project outcomes.
- Risk response development: Defining enhancement steps for opportunities and responses to threats.
- Risk response control: Responding to changes in risk over the course of the project.
Project Procurement Management
This is a subset of project management that includes the processes required to acquire goods and services from outside the performing organization. It consists of:
- Procurement planning: Determining what to procure and when.
- Solicitation planning: Documenting product requirements and identifying potential sources.
- Solicitation: Obtaining quotations, bids, offers, or proposals as appropriate.
- Source selection: Choosing from among potential sellers.
- Contract administration: Managing the relationship with the seller.
- Contract closeout: Completion and settlement of the contract, including resolution of any open items.
How OCM Can Help
This is a part of project management that is directed at the people who will be impacted by the project. OCM helps prepare the people not to resist the change—both those who live in the process that is being changed and those who have their work lives changed as a result of the project. In fact, OCM has often prepared the employees so well that they look forward to the change. (Note: This is not part of the PMBOK project management concept.)
- OCM planning: Define the level of resistance to change and prepare a plan to offset the resistance.
- Define roles and develop competencies: Identify who will serve as sponsors, change agents, change targets, and change advocates. Then, train each individual on how to perform the specific role.
- Establish burning platform: Define why the as-is process needs to be changed and prepare a vision that defines how the as-is pain will be lessened by the future state solution.
- Transformations management: Implement the OCM plan. Test for black holes and lack of acceptance. Train affected personnel in new skills required by the change.
Estimate Task Effort and Duration
Generally, the more experience someone has in performing a task, the more accurate the estimate he or she gives the project manager will be. Many variables are used to estimate how much effort (or duration) is needed to complete a particular task and how much duration (or elapsed time) will be required. These variables include known constraints, assumptions, risks, historical information, and resource capabilities. The quality of estimates is dependent on the quality of information and the project life cycle phase the project is in.
For example, if a senior programmer leaves the organization and a less experienced programmer takes his place, the actual amount of time for a programming task might be 25 to 50% higher than originally estimated. In that case, unless a contingency was placed aside, the project would run over the estimate by the amount indicated. When a person assigned to perform a task is known, it’s best to let that person estimate the task with the team leader and project manager who review the estimate. There are two well-known reasons for this procedure:
- The person performing the task should have the expertise and past experience with that type of estimated task and should be able to give an educated guess.
- If the person performing the task provides the estimate, he or she will have a sense of owning it and will work hard to achieve it.
If you don’t know who will perform the task but people with more expertise are working close to the task that needs estimating, it’s wise to let these experts prepare the estimate and then add a 25% contingency to cover a less experienced person carrying out the task.
Certain tasks are effort driven with no constraints around the duration. Others are only duration driven. For example, the walls of a house not being able to be painted until the sheetrock is taped and textured is an effort-driven task. A duration-driven task would be more like painting the walls twice: The second coat can’t be completed until the first is dried, no matter how many painters the project manager has assigned to the job.
An accepted practice with task duration is the “80-hour rule,” which establishes that each individual should have some task due approximately every 2 weeks, representing a low-level milestone for him or her to reach. The project manager must take all estimates provided by the team members and leaders, roll them up, and review the project plan as a whole. The intention here is to spot an issue with the overall project schedule by examining the proportion of phases within stage(s) or iteration(s).
Develop the Schedule
Once you’ve estimated the time it takes to perform each activity, defined each activity’s inputs and outputs, and where each of these inputs come from and where each output goes, you can start to develop a project schedule. This defines the start and finish dates for each activity. Many things must be considered when developing a schedule. Some of them are:
- Activity duration estimates
- Resource requirements
- Resource availability
- Constraints (imposed dates or milestones)
- Assumptions
- Input from other projects
- Transportation delays
- Risk management plans
- Lead and lag times
Although a number of software tools are available that can help you develop and optimize a schedule, we’ll discuss a very simple approach we’ve found to be effective. We like to start with the output delivery date and work backwards. From that point, we place the activity that will deliver that output to the customer on the right-hand side of a sheet of paper.
As an example, suppose your consulting firm has just conducted an employee-opinion survey for a customer. You’ve returned to your office with the survey sheets in hand. The next key delivery to your customer is on May 30, when you’ll present the customer-survey results. (See Figure 8.18.) Note that May 30 has a boxed-in point representing the deadline for presenting the report. Before that can happen, however, the consultant must travel to the client’s office 6 hours away, so we include May 29 to complete that step.

Employee survey feedback to the executive team.
Note also that that Saturday and Sunday aren’t listed on the timeline axis of the graph in Figure 8.18 because we don’t want to schedule work on weekends. This builds in a little safety margin in case things go wrong.
The inputs the consultant needs to present the report are the PowerPoint slides he’ll be using and copies of the report and travel arrangements. These three inputs are required for the consultant to travel to the client. Note that scheduling travel plans occurs on May 4. This is necessary because company policy requires consultants to make travel plans at least 2 weeks early to ensure minimum fares and best possible connections.
Input necessary to preparing the PowerPoint slides and duplicating the report includes having the final report proofread and approved. The latest date this can happen is Monday, May 22, because the report masters must be taken to the printer on May 23.
The input needed to proofread the report is a completed, typed report. Note that the report’s schedule requires that it be completed 5 days before it is proofread. The reason for this delay is because the consultant, who has written the report, will be on assignment and won’t be available for this project during the week of May 15.
Basically, when you create a schedule, you determine when something must be delivered and then consider the activities required to deliver that output as well as the inputs required to provide the deliverable. Then you schedule the inputs and define what’s required to generate them. This process is repeated until the schedule is complete.
Put another way, to develop a schedule, you define a deliverable and then back up to define what actions are required to produce it, including the actions’ duration, the inputs required to provide the output, and any additional transportation time that’s involved.
The problem with this approach is that often the total cycle time is unacceptably long and the start points have already passed. As an alternative, one of the following two techniques is used:
- Crushing: This is an approach in which cost and schedule are analyzed to determine how to obtain a greater amount of compression for the least increase in cost.
- Fast tracking: This is a means of determining if activities that would normally be done sequentially can be done in parallel. It also evaluates the possibility of assigning two individuals to an activity to reduce its duration. Fast tracking often results in rework and increased risk.
Five mathematical analysis techniques can help define duration limitations and reduce the total cycle time. They are:
- Critical path method (CPM): This creates a path through the schedule that defines the total project cycle. Understanding the path allows the project team to focus on a smaller group of activities to determine how to reduce the project cycle time. Each time a critical path is eliminated, a new one is created for the project team to work on.
- Critical chain method (CCM): This looks at the schedule to determine what resource restrictions have been imposed on the total cycle time. This allows you to assign additional or more skillful resources to reduce cycle time.
- Graphical evaluation and review technique (GERT): This allows for a probable treatment of both work networks and activity duration estimates.
- Program evaluation and review technique (PERT): This uses a weighted-average duration estimate to calculate activity durations. It ends up with a PERT chart view of the project.
- Simulation modeling: Some people use this method to help reduce cycle time and cost, but we haven’t found it particularly useful.
The most frequently used method to document a schedule is with a bar chart called a Gantt chart, which lists each activity that must be performed and visually indicates an activity’s duration as well as the interrelationships between activities. (See Figure 8.19.)
Project Management Software
A key part of project management is a very good work breakdown structure (WBS). There are many different software packages that can help with the task of developing the WBS. Microsoft Project Office software is the most used product.
IBM has created an IBM Project Management Center of Excellence that has developed a Worldwide Project Management Method (WWPMM). The WWPMM contains 13 knowledge areas that group 150 different processes. The IBM Project Management Center of Excellence defines successful operations by four factors:
- All project management professionals are knowledgeable, accountable, and part of a respected learning community.
- Employees in all professions understand and practice their roles and responsibilities.

Combined 3-year improvement plan.
- All management systems, infrastructure, and staff organizations support project management with portfolio, program, and project views.
- Mechanisms are in place to sustain learning and continuous improvement of project management disciplines.
The IBM Project Management Center of Excellence defines a five-level maturity model as follows:
- Level I: Pilot phase. (Ad hoc-type operation.)
- Level II: In deployment. (The project management process is disciplined. Roles and responsibilities are specified in the project plan.)
- Level III: Functional. (The project management process is standardized, consistent, and has defined practices.)
- Level IV: Integrated. (The project management process produces predictable results. Monitoring and management tools are in place.)
- Level V: World class. (The project management process is continuously improving. A knowledge base provides continuous feedback and prompts upgrades that reflect best practices. Lessons learned are continuously included in the process design.)
The IBM Project Management Center of Excellence developed an education curriculum to provide the best project management education available in the industry. This curriculum translates education into effective business advantage through knowledge prerequisites, periodic testing, applied work experience, and a progressive course structure that builds upon previous classes. In 1992 IBM began certifying its project managers. The certification process provided the company with managers who could apply the latest technologies and methods. In addition, certified project managers were required to recertify every 3 years, thereby ensuring constant exposure to the most recent and advanced project management initiatives and experiences.
IBM conducted an extensive benchmarking study of project management software packages available around the world and selected two products:
- Microsoft Project Office
- Systemcorp PMOffice
The advantages and disadvantages of each of these are listed in Table 8.3.
As a result of its increased focus on project management, IBM greatly reduced cost, wasted effort, schedule overruns, and project failures throughout the organization.
Advantages and Disadvantages
| Project Office Software | PMOffice Software |
|---|---|
|
|
| Advantages | Advantages |
|
|
| Disadvantages | Disadvantages |
|
|
Project Management Software Selection
Essex Electrical tried many combinations to make its IT project successful. As the company president, Harold Karp, put it, “I’ve had teams that were headed up by just business executives, and I’ve had them headed up by just an IT executive. In both cases the teams achieved only limited success.” When they switched over to a project management approach, IT operating expenses dropped by 35%, and sales gained 1%, which translated into margins of 2.5 to 3%.
Well-managed projects do make a difference, according to a December 2003 article in CRM Magazine: As a result of effectively implementing a customer relationship management project, Waters Corp. was able to:
- Achieve an overall ROI of 35%
- Nearly triple sales
- Increase e-commerce revenue by 300%
- Generate additional revenue of $2 million in the service department alone
Projects represent a significant investment of strategic importance to any organization. The investment is comprised of resources, capital expenditure, time commitment, and individual dedication to make and embrace a change that will enable the organization to improve business performance and strengthen its competitive position.
Because projects are so critical to an organization’s continued growth, it’s important to generate a project postmortem. This document consolidates and outlines essential project best practices and identifies any negative lessons learned so that other project managers don’t have to make the same mistakes.
A postmortem verifies the following:
- Did the project realize business benefits?
- Did the project deliverables meet requirement objectives?
- What best practices could be passed on to other project managers?
- What lessons learned should other project managers look out for?
- Did the project result in customer satisfaction?
- Which resources excelled during this project?
Answering these questions for senior management will help them understand the project outcome. The information will also enable the organization to continue using its best resources on other projects.
The Project Management Body of Knowledge (PMBOK) and other standards define 75 different tools that a project manager should master. Few project managers I’ve met during the past 50 years have mastered all these tools. Today very few project managers are certified as such by their peers. The Project Management Institute has an excellent certification program that we highly recommend. As an executive, you should select certified project managers to run your projects.

PMBOK Tools and Techniques
Some of the more commonly used project management tools and techniques (as recommended by the Project Management Institute and others) are listed in Table 8.4. Evaluate yourself to determine your project management maturity level. For each one, check off your present level:
- Do not know it
- Know it but have not used it
- Used it
- Mastered it
If you would like more information on these or other improvement tools, contact the Harrington Institute: www.harrington-institute.com.
Using the sum of the four individual point scores, the following is your project manager maturity level:
|
175–225 |
|
125–174 |
|
100–124 |
|
50–100 |
|
0–50 |
PMBOK Tools
| Don’t Know It | Know It but Haven’t Used It |
Used It | Mastered It | |
|---|---|---|---|---|
| 1.Arrow diagramming method (ADM) | ||||
| 2.Benchmarking | ||||
| 3.Benefit-cost analysis | ||||
| 4.Bidders conferences | ||||
| 5.Bottom-up estimating | ||||
| 6.Change control system | ||||
| 7.Configuration management | ||||
| 8.Checklists | ||||
| 9.Communications skills | ||||
| 10.Computerized tools | ||||
| 11.Conditional diagramming methods | ||||
| 12.Contingency planning | ||||
| 13.Contract change control system | ||||
| 14.Contract type selection | ||||
| 15.Control charts | ||||
| 16.Control negotiation | ||||
| 17.Cost change control system | ||||
| 18.Cost estimating tools and techniques | ||||
| 19.Decision trees | ||||
| 20.Decomposition | ||||
| 21.Design of experiments | ||||
| 22.Duration compression | ||||
| 23.Earned value analysis | ||||
| 24.Expected monetary value | ||||
| 25.Expert judgment | ||||
| 26.Flowcharting | ||||
| 27.Human resource practices | ||||
| 28.Information distribution tolls and techniques | ||||
| 29.Independent estimates | ||||
| 30.Information distribution systems | ||||
| 31.Information retrieval systems | ||||
| 32.Interviewing techniques | ||||
| 33.Make-or-buy analysis | ||||
| 34.Mathematical analysis | ||||
| 35.Negotiating techniques | ||||
| 36.Network templates | ||||
| 37.Organizational procedures development | ||||
| 38.Organizational theory | ||||
| 39.Parametric modeling | ||||
| 40.Pareto diagrams | ||||
| 41.Payment system analysis | ||||
| 42.Performance measurement analysis | ||||
| 43.Performance reporting tools and techniques | ||||
| 44.Performance reviews | ||||
| 45.Pre-assignment technique | ||||
| 46.Precedence diagramming method (PDM) | ||||
| 47.Procurement audits | ||||
| 48.Product analysis | ||||
| 49.Product skills and knowledge | ||||
| 50.Project management information system (PMIS) | ||||
| 51.Project management information system organizational procedures | ||||
| 52.Project management software | ||||
| 53.Project management training | ||||
| 54.Project planning methodology | ||||
| 55.Project selection methods | ||||
| 56.Quality audits | ||||
| 57.Quality planning tools and techniques | ||||
| 58.Resource leveling heuristics | ||||
| 59.Reward and recognition systems | ||||
| 60.Schedule change control system | ||||
| 61.Scope change control system | ||||
| 62.Screening system | ||||
| 63.Simulation modeling | ||||
| 64.Stakeholder analysis | ||||
| 65.Stakeholder skills and knowledge | ||||
| 66.Statistical sampling | ||||
| 67.Statistical sums | ||||
| 68.Status review meetings | ||||
| 69.Team-building activities | ||||
| 70.Trend analysis | ||||
| 71.Variance analysis | ||||
| 72.Weighting system | ||||
| 73.Work authorization system | ||||
| 74.Work breakdown structure templates | ||||
| 75.Workaround approaches | ||||
| Total | ||||
| Times weight | 0 | 1 | 2 | 3 |
| Point score |
Sum of the four individual total: —
Any project manager who has a point score below 125 needs project manager training.
A project is managed through a series of interaction of iterative process groups through its life cycle phases. (See Figure 8.20.) Figure 8.21 provides a complete view of how the project management process model is linked to developing a new product, service, or system.
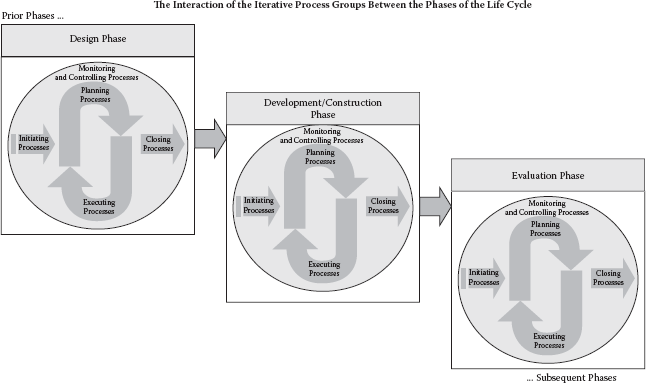
Interaction of iterative process groups among a project life cycle’s phases.

The iterative project management process model and product/system development.
Examples
Table 8.5 describes the approaches required to do just one part of managing a project risk management. With a list of approaches so long, it is easy to see that managing a project is not for the weak of heart or the inexperienced. (See Figures 8.22 to 8.24 and Table 8.6.)
Methods Used in Risk Analysis
| Method | Description and Usage |
|---|---|
| Event tree analysis | A hazard identification and frequency analysis technique that employs inductive reasoning to translate different initiating events into possible outcomes. |
| Failure mode and effects analysis and failure mode and effects criticality analysis | A fundamental hazard identification and frequency analysis technique that analyzes all the fault modes of a given equipment item for their effects both on other components and the system. |
| Fault tree analysis | A hazard identification and frequency analysis technique that starts with the undesired event and determines all the ways in which it could occur. These are displayed graphically. |
| Hazard and operability study | A fundamental hazard identification technique that systematically evaluates each part of the system to see how deviations from the design intent can occur and whether they can cause problems. |
| Human reliability analysis | A frequency analysis technique that deals with the impact of people on system performance and evaluates the influence of human errors on reliability. |
| Preliminary hazard analysis | A hazard identification and frequency analysis technique that can be used early in the design stage to identify hazards and assess their criticality. |
| Reliability block diagram | A frequency analysis technique that creates a model of the system and its redundancies to evaluate the overall system reliability. |
| Category rating | A means of rating risks by the categories in which they fall in order to create prioritized groups of risks. |
| Checklists | A hazard identification technique that provides a listing of typical hazardous substances and/or potential accident sources that need to be considered. Can evaluate conformance with codes and standards. |
| Common mode failure analysis | A method for assessing whether the coincidental failure of a number of different parts or components within a system is possible and its likely overall effect. |
| Consequence models | The estimation of the impact of an event on people, property, or the environment. Both simplified analytical approaches and complex computer models are available. |
| Delphi technique | A means of combining expert opinions that may support frequency analysis, consequence modeling, and/or risk estimation. |
| Hazard indices | A hazard identification/evaluation technique that can be used to rank different system options and identify the less hazardous options. |
| Monte-Carlo simulation and other simulation techniques | A frequency analysis technique that uses a model of the system to evaluate variations in input conditions and assumptions. |
| Paired comparisons | A means of estimation and ranking a set of risks by looking at pairs of risks and evaluating just one pair at a time. |
| Review of historical data | A hazard identification technique that can be used to identify potential problem areas and also provide an input into frequency analysis based on accident and reliability data, etc. |
| Sneak analysis | A method of identifying latent paths that could cause the occurrence of unforeseen events. |

Model project plan activity per four major phases.
Block diagram of the project management process.
Excerpt from a typical work breakdown structure.
Project Processes and Phases
| Phases | ||||
|---|---|---|---|---|
| Processes | Conception | Development | Realization | Termination |
| Strategic Project Process | ||||
| Strategic project process | Ä | x | x | x |
| Operational Process Groups and Processes within Groups | ||||
| Scope-Related Operational Processes | ||||
| Concept development | Ä | |||
| Scope definition | Ä | x | ||
| Task definition | x | Ä | x | |
| Task realization | Ä | Ä | x | |
| Change management | Ä | Ä | ||
| Time-Related Operational Processes | ||||
| Key event schedule planning | x | Ä | x | |
| Activity dependency planning | x | Ä | ||
| Duration estimation | x | Ä | ||
| Schedule development | Ä | x | ||
| Schedule control | x | Ä | x | |
| Cost-Related Operational Processes | ||||
| Cost estimation | Ä | x | ||
| Budgeting | Ä | x | ||
| Cost control | x | Ä | x | |
| Resource-Related Operational Processes (Except Personnel) | ||||
| Resource planning | x | Ä | x | |
| Resource control | x | Ä | x | |
| Personnel-Related Operational Processes | ||||
| Organizational structure definition | x | Ä | Ä | |
| Responsibility identification and assignment | x | Ä | x | |
| Staff planning and control | x | Ä | x | |
| Team building | x | Ä | Ä | x |
| Communication-Related Operational Processes | ||||
| Communication planning | x | Ä | ||
| Meeting management | x | Ä | Ä | x |
| Information distribution | Ä | Ä | x | |
| Communication closure | x | Ä | ||
| Risk-Related Operational Processes | ||||
| Risk identification | Ä | Ä | x | |
| Risk assessment | Ä | Ä | x | |
| Solution development | Ä | x | ||
| Risk control | x | Ä | ||
| Procurement-Related Operational Processes | ||||
| Procurement planning | x | Ä | ||
| Requirements documentation | x | Ä | ||
| Supplier evaluation | x | Ä | ||
| Contracting | Ä | x | ||
| Contract administration | x | Ä | x | |
| Product-Related Operational Processes | ||||
| Design | x | Ä | ||
| Procurement | x | Ä | ||
| Realization | Ä | |||
| Commissioning | Ä | |||
| Integration-Related Operational Processes | ||||
| Project plan development | Ä | |||
| Project plan execution | Ä | Ä | Ä | |
| Change control | Ä | Ä | ||
| Supporting Processes | ||||
Legend: Ä = key process in the phase, x = applicable process in the phase.
Additional Reading
Badiru, A.B., and G.E. Whitehouse. Computer Tools, Models, and Techniques for Project Management (Blue Ridge Summit, PA: TAB Books, 1989).
Block, Robert. The Politics of Projects (New York: Yourdon Press, 1983).
Cleland, David, and Roland Gareis (eds.). Global Project Management Handbook (New York: McGraw-Hill, 1994).
Dinsmore, Paul C. The AMA Handbook of Project Management (New York: AMACOM Books, 1993).
Dinsmore, Paul C. Human Factors in Project Management (New York: AMACOM Publications, 1990).
Focardi, S., and C. Jonas. Risk Management: Framework, Methods and Practice (New York: McGraw-Hill, 1998).
Harrington, H. James, and Thomas McNellis. Project Management Excellence (Chico, CA: Paton Press, 2006).
ISO/DIS 10006: Guidelines to Quality in Project Management (Geneva: International Organization for Standardization, 1998).
Project Management Institute. A Guide to the Project Management Body of Knowledge (Sylva, NC: Project Management Institute, 1996).
Project Management Institute Standards Committee. A Guide to the Project Management Body of Knowledge (Upper Darby, PA: Project Management Institute, 1996).
QUALITY FUNCTION DEPLOYMENT (QFD)
Prepared by Dave Farrell
Just the Facts
The words quality function do not refer to the quality department, but rather to any activity needed to assure that quality is achieved, no matter what department performs the activity.
In QFD, all operations of the company are linked to, and driven by, the voice of the customer. This linkage brings quality assurance and quality control to all relevant functions in the organization and shifts the focus of quality efforts from the manufacturing process to the entire development, production, marketing, and delivery process. QFD provides the methodology for the entire organization to focus on what the customers like or dislike, and puts the emphasis on designing in quality at the product development stage, rather than problem solving at later stages.
Typical users of QFD in the United States include AT&T Bell Labs, Black & Decker, Chrysler, DEC, DuPont, Eaton, Ford, General Electric, General Motors, Hewlett-Packard, Johnson Controls, Kraft Foods, Proctor & Gamble, Rockwell, Scott Paper, Sheller-Globe, Texas Instruments, and Xerox. Organizations such as these consistently report benefits, including:
- Measurable improvement in customer satisfaction/market share
- Reduction in time-to-market (product development cycles)
- Significant reduction in the number of engineering changes
- Start-up costs reduced
- Identification of competitive advantage and marketing strategy
- Reduction in warranty claims and customer complaints
- Increase in cross-functional teamwork
The House of Quality, a matrix format used to organize various data elements, so named for its shape, is the principal tool of QFD. (See Figure 8.25.) Although “house” designs may vary, all contain the same basic elements:
- Whats: The qualities or attributes the product or service must contain, as required by the customer. Whats are compared to competitors’ qualities and ranked by importance.
- Hows: The technical means for satisfying the whats, including the exact specifications (how much) that must be met to achieve them.

Basic QFD matrix.
- Correlation matrix: An evaluation of the positive and negative relationships between the hows, sometimes called the “roof.”
- Relationship matrix: An evaluation of the relationships between the whats and hows. It identifies the best ways to satisfy the customer and generates a numerical ranking used as a guide throughout the development process.
These Houses of Quality are used in each of the four primary phases of QFD:
- Product planning phase: Where customer requirements are identified and translated into design specifications or product control characteristics in the form of a planning matrix.
- Parts development phase: Translates the outputs of the product planning phase (design specifications) into individual part details that define part characteristics.
- Process planning phase: Defines the process for making each component and establishes critical component parameters.
- Operating instructions (production planning): Define the production requirements for each component/operation.
Using QFD
Richard Tabor Green points out in his book Global Quality that QFD was designed to:
- Translate observed customer behavior into customer wants
- Translate customer articulations into customer wants
- Translate competitor success at meeting customer wants into a threat assessment
- Translate competitor process capabilities into a threat assessment
- Translate customer wants and competitor threat assessment into a market opportunity map
- Translate a market opportunity map into product lines and release schedules
- Translate product lines and release schedules into product development projects
- Translate product development projects into part and process specifications
- Translate part and process specifications into operation specifications
- Translate operation specifications into delivery and service specifications
We agree that the House of Quality looks very complex and confusing, but it does contain a great deal of information. To help you understand this complex picture, we will discuss the major parts of the House of Quality. By understanding the parts, you will be able to see how they blend together to provide a very effective weapon.
Effective application of QFD is likely to require significant change in the way an organization operates. Substantial training and planning are involved. There are new tools to be learned. Cross-functional teamwork capability will be put to the test. Purchasing, sales, and engineering organizations will be involved in product or service design and development to a degree never previously experienced. All of these factors suggest that success, even of a limited project, is dependent on a high level of management commitment. As with any significant change effort, effective sponsorship by key management personnel of each affected organization is essential. Attention should be given at the outset to the principles and methodologies of organizational change management, which are beyond the scope of this chapter.
To maintain sponsor commitment, senior management personnel should be involved in the selection of initial projects. The selection team should identify a wide variety of potential projects and formally apply an agreed upon set of evaluation criteria (for example, market share, product life cycle, cost reduction potential, revenue enhancement potential, market share implications, need for time-to-market reduction, competitive position, organizational commitment, potential for success, alignment with business plan/strategy, etc.).
With the project selected, it is now time to select the QFD team leader and members. Care should be taken to include participants from all key organizations involved from the product (or service) concept/design through to delivery and after-sale service. It is likely that the core team will be augmented by additional people at different stages of the QFD process, as additional detail is required.
The core team’s initial activity should include the development of a team charter, including mission, objectives, guidelines for team conduct, work plan, and a timetable. The team charter should be shared with the executive group to assure alignment on mission, objectives, and expectations. Consensus around a team charter also clarifies the resources that will be required, and avoids midproject surprises that can derail the effort. The team should also plan for periodic status reporting (at a minimum, upon the completion of each QFD phase) to the executive group to maintain sponsor awareness and commitment.
Time spent early in the process in team building and member training is an investment well worth the effort. It is important that team members understand the QFD methodology at the outset, have an agreed upon roadmap of the process they are going to follow, and possess basic team skills. In addition, competence in the related methodologies and tools described in this book will substantially enhance the effectiveness of the team and the success of the QFD project.
Voice of the Customer
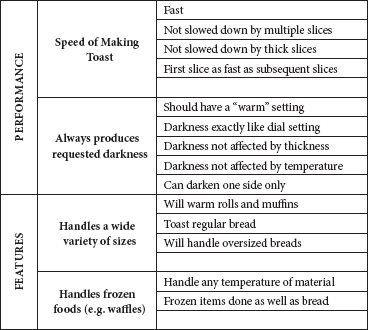
This is not only where QFD begins, but it is the foundation on which every step that follows is based. In this phase we abandon previous practices of assuming that we know what the customer wants and needs, or worse yet, a marketing philosophy predicated on the notion that we can “sell” the customer on what we already have to deliver. We begin by really listening to the customer’s expression of his or her requirements, in his or her own terms. And we probe for a level of detail heretofore unidentified. A variety of sources and market research tools should be considered, including follow-up letters to customers, observations of the customers using the product, interviews, focus groups, “buff” magazines, independent product reviews, trade shows, sales contacts, printed and/or telephonic surveys, etc. Also, the past history of unsolicited customer feedback should be reviewed, such as customer returns, complaint letters, and accolades. Product or service dimensions around which customer input is sought can include any or all of the following: performance, features, reliability, conformance, durability, serviceability, safety, environmental, aesthetics, perceived quality, and cost. Examples of the application of these dimensions in the case of a toaster are shown in Table 8.7.
Requirements for Typical Toaster
| Dimension | Possible Customer Requirement Statement |
|---|---|
| Performance |
|
| Features |
|
| Reliability |
|
| Durability |
|
| Serviceability |
|
| Aesthetics |
|
| Safety |
|
Customer requirements can also be expressed at multiple levels of detail, commonly called primary, secondary, and tertiary. The customer requirements, so expressed, become the vertical axis of the top portion of the planning matrix, as shown in Figure 8.26.
While collecting customer requirements information, the relative importance of each characteristic should be identified (using a numerical rating scale) to enable prioritization of those characteristics. This information will be used in conjunction with the competitive evaluation to assure favorable performance measures on those characteristics most important to the customer. The prioritization data will be entered on the right side of the top portion of the matrix in the column labeled “Customer Importance Rating.”
Breakdown of a voice of the customer for a toaster.
Next, the final product control characteristics (design requirements) are identified and arranged across the top horizontal row of the matrix. (See Figure 8.27.) These are measurable characteristics that must be deployed throughout the design, procurement, manufacturing, assembly, delivery, and service processes to manifest themselves in the final product performance and customer acceptance.
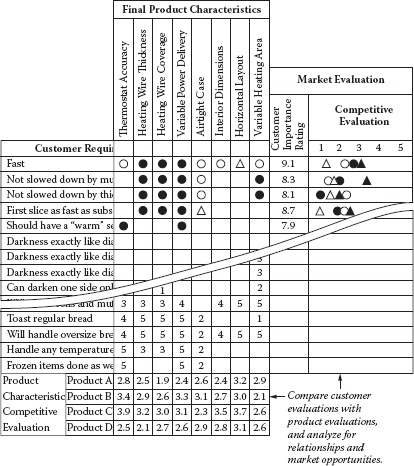
Since not all of the relationships between customer requirements and the corresponding final product control characteristics will be equally strong, the next step involves building a relationship matrix to display all of those relationships (using either symbols or numerical values) to further enable focus on those which are most highly related to high-priority requirements. It is a way to validate that design features cover all characteristics needed to meet customer requirements. An example of the relationship matrix is shown in Figure 8.28.
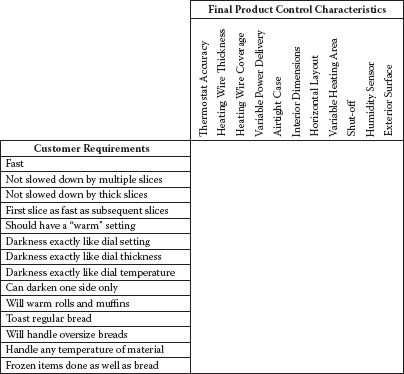
Typical final product characteristics for a toaster.
At a very minimum, every important customer requirement should have at least one product characteristic that has a medium or strong relationship to it. If this is not the case, additional product characteristics should be added to correct this void. The relationship matrix also serves the important function of identifying conflicting requirements, for example, high strength versus low weight. When such conflicts are identified, the application of Taguchi methods as mentioned above is indicated to optimize design characteristics.
While analyzing the relationship matrix and its implications, it is important to keep open to the possibility of modifying or adding to the list of product control characteristics.
The next step is completion of the market evaluation, including both the customer importance rating and competitive evaluations, on the right side of the top portion of the matrix. (See Figure 8.29.) This section displays the comparative strengths and weaknesses of the product in the marketplace around those requirements most important to the customer. The data for the competitive evaluation can come from the same sources as the customer requirements data, from independent or internal product testing, and from independent benchmarking of product characteristics as described briefly above. As such, the comparisons can be based on both objective and subjective data.

Toaster voice of the customer/product control characteristics relationship matrix.
The company’s and competitor’s present performance data for the final product control characteristics are entered in the lower section of the matrix in the columns for each relevant characteristic, as shown in Figure 8.30.
The present performance data are next used to establish performance targets for relevant characteristics that, when achieved, will position the product as highly competitive or best in class. Target data are displayed immediately below the corresponding competitive data, as shown in Figure 8.31.

Comparison to the competition.
The final element of the planning matrix is the selection of those product quality characteristics that are to be deployed through the remainder of the QFD process. Those that are a high priority to the customer, have poor competitive performance, or require significant improvement to achieve established target levels should be taken to the next level of QFD analysis.
Part Deployment Phase
The matrix begins with the outputs of the planning matrix, in particular the overall product quality characteristics, and defines their deployment down to the subsystem and component levels. In the process, the component part characteristics that must be met in order to achieve the final product characteristics are identified, and the matrix indicates the extent of the relationship between the two, as shown in Figure 8.32. It is the critical component characteristics that will be deployed further and monitored in the later stages of QFD.
Product characteristic competitive evaluation.
It should be noted that a focus on high-priority characteristics is crucial from this point forward. Experience has shown that a number of QFD teams have lost focus or energy at this point due to the apparent complexity of the process or the sheer number of charts or possible correlations. To start, work to identify the three to five most critical finished component characteristics and concentrate on these. When the results have been deployed through the remaining steps with success, you can go back and address the next-higher-priority part characteristics.

Performance targets displayed.
The Process Plan and Quality Plan Matrices
In the previous step, critical component part characteristics were identified. We are now ready to identify the process used to produce those parts, the steps in the process that are critical to those characteristics, the appropriate control points in the process to assure conformance to requirements, and the process monitoring plan. These data are displayed in the process planning matrix. (See Figure 8.33.)

Breakdown of product control characteristics to component parts characteristics.
The Roof of the House of Quality
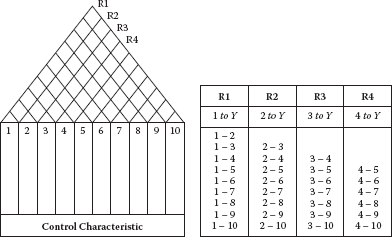
To complete the House of Quality, we need to put a roof on it. The roof of the House of Quality is used to analyze the interactions between characteristics. (See Figure 8.34.) Basically two characteristics can have one of three types of relationships:
- As one changes, it has no impact upon the other.
- As one changes for the better, it has a negative impact on the other.
- As one gets better, it has a positive impact upon the other.

Process planning matrix.
The roof of the House of Quality.
In Figure 8.34 row 1 is made up of ten diamonds. The diamond at the lower left-hand end of the row analyzes the interactions between characteristics 1 and 2. The second diamond analyzes the interactions between characteristics 1 and 3, etc. The diamond on the lower left-hand end of the row labeled R2 analyzes the interaction between characteristics 2 and 3, etc. By analyzing the interactions between each diamond that makes up the House of Quality roof, all the interactions between the different characteristics are analyzed. To pictorially show the interactions, the following codes are recorded in the related diamonds:
- No interactions
- Negative interaction
- Positive interaction
Some people choose to put nothing in the diamond that has no interaction, but we feel this is poor practice because there is no visual evidence that the interactions were analyzed. Some individuals carried out the analysis to further classify the interactions in five categories.
- Strong positive
- Strong negative
- No interaction
- Negative
- Strong negative
In the more sophisticated models point scores are assigned that indicate the interrelationship’s strengths or weaknesses. For example:
- Plus 4 points is given to relationships that have a strong positive impact upon each other.
- Plus 2 points is given to relationships that have a medium positive impact upon each other.
- No points are given when there is no interaction.
- Minus 2 points is given to relationships that have a medium negative impact on each other.
- Minus 4 points is given to relationships that have strong negative impacts on each other.
With the addition of the roof on top of the House of Quality, we have now completed the quality function deployment of one level. In reality, the House of Quality should be broken down from:
- Voice of a customer to design specifications
- Design specifications to parts characteristics
- Parts characteristics to manufacturing operations
- Manufacturing operation to production requirements
At each one of these breakdowns a new House of Quality is often prepared to help understand the product and how it relates to the voice of the customer.
As with previous matrices, symbols or numerical values can be used in the process plan matrix to show the strengths of the relationships. Control points are established at the steps in the process that are critical to meeting component characteristics. They establish the data and the strategy for achieving product characteristics that meet high-priority customer requirements.
In the quality plan matrix, the process steps can be displayed in flowchart format, and the control points and checking methods for each control point are taken to a more specific level of detail. It is the latter information that forms the basis for developing the final QFD document, operating instructions.
Operating Instructions
Unlike previously described matrices, the operating instructions in QFD do not have a single prescribed format. They may be designed to meet the specific characteristics of the process and needs of the process operators.
The essence of this final step, other than implementation, is to deploy the results of the quality plan to the people who will be executing it. The instructions should be in sufficient detail to provide needed information, in a useful format, on what to check, when to check it, how to check it, what to check it with, and what parameters are acceptable. This step makes the final connection between the work of the operator and his or her ultimate objective of satisfaction of the customer’s requirements.
Summary
QFD is one of the most rapidly growing methodologies in the quality arsenal. Its successful application requires management’s willingness to invest the three T’s—time, tools, and training. There are a number of issues to be considered before adopting the process. Training and implementation time and costs can be significant. Do you have sufficient sponsor commitment to sustain the effort over time? How successful has the organization been at other cross-functional team efforts? How are you going to incorporate ongoing process improvements into the QFD documentation system? QFD can be complex to administer. Who is going to be responsible for that task? Product revisions, although fewer in number, require effort to integrate into the entire system. The increased effort at planning stages, rather than implementation, requires a cultural shift in many organizations.
As Ted Kinni put it, in concluding his November 1, 1993, Industry Week article, “Simply put, QFD is work. On the other hand, its growing popularity indicates that faster and less expensive development cycles, improved quality and reliability, and greater customer satisfaction are well worth the effort.”
Examples
Examples are included in the text. Figure 8.35 is a detailed view of the House of Quality. Figure 8.36 shows how QFD drives down through four levels of documents to keep them all focused on the voice of the customer.

House of Quality for the product planning level.

How QFD drives down through four levels of documents.
- Voice of the customer/customer requirements
- Product characteristics
- Correlation between characteristics
- Market evaluation
- Characteristic relationships
- Design competitive assessment
- Limiting factors
Additional Reading
Akao, Yoji (ed.). Quality Function Deployment: Integrating Customer Requirements into Product Design (Portland, OR: Productivity Press, 1990).
Bossert, James L. Quality Function Deployment: A Practitioner’s Approach (Milwaukee, WI: ASQ Quality Press, 1990).
Cohen, Lou. Quality Function Deployment: How to Make QFD Work for You (Milwaukee, WI: ASQ Quality Press, 1995).