
7
Black Belt Nonstatistical Tools (A through M)
Without sound data you can’t make sound decisions.
—H. James Harrington
INTRODUCTION
In this chapter a number of very important tools are presented. Read them carefully and take time to think about how you can apply each of the tools to one of the improvement opportunities that are available within your organization and/or the problems that you solve as an SSGB or LSSBB.
In many organizations the LSSBB will be required to teach these tools and the Green Belt tools to Six Sigma Team members. Take time to think about how you would teach each tool to the people who would make up a Six Sigma Team that you would be leading. We recognize that you may feel that you don’t have the experience or the skills to teach all of these and the SSGB tools after just reading about them or just attending a class on them. That is why before a person can function fully and effectively as an LSSBB, he or she needs to have experience working on projects. It is best if the potential LSSBB has already been introduced to some of these tools when he or she was working on a project led by an LSSBB.
The tools that are presented in this chapter include the following:
- 5S
- Benchmarking
- Bureaucracy elimination
- Conflict resolution
- Critical to quality
- Cycle time analysis and reduction
- Fast-action solution technique
- Foundation of Six Sigma
- Just-in-time
- Matrix diagrams/decision matrix
- Measurement in Six Sigma
5S

Just the Facts
5S is a system to optimize productivity by reducing waste and maintaining an orderly workplace. These actions are geared to achieving better and more efficient operational results. This is usually the first method implemented when starting a Lean process. It is intended to clean up and organize the workplace to make it more effective and efficient.
Example
Organizing the placement of tools and replacing tools in their specified location allows for more efficiency in the use of the tools. A simple look at the storage area will immediately show which tools are missing or in use. (See Figure 7.1.)
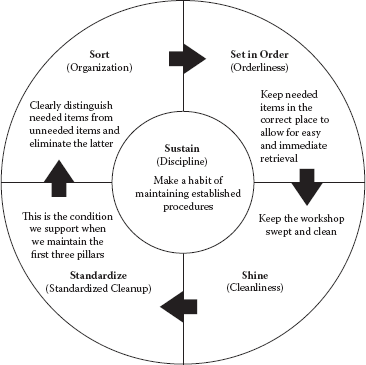
The 5S approach.
Additional Reading
Picard, Daniel (ed.). The Black Belt Memory Jogger (GOAL/QPC and Six Sigma Academy, Salem, NH, 2002).
Wortman, Bill. The Certified Six Sigma Black Belt Primer (Quality Council of Indiana, West Terre Haute, 2001).
BENCHMARKING OF PROCESSES
Just the Facts
Xerox started the recent enthusiasm for process benchmarking when it credited benchmarking as the tool that caused the company’s performance to turn around in the mid-1980s. As John Cooney, one of Xerox’s marketing managers, puts it, “Benchmarking has become a way of life at Xerox.”
Benchmarking helps organizations bring on new ideas. It makes organizations reexamine the way they are doing things. When U.S. organizations dominated the world’s market, they didn’t have outside pressures driving their improvement efforts, so they could take their own sweet time. Today U.S. organizations no longer dominate the world’s market, so their benchmarking activities must take on an international focus.
Don’t misunderstand. The United States is not second best in everything. In many industries, it is still the world leader. But there is a lot of competition out there, hungry to take away customers. Foreign competitors are just as creative as American organizations; for example, foreign organizations accounted for over 50% of new U.S. patents in 1994. And they can still remember what it is like to go hungry. In my view, there is a direct correlation between the last time a worker went hungry and his or her work ethic.
IBC, based in Houston, Texas, conducted a survey of 76 organizations and found that:
- Benchmarking was considered to be a necessary tool for survival.
- Most firms did not know how to systematically conduct a benchmarking project.
- 95% of the organizations surveyed felt that most firms do not know how to benchmark.
- 79% of the organizations believed that top management must be very actively involved if the benchmarking process is going to be successful.
In a survey of 770 organizations in Europe, the Benchmarking Centre (UK) found that:
- 89% of the organizations rated “finding competent benchmarking partners” as their most important requirement.
- 70% of the UK organizations were doing benchmarking.
- 95% of the organizations were willing to share information with a benchmarking center.
During World War II a recruitment poster read: “Join the Navy and see the world.” Too many managers and professionals today view benchmarking in the same light. They have changed the slogan to read: “Join a benchmarking team and see the world.” This is far from the truth. Studies show that for every hour spent visiting a benchmarking partner’s site, over 200 hours are required in planning, collecting, and analyzing data and implementing changes. Benchmarking is not site visits. It is creative analysis of thousands of pieces of information to bring about a change in the benchmark item—a change that is often as drastic as the caterpillar’s transformation into the monarch butterfly.

When all is said and done, the most difficult part of the benchmarking process is awakening to the fact that your operation does not know it all. Most U.S organizations are just too egotistical to admit that they can learn anything from another organization. The benchmarking process starts when you admit that your counterparts in Mainland China, Portugal, Malaysia, Sweden, the United Kingdom, France, and elsewhere may have an idea that is better than yours.
David T. Kearns, chief executive officer of Xerox Corporation, defines benchmarking as “the continuous process of measuring products, service, and practices against the toughest competition or those companies recognized as industrial leaders.” Benchmarking is a never-ending discovery and learning experience that identifies and evaluates best processes and performance in order to integrate them into an organization’s present process to increase its effectiveness, efficiency, and adaptability. It provides a systematic way to identify superior products, services, processes, and practices that can be adopted or adapted to your environment to reduce costs, decrease cycle time, cut inventory, and provide greater satisfaction to your internal and external customers.
Benchmarking is often viewed as simply purchasing competitive products to compare them with the ones manufactured by the organization. This is called product benchmarking or reverse engineering and is not the one that will be discussed in this approach.
Process benchmarking is a lot like a detective story, and the person doing the benchmarking operates a lot like a detective. He or she must search through the many clues available in the public domain to find leads and then follow up on these leads to identify and understand the truly world-class processes. It can be an exciting and enlightening adventure.
What Will Benchmarking Do for You?
Benchmarking requires a lot of work, and once you start, it is an ongoing process to keep it updated. Why, then, should any organization even begin? It is because the benefits of benchmarking far outweigh the effort and expense. Benchmarking:
- Provides you with a way to improve customer satisfaction
- Defines best applicable processes
- Improves your process
- Helps eliminate the “not invented here” syndrome
- Identifies your competitive position
- Increases the effectiveness, efficiency, and adaptability of your processes
- Transforms complacency into an urgent desire to improve
- Helps set attainable but aggressive targets
- Increases the desire to change
- Allows you to project future trends in your industry
- Prioritizes improvement activities
- Provides your organization with a competitive advantage
- Creates a continuous improvement culture
- Improves relationships and understanding between benchmarking partners
History of Benchmarking
During the 1960s, IBM realized that its costs could be reduced significantly, and the quality of its process-sensitive products improved, if its worldwide locations adopted the best existing practices. As a result, a corporate procedure was written requiring all process-sensitive products to be manufactured using compatible processes. This launched a corporate-wide effort to have common practices at all locations or, if that proved impractical, to have compatibility between common processes. The determination to identify the best manufacturing processes gave IBM a significant international competitive advantage.
In the late 1970s, in a similar move, Xerox decided to compare its U.S. products with those of its Japanese affiliate, Fuji-Xerox. Xerox was shocked to discover that Fuji was selling copiers at a price equivalent to what it cost U.S. Xerox to manufacture the copiers. This discovery spearheaded a successful program to reduce costs in the U.S. manufacturing process. Based on the success of this pilot program, Xerox management later incorporated benchmarking as a key element in its corporate-wide improvement efforts. The formal initiation of the program began around 1983. Through this program, benchmarking took on new dimensions, and benchmarking techniques were applied to support processes as well as product processes.
Today many organizations use benchmarking to help drive their continuous improvement efforts. For example, Motorola cites benchmarking as one of the major tools powering its improvement process, for which it was awarded the Malcolm Baldrige Award in 1988.
Types of Benchmarking
Essentially, there are two generic types of benchmarking:
- Internal
- External
Internal Benchmarking
Internal benchmarking compares practices within one part of an organization to those of a more advanced unit within the same organization. This type of benchmarking is the easiest to conduct because there are no security and confidentiality problems to overcome.
The 14 Steps to Do Internal Benchmarking
There are 14 basic steps in an internal benchmarking effort:
- Identify what to benchmark. Identify the products, processes, and/or activities that should be benchmarked. Plan to develop a database of benchmarking information.
- Obtain management support. Obtain management support for the benchmark activities. This support must include project approval and approved human and financial resources. It may be beneficial to form a corporate benchmark committee, both to build a base of support and to review the data after they are collected.
- Develop benchmark measurements. Benchmark measurements use both qualitative and quantitative data.
- Determine how to collect data. Four commonly used data collection methods are:
- Exchange of process data, procedures, and flowcharts
- Telephone interviews and surveys
- Joint committees
- Site visits
In most cases, all four will be used.
- Review plans with location experts. Search out people who understand the process being evaluated and ask them to:
- Review the data plan
- Recommend other locations that are doing the same or similar activities well
- Suggest contacts for information
- Select locations. Select the locations to be benchmarked using the updated data collection plan.
- Exchange data. Contact key process people within your location or from other locations and explain what you are trying to accomplish. Ask them to become partners in the benchmarking effort. Offer to send them copies of your measurement data, procedures, and process flowcharts. Request that they review these data and send back their data in a similar format, along with any comments they have.
- Conduct telephone interviews and surveys. After carefully reviewing the other locations’ data, call your contacts and discuss the data you received from them to clarify key activities. In complex studies, a written survey should be used instead of a telephone interview because it allows the individual to acquire exact data and to document the response.
- Conduct location visits. The benchmarking team or corporate benchmarking committee should conduct a detailed tour of the process being benchmarked. Each member should then write process review reports defining strengths and weaknesses observed.
- Analyze the data. Construct a process flow diagram including the best processes and practices from all locations. Then estimate the expected performance if the optimum process is implemented.
- Establish a process-change plan. Based on the process diagram developed in step 10, the team or committee should conduct a change-impact analysis to prioritize the implementation activities. In some cases, organizations may decide not to make any process changes. The decision to implement the change now or later will depend on the projected gains resulting from the change.
- Implement one change at a time. Implement the high-priority changes one at a time. By implementing one change at a time, it is easier to assess the impact of each change on the total process. It is also far less disruptive to the overall operation.
- Measure changes. Develop a system that measures the impact of each change on the total process. Many changes can have both positive and negative effects. Any measurement system should evaluate the impact of a change on effectiveness and efficiency as it relates to the total process.
- Report on an ongoing basis. Establish a measurement report comparing performance by location. Issue this report every six months.
External Benchmarking
External benchmarking applies the benchmarking approach to comparable organizations outside your own. External benchmarking may be conducted with competitors or with world-class noncompetitors.
External benchmarking is divided into 3 sub-classifications. They are competitive, world-class operations, and activity-type benchmarking. For most processes, both internal and external benchmarking are used.
- External competitive benchmarking, also known as reverse engineering, is a form of external benchmarking that requires investigating a competitor’s products, services, and processes. The most common way to do this is to purchase competitive products and services and analyze them to identify competitive advantages.
- External world-class operations benchmarking is a form of external benchmarking that extends the benchmarking approach outside the organization’s direct competition to involve dissimilar industries. Many business processes are generic in nature and application (e.g., warehousing, supplier relations, service parts logistics, advertising, customer relations, employee hiring) and can provide meaningful insights despite the fact that they are being used in an unrelated industry. Benchmarking dissimilar industries enables you to discover innovative processes not currently used in your particular product types that will allow your processes to become best in class. It is usually advisable to establish some criteria when selecting organizations to be benchmarked. Some of these criteria might include:
- Requirements of the external organization’s customers: High quality and high reliability or low quality and one-time usage.
- The characteristics of the external organization’s product: Size, shape, weight, environment, etc.
- Type of industry: Grocery industry, office products industry, electronics industry, transportation industry, etc. In this case, consider broad industrial categories, not the specific products.
- After the external organization is selected, the benchmarking approach can be applied to a product, a process, or even an individual activity.
The 14 Steps for External Benchmarking
There are 14 basic steps in an external benchmarking effort; the first 5 steps are the same as for internal benchmarking.
- Identify what to benchmark. Identify the products, processes, and/or activities that should be benchmarked. Plan to develop a database of benchmarking information.
- Obtain management support. Obtain management support for the benchmark activities. This support must include project approval and approved human and financial resources. It may be beneficial to form a corporate benchmark committee, both to build a base of support and to review the data after they are collected.
- Develop benchmark measurements. Benchmark measurements use both qualitative and quantitative data.
- Determine how to collect data. Four commonly used data collection methods are:
- Exchange of process data, procedures, and flowcharts
- Telephone interviews and surveys
- Joint committees
- Site visits
In most cases, all four will be used.
- Review plans with location experts. Search out people who understand the process being evaluated and ask them to:
- Review the data plan
- Recommend other locations that are doing the same or similar activities well
- Suggest contacts for information
- Develop a preliminary list of the best external organizations. Using information generated by internal benchmarking efforts or by direction of the corporate benchmarking committee, list organizations with a world-class reputation. (This preliminary list will later be refined.)
- Develop a data collection plan. There are many ways to collect information on external organizations. Some of the most common are:
- Searches of literature
- Use of information developed by professional and trade associations
- Use of external experts
A great deal of data about the competition, and about world-class organizations in general, exists in the public domain. Devote the time and effort necessary to collect these data. The more you know about an organization before contacting it, the more likely you are to gain real insights into its processes.
- Make a final selection of benchmark organizations. Review the data you have collected to date and update your database. Identify any voids in the collected data. After a detailed analysis of these data, pinpoint the organizations to target for benchmarking and identify key contacts there.
At this point, you should have reduced your potential benchmark organizations to between three and five. Some organizations that looked good at first may have to be dropped from the list because of:
- Unwillingness to share data
- Lack of data
- Existence of better candidates
- Reputation as not the best performer
- Processes not comparable to yours
- Communications problems
- Travel costs
- Gather data. There are a number of ways to collect data from external benchmark organizations. Among these are:
- Anonymous surveys administered by a third party
- Focus groups organized and facilitated by a third party
- Site visits
It is generally a good idea to conduct surveys before site visits. When conducting site visits, limit the visit team to two to eight people and identify the role of each in advance. Immediately after the visit (during the same day, if possible) hold a meeting of the team to consolidate thinking and to record observations.
- Establish and update the benchmark database. The previous activities generate vast amounts of data that must be captured and analyzed. The best way to do this is to constantly update the benchmark database as each activity is performed.
- Analyze the data. Two types of data are collected and used in the benchmarking approach. The first type is qualitative data (word descriptions) and the second is quantitative data (numbers, ratios, etc.). For quantitative data, design a data matrix that highlights the parts of the process requiring additional data and study. Some effective ways to present and analyze qualitative data are:
- Word charts
- Written step-by-step procedures
- Flowcharts
- Establish a process-change plan. Conduct a change-impact analysis to prioritize the implementation activities. In some cases, organizations may decide not to make any process changes. The decision to implement a change now or later will depend on the projected gains resulting from the change.
- Implement one change at a time. Implement the high-priority changes one at a time. If you implement one change at a time, it is easier to assess the impact of each change on the total process. It is also far less disruptive to the overall operation.
- Measure changes. Develop a system to measure the impact of each change on the total process. Many changes can have both positive and negative effects. The measurement system should evaluate the total impact of the change on the effectiveness and efficiency of the process as a whole.
Guidelines and Tips
Use the Encyclopedia of Trade Associations to develop an initial list of target trade and professional associations.
- Qualify each potential association for:
- Its membership
- The types of conferences offered
- Prominent industry figures who are members
- Periodicals or journals published
- Develop a final list of leading associations in the industry or field.
- Contact the representatives of each association.
- Make sure you fully understand the product, process, or activity to be benchmarked before attempting to generate data.
- Make a concerted effort to establish a broad base of organizational support for the benchmarking effort. This is part of the change process and is essential to using the data.
- When conducting competitive benchmarking, be careful not to expose yourself to risk by engaging in practices that could be considered illegal or unethical. Wherever possible, use information about competitors from the public domain.
What Are the Primary Reasons for Using Process Benchmarking?
The two primary reasons for using process benchmarking are goal setting and process development. Every person, process, and organization needs goals to strive for. Without them, life is unrewarding, and we drift on a sea of confusion. We all want to improve. No one likes to be average. In the past, goals usually were based on the organization’s and/or the process’s past performance. There was little correlation between our goals and the ultimate standard of excellence. Occasionally, our goals exceeded what is achievable, but more commonly they fell far below what had been, or could be, achieved. As a result of setting low goals for ourselves, we enjoyed a false sense of accomplishment. We stopped trying to improve because we so easily met the low standards we set for ourselves. This prevented many individuals, processes, and organizations from maturing to their full potential. Because it provides a means for setting challenging targets and attainable goals, benchmarking is the antidote to this self-imposed mediocrity.
Even more important, process benchmarking provides a way to discover and understand methods that can be applied to your process to effect major improvements. This is the unique value of process benchmarking; it not only tells you how good you need to and can be, but it also tells you how to change your process to get there.
When setting up your measurement system for process benchmarking, you need to plan for two things—the what and the how. Both of these functions are important. What good is knowing how good world class is if you do not know how to improve your process to obtain it? Knowing that you are bad, but not being able to improve it, just discourages everyone. Similarly, what good is a new process idea if you do not know whether it will have a positive impact on your process? You need to design your process benchmarking to provide both the what and the how.
The What
Measurements are absolutely crucial. If you cannot measure, you cannot control. If you cannot control, you cannot manage. It’s as simple as that. Quantitative data are absolutely essential ingredients in becoming and staying world class.
As critical as measurements are, it would seem that everyone would know just what needs to be measured. Unfortunately, this is not the case. In fact, in most instances it is just the opposite, and this is particularly true when you talk about business processes. Process benchmarking should measure things such as:
- How much
- How fast
- How good
- When
- Where
- How long
- Size, shape, form, and fit
Although most product-type measurements are physical in nature, most process measurements are effort, cost, and time related. Consequently, it often is best to establish ratio measurements (e.g., return on investments, returns per year, unit costs, productivity rates) rather than actual values. The use of ratios allows data exchange without disclosing absolute values or production rates. This encourages free exchange of information between organizations.
The How
Another real advantage of process benchmarking is that it provides you with insights into how others have become the best. This aspect focuses on discovering how world-class organizations developed their processes and systems to ensure superior performance. At this juncture, we seek and analyze the how-to, the knowledge, the ways, the processes, and the methods responsible for making an organization, a process, or an activity the best of its kind. We then apply this knowledge to our process, adapting it to meet the unique requirements of our products, employees, customers, and organization’s personality.
The Five Phases of Internal and External Combined Benchmarking Process
- Phase I: Planning the benchmarking process and characterization of the item(s)
- Phase II: Internal data collection and analysis
- Phase III: External data collection and analysis
- Phase IV: Improvement of the item’s performance
- Phase V: Continuous improvement
These benchmarking phases comprise a total of 20 activities. (See Table 7.1.) Each activity is sub-divided into a number of specific tasks.
The 5 Phases and 20 Activities of the Internal and External Combined Benchmarking Process
| Benchmarking Phase | Related Activities |
|---|---|
| Phase I: Planning the benchmarking process and characterization of the item(s) | Identify what to benchmark Obtain top management support Develop the measurement plan Develop the data collection plan Review the plans with location experts Characterize the benchmark item |
| Phase II: Internal data collection and analysis |
Collect and analyze internal published information Select potential internal benchmarking sites Collect internal original research information Conduct interviews and surveys Form an internal benchmarking committee Conduct internal site visits |
| Phase III: External data collection and analysis |
Collect external published information Collect external original research information |
| Phase IV: Improvement of the item’s performance |
Identify corrective actions Develop an implementation plan Gain top management approval of the future state solution Implement the future state solution and measure its impact |
| Phase V: Continuous improvement |
Maintain the benchmarking database Implement continuous performance improvement |
Examples
See Figures 7.2 to 7.5.
Additional Reading
American Productivity and Quality Center. The Benchmarking Management (Portland, OR: Productivity Press, 1993).
Bendell, Tony, Louise Boulter, and John Kelly. Benchmarking for Competitive Advantage (New York: McGraw-Hill, 1993).
Camp, Robert C. Business Process Benchmarking: Finding and Implementing Best Practices (Milwaukee, WI: ASQ Quality Press, 1995).
Harrington, H. James. The Complete Benchmarking Implementation Guide (New York: McGraw-Hill, 1996).
Harrington, H. James, and James S. Harrington. High Performance Benchmarking (New York: McGraw-Hill, 1996).
International Benchmarking Clearinghouse. Planning, Organizing, and Managing Benchmarking Activities: A User’s Guide (Houston, TX: 1992).
Xerox Quality Solutions. Benchmarking for Process Improvement (Rochester, NY: Xerox Quality Solutions, 1994).

Compensation and benefits per employee.

Process benchmarking.
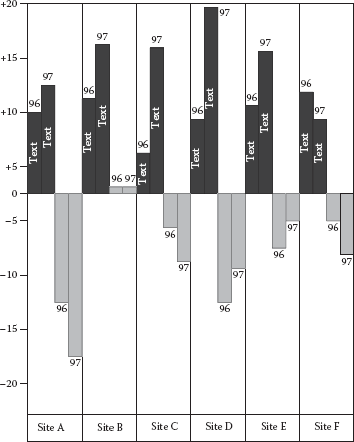
Changes in two measurements over 2 years for six sites.
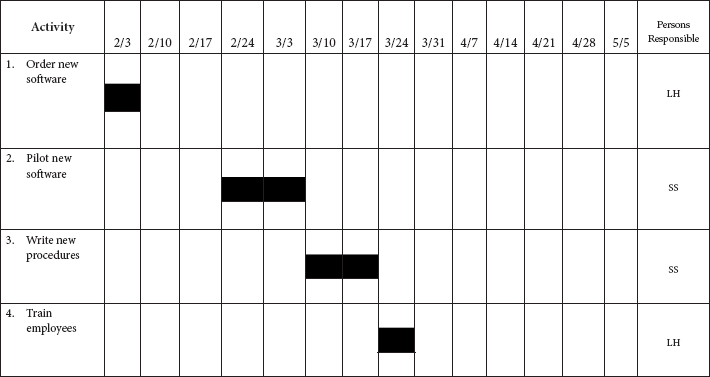

Implementation of the Gantt chart.
Finance Job Profile
| A | B | C | D | F | G | H | I | Avg. | ||
|---|---|---|---|---|---|---|---|---|---|---|
| Vice president | 3% | 2% | 1% | 2% | 1% | 1% | 2% | 1% | 2% | |
| Director | 3% | 5% | 3% | 3% | 6% | 4% | 5% | 58% | 4% | |
| Senior manager | 7% | 18% | 7% | 2% | 8% | 5% | 1% | 8% | 7% | |
| Manager/supervisor | 14% | 9% | 18% | 25% | 18% | 10% | 17% | 13% | 15% | |
| Subtotal: Managers |
27% | 34% | 29% | 32% | 33% | 20% | 25% | 27% | 28% | |
| Financial analyst | 11% | 40% | 33% | 29% | 27% | 38% | 6% | 28% | 27% | |
| Accountant | 36% | 21% | 19% | 23% | 23% | 12% | 38% | 28% | 25% | |
| Clerical | 26% | 5% | 19% | 16% | 17% | 30% | 31% | 17% | 20% | |
| Subtotal: Nonmanagers |
73% | 66% | 71% | 68% | 67% | 80% | 75% | 73% | 72% | |
| Total | 100% | 100% | 100% | 100% | 100% | 100% | 100% | 100% | 100% | |
Note: Company E omitted due to incomplete data.
Common Areas of Focus
| A | B | C | D | E | F | G | H | I | J | |
|---|---|---|---|---|---|---|---|---|---|---|
| Systems improvement | X | X | X | X | X | X | X | X | X | X |
| Overall efficiency | X | X | X | X | X | X | X | |||
| Financial close/reporting | X | X | X | X | X | X | X | |||
| Budget and forecast | X | X | X | X | ||||||
| Revenue and A/R | X | X | X | X | X | |||||
| General ledger | X | X | X | |||||||
| Cost accounting | X | X | X | X | X | |||||
| Asset/cash management | X | X | X | |||||||
| EDI | X | X | X | |||||||
| Purchasing and A/P | X | |||||||||
| Organization structure | X | |||||||||
| Business model | X | X | X | X |
Number of Domestic Systems by Function
| A | B | C | D | E | F | G | H | I | J | Avg. | |
|---|---|---|---|---|---|---|---|---|---|---|---|
| General ledger | 1 | 1 | 3 | 2 | 1 | 1 | 1 | 2 | 4 | 2 | 1.8 |
| Accounts receivable | 1 | 1 | 3 | 2 | 1 | 3 | 1 | 2 | 1 | 1 | 1.6 |
| Accounts payable | 1 | 1 | 3 | 2 | 1 | 1 | 1 | 2 | 3 | 2 | 1.7 |
| Fixed assets | 1 | 1 | 3 | 2 | 1 | 1 | 1 | 2 | 3 | 2 | 1.7 |
| Cost accounting | 1 | 1 | 1 | 2 | 1 | 4 | 1 | 1 | 1 | 3 | 1.6 |
| Purchasing | 1 | 1 | 3 | 1 | 2 | 2 | 1 | 2 | 3 | 1 | 1.7 |
| Order entry | 1 | 1 | 3 | 2 | 1 | 3 | 1 | 2 | 6 | 1 | 2.1 |
| Financial reporting if different than G/L |
1 | 2 | 1 | 2 | 1 | 1 | 0 | 2 | 3 | 1 | 1.4 |
Measurement Interaction Chart
| Corrective Actions | Measurements | |||||||
|---|---|---|---|---|---|---|---|---|
| 1 | 2 | 3 | 4 | 5 | 6 | 7 | 8 | |
| A | 0 | + | 0 | 0 | + | – | + | 0 |
| B | + | 0 | 0 | 0 | 0 | 0 | 0 | 0 |
| C | + | – | + | 0 | + | 0 | 0 | – |
| D | – | 0 | 0 | + | 0 | – | 0 | + |
| E | 0 | 0 | 0 | – | 0 | + | + | 0 |
| F | 0 | + | + | – | 0 | + | + | 0 |
| G | 0 | 0 | 0 | + | + | 0 | 0 | 0 |
Improvement Analysis Chart for Future State Solution 3
| Measurement | Improvement | Original Value |
New Value |
|||||
|---|---|---|---|---|---|---|---|---|
| 1 | 2 | 3 | 4 | 5 | 6 | |||
| Cycle time (days) | ||||||||
| –9.0 | –0.5 | –3.0 | –10.0 | +5.0 | 0 | 35.0 | 17.5 | |
| Processing time (hours) | ||||||||
| –1.0 | –4.0 | –1.1 | 0 | +3.1 | 0 | 10.0 | 7.5 | |
| Error rate (errors/1,000) | 0 | 0 | 0 | 0 | –5 | –2 | 8.0 | |
| 3.0 | ||||||||
Implementation Cost Analysis Chart for Future State Solution 3 (Cost in $1,000)
| Improvement | ||||||||
|---|---|---|---|---|---|---|---|---|
| Cost Categories | 1 | 2 | 3 | 4 | 5 | 6 | OCM | Total Cost |
| Implementation team | 10 | 20 | 0.5 | 60 | 10 | 0.5 | 3.5 | 9,405 |
| Target group | 3 | 0 | 4 | 10 | 0 | 4.0 | 21.0 | |
| Consulting | 0 | 0 | 0 | 100 | 0 | 0 | 50.0 | 150.0 |
| Equipment | 0 | 0 | 0 | 100 | 0 | 0 | 0 | 100.0 |
| Software | 10 | 0 | 0 | 50 | 0 | 0 | 0 | 60.0 |
| Total | 23.0 | 20.0 | 54.5 | 320 | 10.0 | 0.5 | 57.5 | 523.5 |
Risk Analysis Chart for Future State Solution 3
| Improvement No. | Risk Percentage |
Reason |
|---|---|---|
| 1 | 20% | Too little data to verify the effectiveness of the improvement |
| 2 | 5% | High workload in area |
| 3 | 0% | — |
| 4 | 20% | New computer and software that we have not used |
| 5 | 10% | No sustaining sponsor |
| 6 | 20% | Could be a cost overrun |
| Total | 12% | Corrective action plan did not eliminate all the risks |
Benefits-Cost-Risk Analysis Chart for Three Alternative Future State Solutions
| Original Process |
Future State Solutions | |||
|---|---|---|---|---|
| Measurements | 1 | 2 | 3 | |
| Cycle time (days) | 35.0 | 16.2 | 19.5 | 17.5 |
| Processing time (years) | 10.0 | 6.5 | 8.3 | 7.5 |
| Errors/1,000 | 25.1 | 12.3 | 9.2 | 3.0 |
| Cost/cycle | $950 | $631 | $789 | $712 |
| Service response time (hours) | 120 | 65 | 80 | 75 |
| Implementation | ||||
| Cost in $1,000 | $1,000 | $100 | $423.5 | |
| Cycle time (months) | 29 | 6 | 16 | |
| Risk | 35% | 10% | 20% | |
| Workforce restructuring index | 65% | 5% | 45% | |
BUREAUCRACY ELIMINATION METHODS

Just the Facts
The word streamlining suggests the ultimate search for efficiency and effectiveness, an absence of fat and excess baggage, the smooth flow and unrestricted directness of effort and motion. Streamlining implies symmetry, harmony of elements, and beauty of design. Bureaucracy, on the other hand, means the opposite. It is a major stumbling block to the organized, systemic, organization-wide implementation of business process improvement concepts and methods. Bureaucracy is everywhere, even when we don’t recognize it. We must learn to actively search for and recognize it. Then, we need to eliminate it.
The Big B (bureaucracy) stands for bad, boring, burdensome, and brutal. We often think of bureaucracy as departments with layers of officials striving to advance themselves and their departments by creating useless tasks and rigid, incomprehensible rules. We think of long delays in processing as documents go through multiple channels and levels of review, requiring multiple signatures by people who are never available when needed. Their existence seems to add resistance to progress, adding cost but little real value.
Bureaucracy often creates excessive paperwork in the office. Managers typically spend 40 to 50% of their time writing and reading job-related materials; 60% of all clerical work is spent on checking, filing, and retrieving information, while only 40% is spent on process value-added tasks. This bureaucracy results from organizational or individual personalities caused by such psychological factors as:
- Paranoia about being blamed for errors
- Poor training
- Distrust of anyone
- Lack of work
- Inability to delegate
- Lack of self-worth
- Thrill of checking for and finding minuscule mistakes
- Need to overcontrol
- Unwillingness to share information
The sinister effects of bureaucracy are innumerable and profoundly damaging to every organization and to the business process improvement effort. Therefore, you should evaluate and minimize all delays, red tape, documentation, reviews, and approvals. If they are not truly necessary, you should eliminate them. A word of caution: Sometimes an activity may not have an obvious purpose but is, in fact, valuable to some other process in the organization, so don’t eliminate a bureaucratic operation without first understanding why it is in existence and what impact eliminating it would have on the organization.
Management must lead an attack against the bureaucracy that has crept into the systems controlling the business. Bureaucracy in government and business continues to worsen. These huge paperwork empires must be destroyed if industry is to flourish. Our copiers are used far too much, and we have too many file cabinets. More than 90% of the documents we retain are never used again.
The attack on bureaucracy should start with a directive informing management and employees that the organization will not put up with unnecessary bureaucracy, that each approval signature and each review activity will have to be financially justified, that reducing total cycle time is a key business objective, and that any bureaucracy activity that delays the process will be targeted for elimination.
There are two approaches to bureaucracy elimination:
- Process focused
- Incident focused
Process-Focused Approach
The process focus starts by flowcharting a process and then analyzing each step (activity) in the process to see if it is a bureaucracy-type step. You can identify bureaucracy by asking such key questions as:
- Are there unnecessary checks and balances?
- Does the activity inspect or approve someone else’s work?
- Does it require more than one signature?
- Are multiple copies required?
- Are copies stored for no apparent reason?
- Are copies sent to people who do not need the information?
- Are there people or agencies involved that impede the effectiveness and efficiency of the process?
- Is there unnecessary written correspondence?
- Do existing organizational procedures regularly impede the efficient, effective, and timely performance of duties?
- Is someone approving something he or she has already approved? (for example, approving capital equipment that was already approved during the budget cycle)
The team needs to ask questions about each process step and then carefully consider the responses in order to gain insights that will help streamline the process. Many activities do not contribute to the content of the process output. They exist primarily for protection or informational purposes, and every effort should be made to minimize these activities.
The team is apt to run into resistance related to the bureaucracy elimination activities because of varying opinions and organizational politics. Overcoming resistance to eliminating bureaucracy takes skill, tact, and considerable planning. Bureaucracy’s impact on cost and cycle time should be calculated; its impact on the internal and external customer should be understood. Once the full impact of bureaucracy is understood by all concerned, it is often difficult to justify retaining the activity. The entire organization should continually eliminate every example of bureaucracy.
After completing the flow diagram, the team should review it, using a light blue highlighter to designate all activities related to review, approval, second signature, or inspection. The team will soon learn to associate blue on the flowchart with bureaucracy. These blue activities become key targets for elimination.
The managers responsible for each of the Big B activities should justify activity-related costs and delays. Often, a manager will try to push the matter aside, saying, “It only takes me 2 or 3 seconds to sign the document. That doesn’t cost the organization anything.” The answer to a remark like this is, “Well, if you don’t read the document, there is no reason to sign it.”
In one organization that started a Big B elimination campaign, a group of 10 capital equipment requests were processed through five levels of management approval signatures. Two requests contained only a legitimate cover sheet with blank pages attached instead of the written justification required. And these two requests made it through all five levels of approval. This experiment shocked management into fully backing the Big B elimination campaign.
The justification for retaining a Big B activity requires some data. How many items are rejected? How much does the organization save when an item is rejected? Rejecting an item does not necessarily mean savings for the organization—quite the contrary. A rejected document may cause more bureaucracy, more delay, and increased costs. Time cycle delay costs are based on the advantage to the customer if the output from the process is delivered early. The justification for each Big B activity should be based on the potential loss or gain to the organization. If it is a break-even point, the activity always should be eliminated. Many organizations require a 3:1 return on any investment (ROI). This rule should apply to bureaucracy activities also. A bureaucracy step should be left in only if there is a sizable, documented savings from the activity. Even then, the team should look at why the bureaucracy activity is saving money and see if there is any other, less expensive way of accomplishing the same result.
Incident-Focused Approach
With the individual incident-focused approach, the organization sets up a Big B Elimination Team that spearheads the bureaucracy elimination project. All employees in the organization are encouraged to request the Big B Elimination Team to investigate activities that are perceived to be bureaucratic. The Big B Elimination Team investigates each suggestion to determine if the activity should be eliminated or decreased. In conjunction with the person performing the activity under evaluation, a cost-benefit analysis is performed. Bureaucratic activities that do not have a 3:1 ROI are eliminated. This approach has the advantage of getting the total organization involved in the bureaucracy elimination process.
Examples
Example 1
The cost of Big B activities is more than we realize. Reading and approving a purchase order may cost the controller only 1 minute of time, but the process design to obtain that signature costs much more. Let’s look a little closer. (See Figure 7.6.)
In this example, the controller needs to justify delaying the purchase order an additional 2 days and increasing its cost by $26.00. The 2-day delay costs the organization 2 days of production savings that the new equipment would have realized if it came on-line 2 days earlier. This can amount to hundreds of dollars of added cost. The real losses caused by Big B activities are always much more than we originally estimate.
Example 2
IBM, Brazil, launched a Big B campaign that eliminated 50 unnecessary procedures, 450 forms, and 2.5 million documents a year.

Example of cost of Big B activities.
Example 3
To purchase a ballpoint pen (or anything else, for that matter) at Intel took 95 administrative steps and 12 pieces of paper. When the company eliminated the bureaucracy, the purchase took eight administrative steps and one form. Intel estimated its attack on Big B improved productivity by 30% and saved $60 million a year. It would take the equivalent of $277 million in increased sales for Intel to generate $60 million in profits.
IBM, San Jose, California, set up a bureaucracy elimination committee. Anyone that felt that a specific bureaucracy activity was unjustified was asked to bring it to this committee’s attention. The committee would then investigate it to define if it could be eliminated.
Additional Reading
Harrington, H. James. Business Process Improvement (New York: McGraw-Hill, 1991).
Harrington, H. James, and James S. Harrington. Total Improvement Management (New York: McGraw-Hill, 1995).
CONFLICT RESOLUTION

Just the Facts
Conflict resolution in the Western culture involves communication between the parties and solving the problems by seeking a win-win position.
Example
The tools used for conflict resolution depend on the nature of the dispute, the individuals involved, and the individuals or companies affected by the dispute. Conflict resolution starts with identifying the problem from both sides (points of view). From here it is important to understand what constitutes resolution by all parties. Then it involves communicating with the individuals in order to find common ground.
The appropriate tool to use will depend on all of these factors. A simple model was proposed by Stephen Covey in his book The Seven Habits of Highly Effective People. They are:
- Be proactive: Do something.
- Begin with the end in mind: What constitutes resolution?
- Put first things first: Identify points of agreement and conflict.
- Think win-win: Seek resolutions that will allow a win-win outcome.
- Seek first to understand, then to be understood: Don’t jump at the first resolution.
- Synergize: Seek ground where all parties are working together.
- Sharpen the saw. Exercise for physical renewal.
Additional Reading
Covey, Stephen R. The Seven Habits of Highly Effective People (New York: Simon and Schuster, 1989).
Johnson, Richard Arvid. Management, Systems, and Society: An Introduction (Pacific Palisades, CA: Goodyear, 1976), pp. 142–148.
Knowles, Henry P., and Börje O. Saxberg. Personality and Leadership Behavior (Reading, MA: Addison-Wesley, 1971), chap. 8.
Picard, Daniel (ed.). The Black Belt Memory Jogger (GOAL/QPC and Six Sigma Academy, 2002).
Wortman, Bill. The Certified Six Sigma Black Belt Primer (Quality Council of Indiana, 2001).
CRITICAL TO QUALITY
Just the Facts
Often a radar chart is used to identify critical to quality parameters/characteristics related to the item being evaluated. The importance to satisfying the customers’ requirements is rated on a scale of 1 to 10 for each of the legs of the radar chart. By connecting the points, you can readily see which parameters are critical to satisfying the customer. In the example (Figure 7.7), you can see that two items would be classified as critical to quality: timely and defect/error-free. The other items, although important to your customer, are not critical.
Critical to Quality (CTQ) Characteristics
A tree diagram is another approach used to define customer CTQs to determine process performance in relationship to voice of the customer (VOC)/voice of the business (VOB). (See Figure 7.8.)
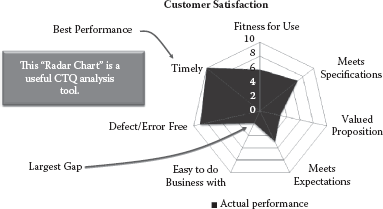
Customer satisfaction drivers versus actual performance.
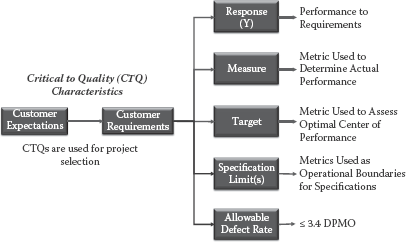
Customer requirements drive critical to quality metrics.
Example
After identifying the CTQ parameters, evaluate the product or service against the CTQs to ensure that they are met.
Additional Reading
Picard, Daniel (ed.). The Black Belt Memory Jogger (GOAL/QPC and Six Sigma Academy, Salem, NH, 2002).
Wortman, Bill. The Certified Six Sigma Black Belt Primer (Quality Council of Indiana, West
Terre Haute, 2001).
CYCLE TIME ANALYSIS AND REDUCTION
Just the Facts
Based upon the International Quality Study conducted by Ernst & Young LLP and the American Quality Foundation, there are only six worldwide best practices:
- Top management involvement
- Strategic planning
- Supplier certification
- Process simplification
- Process value analysis
- Cycle time analysis
Time is money. Every time anything is not moving forward, it costs you money. To date, most of our focus has been on reducing processing time because we see it as added labor cost. But cycle time is also very important. Reducing time-to-market, time to respond to a customer request, and time to collect an outstanding bill can mean the difference between success and failure.
Critical business processes should follow the rule of thumb that time is money. Undoubtedly, process time uses valuable resources. Long cycle times prevent product delivery to our customers and increase storage costs. A big advantage Japanese auto companies have over American companies is their ability to bring a new design to the market in half the time and cost. Every product has a market window. Missing the early part of the product window has a major impact on the business. Not only does the company lose a lot of sales opportunities, but it is facing an uphill battle against an already established competitor. With the importance of meeting product windows, you would think that development schedules would always be met. Actually, few development projects adhere to their original schedule.
Applications of Cycle Time Analysis and Reduction
The object of this activity is to reduce cycle time. This is accomplished by focusing the Process Improvement Team’s attention on activities with long time cycles and those activities that slow down the process. The timeline flowchart provides valuable assistance in identifying the problem activities. The team should look at the present process to determine why schedules and commitments are missed, then reestablish priorities to eliminate these slippages, and then look for ways to reduce the total cycle time. Typical ways to reduce cycle time are:
- Do activities in parallel rather than serially. Often, activities that were done serially can be done in parallel, reducing the cycle time by as much as 80%. Engineering change review is a good example. In the old process, the change folder went to manufacturing engineering, then to manufacturing, then to field services, then to purchasing, and finally, to quality assurance for review and sign-off. It took an average of 2 days to do the review in each area and 1 additional day to transport the document to the next reviewer. The engineering change cycle took 15 working days, or 3 weeks, to complete. If any of the reviewers had a question that resulted in a change to the document, the process was repeated. By using computer-aided design (CAD), all parties can review the document simultaneously and eliminate the transportation time. This parallel review reduces the cycle time to 2 days.
Another less equipment-intensive approach would be to hold weekly change meetings. This would reduce the average time cycle to 3.5 days and eliminate most of the recycling, because the questions would be resolved during the meeting.
- Change activity sequence. The geographic flowchart is a big help to this activity. Often, output moves to one building and then returns to the original building. Documents move back and forth between departments within the same building. In this stage, the sequence of activities is examined to determine whether a change would reduce cycle time. Is it possible to get all the signatures from the same building before the document is moved to another location? When a document is put on hold waiting for additional data, is there anyone else who could be using the document, thereby saving cycle time later on?
- Reduce interruption. The critical business process activities should get priority. Often less important interruptions delay them. People working on critical business processes should not be located in high traffic areas, such as near the coffee machine. Someone else should answer their phones. The office layout should allow them to leave their work out during breaks, lunch, or at day’s end. The employee and the manager should agree on a time when the employee will work uninterrupted, and the manager should help keep these hours sacred.
- Improve timing. Analyze how the output is used to see how cycle time can be reduced. If the mail pickup is at 10:00 a.m., all outgoing mail should be processed before 9:45 a.m. If the computer processes a weekly report at 10:00 p.m. on Thursday, be sure that all Thursday first-shift data are input by 8:00 p.m. If you miss the report analysis window, you may have to wait 7 more days before you receive an accurate report. If a manager reads mail after work, be sure that all of that day’s mail is in his or her incoming box by 4:30 p.m. It will save 24 hours in the total cycle time. Proper timing can save many days in total cycle time.
- Reduce output movement. Are the files close to the accountants? Does the secretary have to get up to put a letter in the mailbox? Are employees who work together located together? For example, are the quality, development, and manufacturing engineers located side by side when they are working on the same project, or are they located close to other people in the same discipline?
- Analyze locations. Is the process being performed in the right building, city, state, or even the right country? Where the activity is performed physically can have a major impact on many factors. Among them are:
- Cycle time
- Labor cost
- Customer relations
- Government controls and regulations
- Transportation cost
- Employee skill levels
Performing the activity in less than the optimum location can cause problems, from a minor inconvenience all the way to losing customers and valuable employees. The approach and consideration for selecting the optimum location vary greatly from process to process. As a general rule, the closer the process is located to the customer, the better. The restraints to having the process and its customer in close proximity are economy of scale, stocking costs, equipment costs, and utilization considerations. With today’s advances in communication and computer systems, the trend is to go to many smaller locations located either close to the supplier or close to the customers. Even the large manufacturing specialty departments (machine shop, welding department, tool room, etc.) are being separated into small work cells that are organized to fit a process in which a lot size of one is the production plan. Often, the advantages of quick response to customer requests, increased turns per year, and decreased inventories far offset the decreased utilization costs.
Questions like “Should we have a centralized service department or many remote ones?” require very careful analysis. A graphic flowchart helps make these decisions, but the final decision must be based on a detailed understanding of customer expectations, customer impact, and cost comparisons between the options.
- Set priorities. Management must set proper priorities, communicate them to employees, and then follow up to ensure that these priorities are lived up to. It is often a big temptation to first complete the simple little jobs—the ones that a friend wants worked on, the ones someone called about—and let the important ones slip. It’s the old “squeaky wheel” message. As a result, projects slip, money is lost, and other activities are delayed. Set priorities and live by them.
Cycle Time Analysis and Reduction Process
The cycle time reduction process consists of 16 activities:
- Flowchart the process that is being studied.
- Conduct a process walk-through to understand the process and verify the flowchart.
- Collect cycle time data related to each activity and task. It is often advisable to collect minimum and maximum cycle times in addition to average. This is necessary because, typically, an organization loses customers not over averages but over worst-case conditions.
- Collect data that define the quantity flow through each leg of the flow diagram.
- Construct a simulation model that includes all of the data that have been collected.
- Perform a Monte-Carlo analysis using the simulation model to define the cycle time frequency distribution.
- Classify each activity or task as real-value-added, business-value-added, or no-value-added. Eliminate as many of the business-value-added and no-value-added activities as possible.
- Define the average cycle time’s critical path through the process using the simulation model.
- Using the cycle time reduction principles, eliminate the critical path.
- Repeat activities 8 and 9 until the minimum cycle time is obtained.
- Define the worst-case critical path through the process using the simulation model.
- Using the cycle time reduction principles, eliminate the critical path.
- Repeat steps 11 and 12 until the minimum worst-case cycle time is obtained.
- Develop a plan to change the process to be in line with the modified simulation model.
- Pilot the modifications as appropriate.
- Implement the new process.
Examples
IBM’s RPQ or special bit process provides modifications to computers so that they can meet an individual customer’s unique needs. Typically, the cycle time to take a customer special requirement and design and price out the modification was taking an average of 90 days. The business was very profitable, as 20% of the bids were closed. IBM decided that 90 days was too long and a team was put together to reduce the cycle time. As a result, 24 months later, any place in the world, it took an average of 15 days to complete a special bid process.
In addition, the cost related to preparing the bid was decreased by 30%, but that was not the big payoff. Along with the quick response to customer requests, the bit closure rate jumped from 20% to 65%—a 325% improvement. Customers love companies who respond quickly to their special requests.
Additional Reading
Harrington, H. James. Business Process Improvement (New York: McGraw-Hill, 1991).
Harrington, H. James, and James S. Harrington. Total Improvement Management (New York: McGraw-Hill, 1995).
Harrington, H. James, Glen Hoffherr, and Robert Reid. Area Activity Analysis (New York: McGraw-Hill, 1998).
Northey, Patrick, and Nigel Southway. Cycle Time Management (Portland, OR: Productivity Press, 1993).
FAST-ACTION SOLUTION TECHNIQUE (FAST)
Just the Facts
Fast-action solution technique (FAST) is based on an improvement tool first used by International Business Machines (IBM) Corporation in the mid-1980s. General Electric refined this approach in the 1990s and called it “workout.” Ford Motor Company further developed it under the title “RAPID.” Today, Cap Gemini Ernst & Young extensively uses this approach (which they call “EXPRESS”) with many clients around the world (Figure 7.9). It is also often used by other organizations throughout the Americas.

View of Cap Gemini Ernst & Young’s EXPRESS process.
FAST can be applied to any process level, from a major process down to and including the activity level. The FAST approach to business process improvement (BPI) centers around a single 1- or 2-day meeting that identifies root causes of problems and/or no-value-added activities designed into a present process. Typical improvement results from the FAST approach are reduced cost, cycle time, and error rates between 5 and 15% in a 3-month time period. Within 1 or 2 days, the potential improvements are identified and approved for implementation; hence the term FAST was given to this approach.
The FAST approach evolves through the following eight activities:
- A problem or process is identified as a candidate for FAST.
- A high-level sponsor agrees to support the FAST initiative related to the process that will be improved. (The process must be under the sponsor’s span of control.)
- The FAST team is assigned, and a set of objectives is prepared and approved by the sponsor.
- The FAST team meets for 1 or 2 days to develop a high-level process flowchart and to define what actions could be taken to improve the process’s performance. All recommendations must be within the span of control of the team members and able to be completely implemented within a 3-month time period. All other recommendations are submitted to the sponsor for further consideration at a later date.
- A FAST team member must agree to be responsible for implementing each recommendation that will be submitted to the sponsor.
- At the end of the 1- or 2-day meeting, the sponsor attends a meeting at which the FAST team presents its findings.
- Before the end of the meeting, the sponsor either approves or rejects the recommendations. It is very important that the sponsor not delay making decisions related to the suggestions, or the FAST approach will soon become ineffective.
- Approved solutions are implemented by the assigned FAST team member over the next 3 months.
Examples
The following are typical documentation results that Cap Gemini Ernst & Young (CGE&Y) recorded as a result of helping clients use FAST (CGE&Y’s trademark is EXPRESS).
- Problem 1: Different entities negotiating for identical software.
- Results:
− Cost savings of $240,000 the first year
− Reduced cycle time by 4 weeks
- Results:
- Problem 2: Long delays and high costs related to suppliers getting approval to change their processes.
- Results:
− Cycle time reduced by 2 weeks
− Reduced mailing and storage cost by $385,000
- Results:
- Problem 3: The quarterly financial closing cycle was too long.
- Results:
− Reduced cycle time by a day
− Accelerated accrual process by 3 days
- Results:
Additional Reading
Harrington, H. James. Business Process Improvement (New York: McGraw-Hill, 1991).
Harrington, H. James. FAST—Fast Action Solution Technique (Paton Professional Press, 2009).
Harrington, H. James, and James S. Harrington. Total Improvement Management (New York: McGraw-Hill, 1995).
FOUNDATION OF SIX SIGMA (MINIMIZING VARIATION)
Just the Facts
The Six Sigma focus is on minimizing variation, and it is represented by the formula where y is the dependent variable and f is the independent variable. (See Table 7.11.)
Input versus Output Relationship
| What Do We Watch? | What Do We Work On? |
|---|---|
| Y variable | X1 … XN variable |
| Dependent | Independent |
| Outcome | Process output |
| Effect | Cause |
| Symptom | Problem |
| Monitor | Control |
| Requirements | Performance |
What Does “Good Enough” Mean?
Is 99% good enough? Good enough isn’t any of the following:
- 10 million lost articles of mail each day
- 5,000 surgeries each day performed incorrectly
- 200,000 incorrect drug prescriptions dispensed each year
- At least two missed landings at most major airports each day
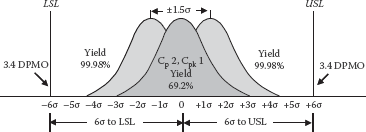
A good process is one that will repeatedly and reliably produce excellent service and products. Does it have to be perfect? Can any of us perform error-free for the rest of our lives? Would 3.4 errors for million opportunities be good enough? That is the objective of the Six Sigma methodology. (See Figures 7.10 to 7.12.)
Six Sigma is about variation reduction. It is concerned about the process variation that, when depicted on a histogram, forms its width called “common cause variation,” and the external variation called “special cause variation.”
Example
A process is yielding 50% good parts. An analysis of the data shows that the process is producing product that is out of specification for both the high and low specification limits. A further evaluation shows that 30% of the bad product is above the upper specification limits. You will reduce the failure rate from 50% to 30% by simply moving the center of the process toward the center of the specification limits. A further reduction of only 10% of the variation of the process will yield an additional 15%, thereby reducing the defect rate from 50% to 15%.
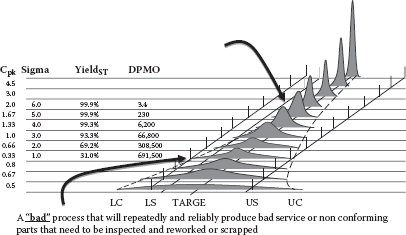
Sigma level versus defects per million opportunities.
Output drift over time.

Results of reducing process variation and centering the output.
Additional Reading
Picard, Daniel (ed.). The Black Belt Memory Jogger (GOAL/QPC and Six Sigma Academy, Salem, NH, 2002).
Wortman, Bill. The Certified Six Sigma Black Belt Primer (Quality Council of Indiana, West Terre Haute, 2001).
JUST-IN-TIME (JIT)
Just the Facts
The JIT process relies on signals between different points in the process that tell production when to make the next part. This usually takes the form of “tickets” but can be simple visual signals, such as the presence or absence of a part on a shelf.
When correctly implemented, JIT focuses on continuous improvement and can improve a manufacturing organization’s quality and efficiency.
Key areas include:
- Flow
- Employee involvement
- Quality
- Environmental concerns
- Price volatility
- Demand
- Supply availability
Example
Instead of storing empty bottles, a drink manufacturer has empty bottles delivered at regular times providing a 4-hour operating window between deliveries. This allows for the following:
- The need to move the bottles from the trailers to storage is reduced.
- Bottles are moved directly to production.
- The supplier knows the production rate required to satisfy the customer.
By producing product to customer demands, it reduces warehouse storage costs.
Having necessary parts available when needed and ordering just enough to keep the process moving with no downtime reduces the inventory of parts that must be maintained. This reduces the within-period costs and storage costs. This also facilitates suppliers in that they can provide parts at a more constant level rather than providing more parts than necessary and then having downtime.
Some of the benefits include:
- Reduced setup time
- Flow of goods from warehouse to shelves improves
- Employees with multiple skills are used more efficiently
- Production scheduling and work hour consistency synchronized with demand
- Increased emphasis on supplier relationships
- Supplies come in at regular intervals throughout the production day
Additional Reading
Hirano, Hiroyuki, and Furuya Makota. JIT Is Flow: Practice and Principles of Lean Manufacturing (Vancouver, WA: PCS Press, 2006).
Liker, Jeffrey. The Toyota Way: 14 Management Principles from the World’s Greatest Manufacturer, 1st ed. (New York: McGraw-Hill, 2003).
Management Coaching and Training Services. The Just-in-Time (JIT) Approach. 2006. Retrieved June 19, 2006, from [www.mcts.com/Just-In-Time.html].
Ohno, Taiichi. Just-in-Time for Today and Tomorrow (Productivity Press, 1988).
Wadell, William, and Norman Bodek. The Rebirth of American Industry (PCS Press, 2005).
Womack, James P., Daniel T. Jones, and Daniel Roos. The Machine That Changed the World: The Story of Lean Production (Harper Business, 1991).
MATRIX DIAGRAM/DECISION MATRIX

Just the Facts
The matrix diagram is an approach that assists in the investigation of relationships. While there are many variations of matrix diagrams, the most commonly used is the decision, or prioritization, matrix. These come in two basic formats: the L-Shaped Matrix and the T-Shaped Matrix.
L-Shaped Matrix
We will start by showing a relatively simple L-Shaped Matrix that compares two sets of information. (See Figure 7.13.)
As you can see from the example, we are comparing several automobile dealers (our choices) with a predetermined set of decision criteria. Now all that remains is to determine which type of ranking method we will use. There are four basic types of ranking methods:
- Forced choice: Each alternative is ranked in relation to the others. The alternative best meeting the criteria gets a score equal to the number of alternatives. Since we have five dealers in our example, the worst would get a 1 and the best a 5.

Example of an L-Shaped Matrix.
- Rating scale: Each alternative is rated independently against an objective standard. (For example, a 1 to 10 scale would have 1 = very low (does not meet the standard at all) and 10 = perfect (absolutely meets the standard).
- Objective data: Here we enter actual data, rather than the opinions of the individual(s) doing the ranking.
- Yes/no: If the criteria are expressed in absolute terms, so an alternative either meets the criteria or not, a Y for yes or an N for no may be entered to indicate conformance or nonconformance.
Figure 7.14 shows our automobile dealership example using the simple yes/no ranking criteria. As you can see, the easiest ranking method—the yes/no approach—often leaves the user with little information in which to make a decision. In Figure 7.14 all five dealers got three yeses.
Let’s try ranking our choices using the forced-choice method. (See Figure 7.15.) Remember, this method ranks each alternative in relation to the others. In this case the dealer meeting our criteria the best will get a 5 and the worst will get a 1 (since we have five choices).
Now we have information that might allow us to make a decision. As you can see, Dealer 4 scored the highest with 18. Does this mean you should automatically buy your car from him? Not necessarily. Although Dealer 4 did score the highest overall, he scored the lowest on “free dropoff and pickup.” If this were a critical element to the potential buyer, he or she might want to consider the second choice, Dealer 1.

Example of an L-Shaped Matrix using yes/no ranking method.

Example of an L-Shaped Matrix using the forced-choice ranking method.
This is where using the objective data method might be of assistance. The person or group doing the ranking might even consider using a combination of ranking methods. This is certainly an option, but it makes the final selection a bit more complex.
T-Shaped Matrix
The second format we mentioned was the T-Shaped Matrix. While the L-Shaped Matrix compares two sets of information, the T-Shaped Matrix compares two sets of information to a third. An example of this could be a corporation’s training program. We could compare the type of training available with departments that need the training and training providers. Figure 7.16 shows an example of the T-Shaped Matrix format.
There are many approaches to designing and developing a matrix diagram. Listed below are five steps you may find useful in developing a matrix diagram that’s just right for your purpose.
Step 1: Determine the task. Are we looking at two elements or three? What should the desired outcome look like? Is the matrix to be used a problem-solving tool or a planning graph? Is it a stand-alone tool that leads us to action, or will we use it in conjunction with other tools, such as a tree diagram or relation diagram?

Example of a T-Shaped Matrix.
Step 2: Select the matrix format. If we are reviewing the relationships of two elements, you may want to use the L-Shaped Matrix. If you add a third element, you will want to use the T-Shaped Matrix.
Step 3: Determine the criteria for evaluating alternatives. A typical list of criteria is presented below:
- Customer impact
- Number of customers affected
- Within control of the team
- Within influence of the team
- Cost of quality
- Rework
- Frequency of occurrence
- Cycle time impact
- Revenue impact
- Return on investment
- Complexity of analysis
- Time to develop a solution
- Durability of solution
- Cost to implement solution
- Availability of measurements
The criteria should be worded in terms of the ideal result, not worded neutrally. For example, a criterion could be “easy to implement,” but not “ease of implementation.”
Step 4: Determine the weights for the individual criterion or use equal weighting.
Step 5: Determine how the individual alternatives will be ranked.
- Forced choice: Each alternative is ranked in relation to the others. The alternative best meeting the criterion gets a score equal to the number of alternatives and the worst would get a 1.
- Rating scale: Each alternative is rated independently against an objective standard. For example, a 1 to 10 scale would have 1 = very low (does not meet the standard at all) and 10 = perfect (absolutely meets the standard).
- Objective data: Enter actual data, rather than the opinions of the individual(s) doing the ranking.
- Yes/no: If the criteria are expressed in absolute terms, so an alternative either meets the criterion or not, simply enter Y or N to indicate conformance or nonconformance.
Step 6: Review the results and take action as required.
Guidelines and Tips
Whenever comparing alternatives (forced-choice method or rating scale), the group must agree on the relative importance of the alternatives/criteria for scoring purposes. Relative importance can be established either through consensus discussion or through voting techniques. You will usually want to reach agreement rather quickly on this. The amount of time you spend should be based on the importance of the problem/solution and on the number of alternatives and criteria. If there are a large number of alternatives/criteria, you can reach agreement more quickly keeping in mind the impact of each individual item on the list is smaller.
Depending on the nature and impact of the problem, this process can be simplified for quicker and easier use. For example, the process can be simplified by assuming that the criteria are of equal importance, and therefore the ranking of alternatives can be skipped. You can look for other simplifying assumptions. Just be aware of their impact on results.
There is no one best way to weight criteria or alternatives. In the forced-choice method, you rate each element against the other, based on the number of choices. This is a time-consuming method, though. The rating scale method is quick, but has the drawback that people tend to rank every criterion as very important or high on the scale of 1 through 10.
Again, there is no one best method. Use the method that provides you with the most information. Before using any of the alternative approaches described here, however, think about the implications of the various schemes. If you plan to use prioritization matrices repeatedly, you might set up a simple spreadsheet to assist you with some of the calculations.
Examples
The examples are included in the text.
Additional Reading
Asaka, Tetsuichi, and Kazuo Ozeki (eds.). Handbook of Quality Tools: The Japanese Approach (Portland, OR: Productivity Press, 1998).
Eiga, T., R. Futami, H. Miyawama, and Y. Nayatani. The Seven New QC Tools: Practical Applications for Managers (New York: Quality Resources, 1994).
King, Bob. The Seven Management Tools (Methuen, MA: Goal/QPC, 1989).
Mizuno, Shigeru (ed.). Management for Quality Improvement: The 7 New QC Tools (Portland, OR: Productivity Press, 1988).
MEASUREMENTS
One measurement is worth 10 guesses.
Just the Facts
There are many tools that provide measurement data that, when analyzed properly, yield “actionable knowledge” (indicate the direction of action to be taken). Some of the key actions and tools include:
Principles of Good Measure
The following is a list of criteria to use in evaluating measurement:
- The measure must be important.
- The measure must be easy to understand.
- The measure is sensitive to the right things and insensitive to other things.
- The measure promotes appropriate analysis and action.
- Data needed must be easy to collect.
Examples
In preparing the measurement system start thinking in scientific terms:
Y = f(X1, X2, …, Xn)
- Y relates to the outputs.
- X relates to the process and inputs.
- Identify X’s that might explain variation in the output measure.
- Collect data efficiently—both the Y’s and the suspected X’s.
The focus of the measure activity is to:
- Select key output measures (Y metrics)
- Collect baseline data (X performance metrics)
- Study the variation in the output measures (X process measures)
- Understand the capability of our process (6s)
Quality Measurement
- Effectiveness measures: The degree to which customer needs and requirements are met and exceeded. Some examples include the following:
- Percent defective
- Response time
- Efficiency measures: The amount of resources allocated in meeting and exceeding customer requirements. Some examples include the following:
- Cost per transaction
- Turnaround time
- Time per activity
- Amount of rework
A combination of inputs determines output (Figure 7.17).

Processes transform inputs into outputs.
Additional Reading
Picard, Daniel (ed.). The Black Belt Memory Jogger (GOAL/QPC and Six Sigma Academy, Salem, NH, 2002).
Wortman, Bill. The Certified Six Sigma Black Belt Primer (Quality Council of Indiana, West Terre Haute, 2001).