3
Waste Identification
There is nothing so useless as doing efficiently that which should not be done at all.
Peter F. Drucker
IN A NUTSHELL
Waste is generally composed of unnecessary activities that can be described either qualitatively or quantitatively. In its most basic form, LSS encompasses both these descriptors. Waste identification is also called learning to see muda, which is a traditional Japanese term for an activity that is wasteful and doesn’t add value or is unproductive, value-none, trivial, or unuseful.* It is also one of three key concepts in the Toyota Production System (TPS). The other two are mura, which means irregularity, unevenness, or variability, and muri, which refers to overburden or strenuous work.† These three terms describe the waste that infiltrates organizations and allows us to begin “learning to see” waste.
Waste identification and reduction is an effective way to increase profitability. Toyota merely picked up these three words beginning with the prefix mu-, which in Japan are widely recognized as a reference to a product improvement program or campaign.
In this chapter, we present fundamentals on how to recognize muda, mura, and muri in the workplace. The chapter discusses the importance of looking at your organization in new ways, developing an inquisitive approach that encourages questioning of current beliefs and practices, and taking a look at everything you do from the customer viewpoint. One approach is to start at the end; that is, walk backward through your organization assessing process steps in reverse and asking questions. To this end, we include a series of checklists to get the LSS practitioner thinking in new ways.
OVERVIEW
Until recently, when we talk about learning to see waste, we are considering organizational wastes, not behavioral wastes. However, behavioral wastes can severely hinder Lean initiatives. This chapter describes what waste is and how to identify waste. It also discusses the mindsets that are the root causes of waste. These mindsets or belief systems are put into context here and described with terms like just-in-case logic. Almost all organizational wastes or process wastes are related to an employee in the organization that holds a traditional belief system.
Learning to see variation (mura) or waste (muda) requires a shift in how we view our organization. How do we view our processes? How do we measure our processes? What questions we ask about process performance, people performance, and equipment performance all indicate how we look at variation and waste. Throughout this chapter we present checklists that help you to begin to question everything you do in an effort to learn to see variation and waste in a new light.
WHAT IS VARIATION?
The way in which numbers differ is called variation.* Virtually everything that is measured is subject to variation. Our equipment is subject to variation. Our employees are subject to variation. The instrumentation that we often use to measure a process is subject to variation. How we measure our measures can be a key source of variation. There is variability inherent in many methods completed in our value-adding processes. For example, one of the most critical and prevalent tools used in every organization today is the computer and its software packages. How we gather information, analyze information, and report information can be subject to tremendous variation. Based upon the simple observations, one can see why the study and understanding of variation is a critical component to an LSS organization.
Variation can also be described as “a measure of the changes in the output from the process over a period of time.”* As you collect data over time, you can measure and view the variation of process input variables, process methods, or process output variables. Understanding, controlling, and limiting process variation is a primary goal of any LSS practitioner. As we begin our journey toward being an LSS organization, we must become proficient at measuring variation, analyzing root causes of this variation, and taking corrective actions to eliminate variation from all of our processes.
The entire study of variation is an endeavor to quantify and chart process behavior. At the beginning of our value-added processes, we can quantify and chart our process input variables. These include the 5M’s: materials, machines, manpower, methods, and measurements. The objective here is to minimize variation in our supply chain inputs to our value-added processes. For example, by measuring variation in material specifications, we are able to better control our value-adding process steps, thereby assuring a predictable outcome for product performance.
How Do We Chart Variation?
One of the most common process output variables in an LSS environment is process lead time. In many instances, customers are sensitive to the amount of time it takes us to add value for them. How we organize our materials, deploy our human resources, set up our equipment, and sequence our value-added steps has a tremendous influence on our process output lead time. The average lead time chart in Figure 3.1 shows how the lead time varies over time, specifically, how month-to-month lead time varies during the year. It also shows the upper control limit (UCL) and lower control limit (LCL) for the data set.
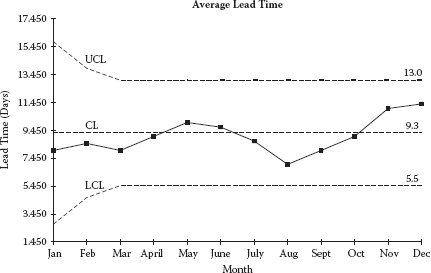
Average lead time chart.
Why Is Understanding and Controlling Variation So Important?
Simple charting like this can help us to understand, control, and improve lead time for our customers. The importance of understanding, charting, and controlling process variation cannot be overstated. Understanding variation and decreasing variation is the fundamental underlying foundation of all LSS organizations. First, it allows us to understand, control, and improve our entire supply chain, which includes many activities that are conducted outside of our physical facilities. Second, it allows us to uncover valuable insight concerning the interactions between materials and our processing equipment. Perhaps, more importantly, it provides a fundamental foundation for assessing our performance output behavior that is critical for customer satisfaction. Virtually all of our outputs are key performance indicators and subject to variation. As a consequence, our ability to understand and chart variation is paramount for improved performance from a customer viewpoint. The remainder of this chapter and several chapters that follow in this handbook are dedicated to understanding waste identification and process variation and applying LSS tools for process improvement.
WHAT IS WASTE?
Describing waste is not as easy as one might think. Waste appears throughout organizations and is often mixed with nonwaste. There are times and conditions within our organizations where deciding what is waste versus nonwaste can be somewhat of a moving target. For example, in today’s organization, e-mail is virtually impossible to live without as a communication tool. In and of itself, it has great capacity to assist with many processes. Yet it can also be a significant source of extra processing waste. The telephone can produce a similar waste, but are all telephone calls wasteful? There are times when some organizations consider inventory an asset, that is, right up until the customer no longer wants to purchase the inventory. Clearly, one or more definitions describing just what is waste (all no-value-added activities) and what is not waste (value-added activities) are needed.
Defining the Value-Added Work Components
LSS organizations are constantly searching for more effective ways to deliver value for the customer. How do we define value and distinguish it from activities that produce no value?
To better understand this term, we have provided you with a practical definition of value-added (VA), no-value-added (NVA), and no-value-added but necessary. (See Figure 3.2.) Value-added is an activity that transforms or shapes raw material or information to meet customer requirements.
Organizations that strive to eliminate NVA work while increasing their VA work are the ones that will be the most successful.* There are a number of ways to accomplish this. One of the most effective ways is to first evaluate the practices used, so you can recognize any NVA work and then take steps to reduce it and be more efficient in your work. The basic characteristics include VA components such as customer VA and operational VA, as well as NVA components such as idle time, rework, and bureaucracy. Detailed analysis of these factors is a fundamental part of waste identification and the foundation of LSS initiatives.
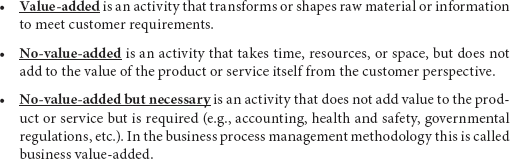
Definitions of VA, NVA, and NVA but necessary.
In the case of a manufacturing operation, VA means all those activities that turn raw materials into value (the product) for your customer. In the case of a service organization, VVA means all those activities that are required to deliver the intended service. In essence, the service is your product. Your VA product or service is what you end up with, or what the customer wanted. Conversely, NVA is anything that the customer in not willing to pay for. NVA entities can be employee activities, materials, information exchanges, and equipment. The difficulty comes in separating NVA from VA activities and still providing what the customer wanted. The remainder of this section is about identifying anything that is NVA in your organization.*
HOW DOES WASTE CREEP INTO A PROCESS?
Waste can creep into any process over time and usually does.* In the 1980s there was a popular story about a tire manufacturing plant in the Midwest. The story goes that they were conducting a continuous improvement effort when one of the observers posed a simple question to an operator. “Why are we wrapping these tires in protective white plastic?” The operator was not sure; his reply was that they had done it for the 3 years that he had been with the company. So they went to the shift supervisor and posed the same question. His response was that the machine was there since he joined the company 7 years earlier. He said that Charlie in maintenance may know: “He’s been here for 25 years.” So they headed off to maintenance to find Charlie. When they posed the question to him, he replied that it is to protect the whitewall tires in shipping. They hadn’t made whitewall tires in the plant for years; however, they continued to wrap the newer all-black tires as if they had whitewalls. This is one example where a product change without a process change allows waste to creep in to your process.
THE POWER OF OBSERVATION
From the Renaissance period in the 1500s to the emergence of many of the pure and applied sciences in the 1700s to 1800s, there were limited technical tools compared to today. There were no computers, no Internet with instant information, no instant communication, no telephone, and no mass transportation. The sharing of knowledge was slow and difficult. In relative isolation, science was advanced by disciplined individuals committed to observation and experimentation.
It was during these times that the power of observation was the dominant tool for improvement. As mechanical scientific instruments were developed, these highly trained and skilled observers applied these tools, coupled with keen observation capabilities, to make astounding discoveries. However, in almost every organization that we go into, the power of observation is almost nonexistent. Employees at all levels wander through the organization focused on their individual worlds and completely ignoring the blatantly obvious signs of waste that engulf their organization.
Some have called these organizational cataracts. These cataracts can grow and hinder our vision and render the power of observation an obsolete tool. Managers fail to see the waste of rework associated with the poor scheduling or haste with which they initially produced a product. Employees focused exclusively on a daily production deadline completely miss a multitude of opportunities to improve their environment in favor of producing the daily production quantity.
This approach (observation and experimentation), which has been used by science for hundreds of years, is the key to advancing knowledge and improving our understanding of our surroundings. We must be able to accurately observe our surroundings, document what we see, investigate and analyze our observations to find out what is causing what we see, and ultimately take effective action to improve our environment.
This emergence of the power of observation is a key ingredient in the formation of a learning environment. The remainder of this chapter is about igniting the power of observation in our employees. More importantly, it’s about learning to see waste and variation with new eyes, eyes that know what to look for.
SEEING WITH NEW EYES
Traditionally, Lean has classified waste into eight major categories. These categories were developed based upon visual symptoms in the organization. We have added a ninth waste, behavior waste, which revolves around individual and collective belief systems and how they influence daily behavior. The remainder of this chapter discusses each category in detail.
What types of waste are present? What are typical causes of each waste? How can waste be identified? Checklists are included to assist you with learning to see waste and variation. However, you are encouraged to expand these checklists by looking at each process step in your organization and developing your own questions. The nine waste categories are:
- Overproduction
- Excess inventory
- Defects
- Extra processing
- Waiting
- Motion
- Transportation
- Underutilized people
- Employee behavior
Waste 1: Overproduction
Overproduction means making more of a product than is needed by the next process or the end customer.* It can also be described as making the product earlier in time than is needed or making a product at a faster rate than is needed. Overproduction has been labeled by some as the worst waste because typically it creates many of the other wastes. For example, overproduction leads to excess inventory, which in turn leads to the wastes of motion and transportation. In addition, excess inventory requires more people, equipment, and facility space, all of which reduce company productivity and profitability. This is shown in Figure 3.3.

Waste of overproduction.
What Causes Overproduction?
Overproduction can be traced to many management and employee behaviors. Some of the most common causes are:
- Just-in-case logic
- Unleveled scheduling
- Unbalanced workloads
- Misuse of automation
- Long process setup times
The Just-in-Case Logic Trap
Just-in-case logic is exactly what it sounds like. You make more product just-in-case—you fill in the blank. For example, just-in-case the machine breaks down, just-in-case our suppliers don’t send enough raw materials, just-in-case our customer orders more than we can make or deliver on time, etc. There are many reasons for using just-in-case logic, and they are all bad!
Just-in-case logic is one of the most common non-Lean employee behaviors present in companies today. It is responsible for productivity losses in any type of organization by robbing employee time when working on NVA overproduction. It is commonly found in other waste categories, such as the waste of motion, transportation, inventory, waiting, and defects. Most importantly, it reveals an inherent weakness in your current process capability and reliability. Managers that practice just-in-case logic invariably have poorly understood processes and poor process control. Instead of fixing the process, they prefer to mask the system with just-in-case overproduction. They have fallen into the just-in-case logic trap. Don’t do it!
Unleveled Scheduling and Unbalanced Workloads
Unleveled scheduling and unbalanced workloads can both lead to overproduction. When these conditions occur and employees continue to produce, even when there is no customer demand, overproduction occurs. In forecast-driven environments unleveled scheduling frequently occurs. In areas where the workload is not balanced properly between two or more process steps, one step will have excess capacity while the next may have excess demand.
Misuse of Automation
Another common mistake is that owners, senior managers, and/or department managers want to see expensive equipment running, not sitting idle. This misuse of automation can cause severe overproduction. Not very often does customer demand exactly meet machine capacity. One of the most difficult challenges for LSS practitioners is to change the misconception that the machine must always be running. In environments where there is a combination of automated and manual production, the misuse of automation at one process step creates the unleveled scheduling and unbalanced workloads at downstream process steps. In this case we have one cause of overproduction (misuse of automation) forcing overproduction at another process step.
Long Process Setup Times
The length of time required to set up equipment has long been a primary justification for overproducing and carrying excess inventory. The traditional thought is that if your setup times are long, then you must build larger batches than are required. One traditional approach is to define an economic order quantity (EOQ) where the changeover cost + the inventory carrying cost are the lowest, and then you build a batch this size. This concept is shown in Figure 3.4. Do these assumptions on batch size selection make sense if changeover time can be significantly reduced? The answer is no. As you reduce changeover time, you reduce both changeover cost and the inventory carrying cost, and the EOQ moves toward the left on the chart. In this case, instead of using EOQ, target your processes to build just what the customer wants. The most cost effective EOQ is always what the customer wanted.
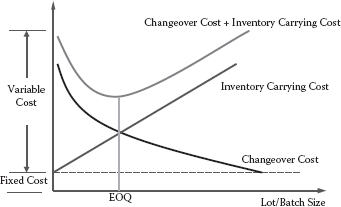
Batch size selection based upon changeover cost and inventory carrying costs.
This is a classic example of bad measures driving bad behavior. The primary assumption that you have to live with long changeovers and high inventory levels and inventory carrying costs, rather than try to eliminate them, was made based upon these two measures. In an LSS environment we focus on the process (long changeover time), identify the waste, and eliminate the waste by simplifying the setup process.
How to Identify Overproduction
The learning to see overproduction checklist in Figure 3.5 presents several questions designed to help you identify overproduction.
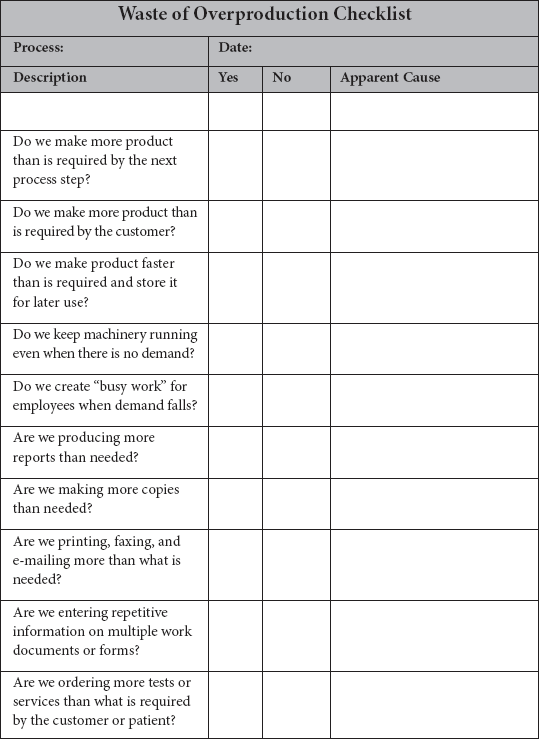
Learning to see overproduction checklist.
Waste 2: Excess Inventories
Excess inventory is “any supply in excess of a one-piece flow through your manufacturing process.”* One-piece flow is often referred to as a make one–move one environment. Excess inventory could also refer to any finished goods inventory. Most organizations today run a mixed model of both “build to order” and “build to stock” products. Although some amount of raw materials and finished goods is required, many organizations use inventory to cover up poor process performance. They keep raising the level of inventory until they cover process problems.
Like all of the nine wastes, living with excess inventory creates the “more syndrome.” For example, in an excess inventory environment, your company requires more people, more equipment, and more facility space. All the while you’re making more products (that you may or may not have customers for), more defects, more write-offs, etc. The “more syndrome” robs your company of productivity and profitability. In an LSS environment we reduce the sea of inventory and use the Lean or Six Sigma tools to identify the root causes of why the inventory was needed and then eliminate the root causes once and for all.
What Causes Excess Inventory?
- Poor market forecast
- Product complexity
- Unleveled scheduling
- Unbalanced workloads
- Unreliable or poor-quality shipments by suppliers
- Misunderstood communications
- Reward system
Poor Market Forecast
Many organizations decide what they will build based upon a market forecast. Basically they take a sales and marketing forecast and convert it to a manufacturing forecast and then in turn set up a build schedule. Unfortunately, the only thing we can say about a forecast with a high degree of certainty is that it will be wrong. When this occurs, organizations are typically left with large amounts of inventory, much of which may be unsaleable.
Product Complexity
In a rush to get to market, many products are moved from the product development to full production before sufficient design for manufacturability has been completed. When product complexity is high, there are several issues that lead to excess inventory. These include raw materials performance issues, engineering changes that lead to supplier changes, production issues, and in-service performance, to name a few. In a competitive product cost environment, product complexity and high quality are often at odds with each other and are another source of excess inventory.
Unleveled Scheduling and Unbalanced Workloads
Similarly with overproduction, unleveled scheduling and unbalanced workloads can both lead to excess inventory. These conditions typically occur in forecast-driven environments. In areas where the workload is not balanced properly between two or more process steps, one step will have excess capacity while the next may have excess demand. In the end, you wind up with excess inventory.
Unreliable or Poor-Quality Shipments by Suppliers
LSS organizations can only be sustained with an LSS supply chain. Inferior materials can, and often do, produce myriad troubles during your VA activities. Unreliable suppliers that deliver materials of poor quality or insufficient quantities only serve to help your competitors. To achieve LSS performance, focus on developing relationships with LSS suppliers.
Misunderstood Communications
Poor communication invariably leads to excess inventory. In the age of information overload, it is staggering how much bad information our employees are using and how much good information is being unused or misused. There are basically three fundamental areas in all organizations. (See Figure 3.6.) These are product development or service delivery, operations management, and information management. Most companies are good performers in one or two of these categories, but rarely all three. Depending on the nature and structure of the senior management team, more emphasis usually goes to one area. For example, companies with a perceived technology advantage tend to pay more attention to product or service development at the expense of the other two areas. When communication breakdowns occur, inventory increases, quality decreases, and profitability is hurt. These are signs that you are in a poor communication environment:
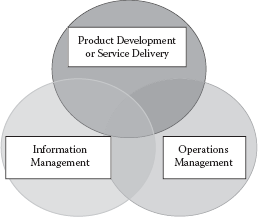
The organizational universe.
- Poorly understood customer requirements
- Product or service is frequently delivered late
- Poor customer satisfaction
- Incomplete or inaccurate documentation
- Poor work instructions
- Inadequate information management system
- Barriers between departments
- Conflicting measurements system
Rewards System
There are several factors of company-wide rewards systems that can contribute to excess inventory. These factors can originate from senior management or from most departments. Since we know that measures drive behavior, poorly defined measures tied to rewards often result in excess inventory and many other wastes.
One example could be if an operations group has a measure of “on-time delivery” without regard for inventory levels. Another may be how the sales group gets compensation. Still another may arise from inadequate knowledge of the true cost of carrying inventory. Regardless of the reasons, if a large level of inventory exists in your facility, review the rewards program for an inadequate measurements system.
How to Identify Excess Inventory
The learning to see excess inventory checklist presents several questions designed to expose inventory waste. (See Figure 3.7.)

Waste of inventory checklist.
Waste 3: Defects
What Causes Defects?
Defects can result from myriad causes. These causes can be classified into a few basic areas listed below. Each is followed by a brief description.
- Customer needs not understood
- Poor purchasing practices or quality materials
- Inadequate education/training/work instructions
- Poor product design
- Weak process control
- Deficient planned maintenance
Customer Needs Not Understood
Establishing comprehensive customer requirements is essential to defect-free products. More often than not we think we know what the customer wants or we make many assumptions about how he or she will use our product or service or what’s important to him or her in terms of product or service performance. The more we can know in this area, the better we can develop our processes to respond to customer requirements.
Poor Purchasing Practices or Quality Materials
In the global marketplace, controlling the supply chain is an ever-increasing challenge. Purchasing departments typically have their own stand-alone measures based upon dead materials costs. Material costs are typically very visible in financial statements and a common target for cost reductions. This never-ending pressure for cost reduction frequently pushes product quality below levels expected by customers.
What’s not present on most financial statements is the cost of quality, which includes repair and rework. Oh, it’s present on the bottom line; however, there is no individual expense line item that can be targeted. Many defects can be traced to inferior quality materials. Repair and rework costs for these defective materials increase dramatically the further into the value stream your product gets before the defect is discovered. Numbers for how much this costs vary greatly across industries. Some of the components of this cost may include:
- Cost of communication with supplier
- Cost of storage until a disposition can be made
- Cost of employee time for physical moves or quarantine
- Cost of employee doing this NVA activity instead of a VA activity
- Cost of repair if required
- Cost of returns to suppliers
- Cost of re-engineering
- Cost of re-inspection
- Cost of productivity losses on new products due to staff re-assignment to complete rework
Inadequate Education/Training/Work Instructions
Here is an important rule of thumb: At any given point in time, you should have cross-training capacity at 150% of full production at each process step. To accomplish this, there needs to be a well-defined and executed cross-training program and effective work instructions to carry out the program. Often employees are asked to produce a quality product without adequate education, training, or visual work instructions to complete the task. One of the most effective means of defect reduction is the preparation of visual work instructions.
Poor Product Design
Many defects can be traced to poor product design. In examining product design failures, look for cost restrictions, poorly understood in-service product performance requirements, poor materials’ selection, little or no product performance testing, and poor supplier performance. Regardless of the root cause of poor product design, the cost for a part design change increases dramatically the further into the value stream the product is before the defect is detected. The relative cost to mitigate a defect detected along the value stream using design engineering as a baseline of $1 is:
- $1 product design engineering
- $2 product manufacturing engineering
- $4 production
- $5 to $10 if the product reaches the customer
In some industries the cost could be significantly more. Many pharmaceuticals, for example, have limited shelf lives. If defect detection occurs at the customer, there may be insufficient time for return and repair or rework, requiring a complete write-off of the shipment. In this case, material/labor/facilities’ costs plus profit are lost, not to mention the bad will created with the customer.
Weak Process Control
In all process environments either you control the process or the process controls you. Weak process control can stem from several sources, including deficiencies in materials, machines, manpower, methods, or measurements. It is easy for weak process control to creep into your processes. The three telltale signs you need to work on process control are defects, rework, and high scrap rates.
Deficient Planned Maintenance
Poor equipment maintenance is often a cause for defective products. The justification for not completing planned maintenance can range from not enough time to do Total Productive Maintenance or autonomous maintenance, to can’t afford to have production down, to equipment repairs are too expensive, to name a few. In the long run, effective equipment maintenance is always less expensive than equipment breakdowns due to poor maintenance, the cost of scrapping defective parts, or the added cost of rework.
How to Identify Defects
Defects are often only defined as something that an employee can tangibly see in the product. However, a defect is better described as anything that contributes to a product not meeting exactly what the customer wants. The list of questions in Figure 3.8 should help you begin to expose a number of possible defects. This list could be greatly expanded; however, it should give you an idea of how to begin your search for anything that may possibly affect your product or service and be considered a defect.

Defect detection questions.
Waste 4: Extra Processing
Processing waste is described as any effort that adds no value to the product or service from the customers’ viewpoint. These are steps that may not be necessary. Many examples of processing waste are present in any product or service delivery. For example, let’s consider a product with 15 steps. If a sub-assembly at process step 3 is not assembled correctly, the product moves through the facility and the problem is initially detected at assembly step 13. Unfortunately, steps 5, 7, 9, and 11 may need to be disassembled and the correction made before step 13 can proceed. These repeated steps are rework and take valuable time away from employees who could be working on new products. This extra effort is called processing waste.
What Causes Processing Waste?
Processing waste can stem from many sources and is often present regardless of the activity type. Processing waste is predominantly waste that is found in front-office areas, such as order processing, information gathering and dissemination, and all accounting functions. It is also dominant in service industries where service-delivery requirements may be ill-defined or difficult to achieve. Industries like the medical field, janitorial, or food-service industries may have extensive processing waste from several apparent causes. These causes can be classified into a few basic areas listed below. Each is followed by a brief description.
- Product changes without process changes
- Just-in-case logic
- True customer requirements undefined
- Overprocessing to accommodate downtime
- Poor communication
- Redundant approvals
- Extra copies/excessive information
Product Changes without Process Changes
When a product or service is changed, production staff or service personnel need to be properly informed. For example, visual work instructions or service-delivery instructions need to be modified and training conducted for the new process. In many growing companies, products or services are changed frequently, often with little or cursory regard for production or service-delivery personnel. This can be a major source of processing waste for a range of product or service quality issues.
Just-in-Case Logic
Just-in-case logic is exactly what it sounds like. You make more product just-in-case—you fill in the blank, for example, just-in-case the machine breaks down, just-in-case your suppliers don’t send enough raw materials, just-in-case your customer orders more than you can make or deliver on time, etc. There are many reasons for using just-in-case logic, and they all contribute to decreased company profitability! Just-in-case logic is a primary cause for overprocessing waste.
True Customer Requirements Undefined
When customer requirements are poorly understood or not documented properly and employees are not adequately trained on requirements, extra processing is bound to occur. AN LSS process starts with a clear fundamental understanding of customer requirements. This typically involves a critical to quality (CTQ) assessment and definition of all product or service requirements from the customer standpoint.
Overprocessing to Accommodate Downtime
In traditional organizations, one belief is that people must be busy on production at all times. Consequently, managers order people to produce products even when none are required by a downstream customer. This results in overprocessing and creates overproduction and excess inventory. Alternatively, this time should be used for additional LSS training, cross-training programs, or other continuous improvement activities.
Poor Communication
Poor communication is typically one of the top reasons that organizations lose effectiveness. Communicating information along the entire value stream is critical for a great customer experience. The earlier in any process that the communication breaks down, the worse is the resulting waste. A typical communication cycle includes:
- Identifying critical to quality (CTQ) customer requirements
- Transitioning customer requirements into product or service specifications
- Engineering the product or service
- Creating instructions for producing the product or service
- Product or service delivery to the customer
Redundant Approvals
Although there is a need to have some cost and quality control approvals in any process, it is easy to stifle the process by requiring redundant approvals that can dramatically increase lead time and increase total product cost. After reviewing many approval procedures over the years, this has been identified as a significant example of extra processing.
Extra Copies/Excessive Information
Information sharing can be a significant source waste. How many reports are printed and not read? If they are read, how many items are actions taken on? Then there are charts, graphs, memorandums, e-mail distributions, etc., leading to information overload for employees. One example is what can essentially be described as the e-mail soap opera. The saga begins with one controversial statement or aspect that was sent to too many employees. It quickly evolves into long series of clarifications and reclarification e-mails, with each e-mail raising more questions than it answers. These types of e-mail dialogues rapidly consume significant employee time and energy of everyone involved.
How to Identify Processing Waste
The learning to see processing waste checklist presents some basic questions to uncover process waste.* (See Figure 3.9.)
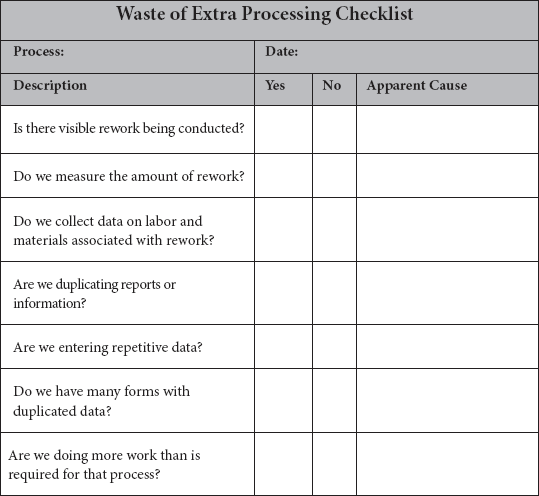
Waste of extra processing checklist.
Waste 5: Waiting
Waiting waste is often described as time waiting for something to happen or occur. This could be human waiting time, machine waiting, or materials waiting to be processed. When this waste occurs, ultimately it is the customer who is left waiting as lead times expand to accommodate the numerous waiting steps in your processes.
What Causes Waiting Waste?
Waiting time waste may be caused by several sources. Some examples include materials conveyance delays, machinery or equipment breakdowns, operators working too fast or too slow, and an insufficient number of employees, to name a few. Causes of waiting waste include:
- Raw material outages
- Unbalanced scheduling or workloads
- Unplanned downtime for maintenance
- Poor equipment or facility layout
- Long process setup times
- Misuses of automation
- Upstream quality (flow) problems
Raw Material Outages
A prevalent root cause of waiting waste is raw material outages. Poor purchasing practices or purchasing measures can often lead to inadequate raw materials’ inventories. Without raw materials you cannot add value for your customers and you bear all the material-related liability. For example, if you make a product that has 25 components and you are out of 2, you cannot build your product. However, you have the inventory carrying costs for the 23 components in stock. In addition, allowing outages to occur almost guarantees some of the other wastes, such as overproduction and extra processing. You cannot build the entire product, so you start building parts, and soon mountains of incomplete sub-assemblies begin to appear around the facility as work-in-process (WIP). Raw materials outages and management can be an LSS project focus topic.
Unleveled Scheduling and Unbalanced Workloads
Similarly with overproduction, unleveled scheduling and unbalanced workloads can both lead to the waste of waiting. These conditions typically occur in forecast-driven environments. In areas where the workload is not balanced properly between two or more process steps, one step will have excess capacity while the next may have excess demand. In the end, you wind up with equipment, materials, and/or manpower waiting.
Unplanned Downtime for Maintenance
When a machine breaks down unexpectedly, there is a significant opening for the waste of waiting. In addition, during the waiting period overproduction or extra processing can follow when management decides the result of finding things for employees to do until the equipment is back on-line. These extra activities are often viewed as steps that would be necessary to complete and not as waste. However, as shown in overproduction and extra processing, these are truly wastes and should be measured and subsequently eliminated.
Poor Equipment or Facility Layout
Equipment placement and facility layout are primary sources of the waste of waiting. The position of equipment within a facility is frequently decided based upon (1) shortest run from electrical service, (2) currently open floor space, and (3) a position near similar equipment, or in an expansion location. None of these criteria are based upon a proper manufacturing sequence or limiting any of the nine wastes. Poor equipment and facility layout can result in significant motion, transportation, and waiting wastes.
Long Process Setup Times
When the time to change equipment over to a different product is long, this can be a contributor to the waste of waiting. Although long process setup times can vary depending on the equipment and complexity of the transition, process setups are necessary for most equipment. Every minute, hour, or day consumed by setup is time permanently lost to waiting and contributes to lower productivity and profitability.
Misuse of Automation
A common mistake that owners or managers often make is that they want to see expensive equipment running, not sitting idle. This misuse of automation can cause the waste of waiting. Not very often does customer demand exactly meet machine capacity. One of the most difficult challenges for LSS practitioners is to change the misconception that the machine must always be running. In environments where there is a combination of automated and manual production, the misuse of automation at one process step creates the unleveled scheduling and unbalanced workloads at downstream process steps.
Upstream Quality (Flow) Problems
Product quality issues can lead to a number of wastes. Two prominent wastes are extra processing and waiting. In the case of many complex products that contain sub-assemblies, as soon as quality issues are uncovered upstream, remaining downstream steps are caught in a waiting game for completed quality sub-assemblies. Every process step should target 100% first-pass quality.
How to Identify Waiting Waste
Waiting waste can be present across the entire value stream. Regardless of the reason for the waste of waiting, the objective of learning to see is to identify where and when in the process waiting waste occurs. The checklist in Figure 3.10 is an effective tool to identify where, when, and how the waiting waste is occurring in a process.

Waste of waiting checklist.
Waste 6: Motion
Waste of motion occurs when there is any movement of people or information that does not add value to the product or service.* The ultimate objective in an LSS organization is to properly connect materials, machines, man/woman power, and methods. When this is achieved, there is a state of continuous flow. Continuous flow is often credited with the highest levels of quality, productivity, and profitability. Wherever there are disconnects between two entities, for example, materials and people, the waste of motion is inevitable.
What Causes Motion Waste?
There are many possible causes for the waste of motion. Some of the major sources are:
- Poor people, materials, and machine effectiveness
- Inconsistent work methods
- Poor information management
- Unfavorable facility or cell layout
- Poor workplace organization and housekeeping
Poor People or Machine Effectiveness
Employee interactions with materials and machinery may result in the waste of motion. This happens when employees have to walk distances to pick up or deliver materials by hand. It can also occur when information must be hand delivered from one process step to another. One example may be delivering a completed order back to accounting to complete the billing cycle. Another example may be delivering a completed order to shipping for scheduled delivery.
Inconsistent Work Methods
Whenever work methods are not documented properly, a number of inconsistent and poor practices slip into any process. The best counter to inconsistent work methods is the creation of standard operating procedures or visual work instructions. These become the foundation of all effective employee training programs. In their absence employee learning occurs through the passing down of “tribal knowledge” known only to “experts” in your organization. Learning that occurs under these conditions is open to interpretation by the employee on “what to do next” or “how to do” specific activities in the process. This frequently results in several employees doing the exact same activity differently. Inconsistent work methods not only result in the waste of motion, but also are frequently the root cause of product- or service-delivery quality issues.
Poor Information Management
The transition of information between employees, departments, and customers often leads to the waste of motion. Information management systems that are not set up to make required information available to employees when and where it’s needed often results in employees doing printouts and manual document transfers around the organization. As with many wastes, the waste of motion can also cause several other wastes. For example, when shipping instructions for a specific customer are not completely defined in the information management system, an employee in shipping must stop to track down the proper information, which can require going to order processing or customer service to obtain the information. This initial waste of motion produces the waste of waiting and the waste of extra processing before the order can be properly shipped.
Unfavorable Facility or Cell Layout
If the facility layout is weak, the waste of motion will be present. By facility we mean any department in an organization, wherever value is created for the customer. The layouts of administrative areas, such as order processing, customer service, accounting, and warranty claims departments, are seldom considered as areas where waste can occur, but often are significant sources for the waste of motion. This is due to the frequent manual transportation of documents necessary in these areas, as well as an inordinate amount of information exchange required to produce your product or service.
In a production environment poor facility layout results in excess waste of motion regarding moving raw materials in a position to add value, securing tools and fixtures, or delivering materials to the “next process step.”
Poor Workplace Organization and Housekeeping
It never ceases to amaze me how little attention is paid to workplace organization and housekeeping. Managers would rather employees spend hours searching for tools, materials, documentation, etc., than allow 30 minutes/day to maintain an organized work area. This philosophical fixation that every employee activity must be producing product is responsible for many of the wastes observed in organizations today. Every day managers can walk by piles of obsolete materials, in-process rework, and mountains of defective warranty returns, while continuing to allow no time for employees to correct the conditions that produced these results. All process improvement programs begin with workplace organization and housekeeping.
How to Identify Motion Waste
Motion waste can be present across the entire value stream. Regardless of the reason for the waste of motion, the objective of learning to see is to identify where and when in the process motion waste occurs. The checklist in Figure 3.11 is an effective tool to identify where, when, and how the motion waste is occurring in the process.
Waste 7: Transportation
Transportation waste is any activity that requires transporting parts and materials around the facility. Unlike motion waste that typically involves only people, transportation waste is usually reserved for action involving equipment to move materials or parts.* This equipment comes in many forms, such as carts, rolling racks, forklifts, golf carts, and bicycles, to name a few.
What Causes Transportation Waste?
Transportation waste can be caused by a number of factors. The major causes are:
- Poor purchasing practices
- Large batch sizes and storage areas

Waste of motion checklist.
- Inadequate facility layout
- Limited understanding of the process flow
Poor Purchasing Practices
The largest contributor to transportation waste is poor purchasing practices. Many organizations measure their purchasing effectiveness on the dead cost/piece for raw materials purchased. This can lead to incredible waste throughout the organization, not just transportation waste but also the waste of overproduction, inventory, extra processing, and defects.
Let’s consider a real-world example to demonstrate how non-Lean measures can drive non-Lean behavior within an organization. Let’s say your organization has a program in place to drive the cost of raw materials down and John’s, the purchasing department manager, bonus is dependent on a 10% reduction in raw materials costs. He has his heart set on that 60-inch plasma TV with surround sound installed before football season, so consequently he sees little else except achieving the dead materials cost reduction.
John begins to think: How can he achieve this predefined material cost reduction? Two actions immediately come to mind; both are non-Lean. First, he can go to current suppliers and try to get price decreases. These decreases usually require that the organization buy in larger volumes, which he does immediately. In fact, at the next manager’s meeting John is eager to get a pat on the back from the boss and reports that he has secured a 3% material cost reduction in the first month of the program; the unnecessary raw materials, along with the corresponding inventory and transportation waste, begin to show up in receiving the very next week.
Second, he can search for secondary suppliers that are willing to provide supposedly equal raw materials. At first glance they appear to be equal in every way—specification, function, and quality. He begins to substitute some of these raw materials and again achieves more raw materials cost reductions that are, of course, well received by management. John achieves his bonus and spends Sunday afternoons in bliss with his favorite beverage and gridiron action—an apparent happy ending. Not so fast. In the next few weeks during production, some inconveniences arise because the new materials aren’t exactly like the original parts. This leads to some in-process defects that require rework or the waste of extra processing. In addition, weeks later returns begin from customers for poor product service in the field.
Because the sales price is based upon typical labor standards, these extra production costs and warranty return costs don’t appear on management’s radar and consequently don’t exist. Only after months, when management realizes the shrinking profit margins, does another costly search for the reasons begin. This is a classic non-Lean example of how non-Lean traditional measures can drive non-Lean behavior. In this case, what did John learn to see? Certainly not the waste! His behavior was being completely driven by his measurement system.
Large Batch Sizes and Storage Areas
The waste of transportation can also occur when you process large batches of product or set up large storage areas. Both of these decisions require that the materials be moved at some time. These moves invariably require people (materials handlers) and equipment (forklifts, carts, pallet jacks, flatbeds, etc.). This situation is almost always the symptom of a poor purchasing decision that was based upon a non-Lean traditional management belief that organizations save money when they buy large batches of materials.
Inadequate Facility Layout
One of the primary causes of transportation waste is poor facility layout. Where you place equipment, how and where your materials storage areas are set up and regularly accessed, and your organization’s purchasing philosophy all affect productivity and profitability. Proper facility layout can reduce lead time by up to 40%, and dramatically reduce the waste of waiting, transportation, and motion.
Limited Understanding of Process Flow
In every process there needs to be a thorough understanding of the materials, machines, man/woman power, or methods required to add value for the customer. A primary component of Lean—and a constant goal for LSS practitioners—is continued process development and deeper understanding of process knowledge. It is important to understand the best sequence of process steps to meet customer demand, such as: How are activities conducted? How fast is product needed? Where do materials get consumed? What are the fluctuations in manpower requirements? Is the correct type of equipment available? Is the equipment in working order? Having well-defined answers for these factors contributes to improved process understanding.
How to Identify Transportation Waste
The learning to see transportation waste checklist presents some specific questions that can help you uncover transportation waste. (See Figure 3.12.)
Waste 8: Underutilized Employees
The waste of underutilized employees often occurs when we fail to recognize and harness people’s mental, creative, innovative, and physical skills or abilities. This is present to some extent in almost every company, even organizations that have been practicing Lean behaviors for some time. Much of this employee misuse stems from the management concepts previously discussed regarding traditional organization belief systems. Although many Western managers pay lip service to “our employees are our most valuable asset,” they are the first to philosophically look at employees as a liability, not an asset. Many are often quick to practice management by head count—this is the practice of stating that we will operate with a specific number of employees regardless of the number required to provide good performance for the customer.

Waste of transportation checklist.
What Causes Underutilized Employees Waste?
There are a number of causes of underutilized employees or people waste. Each of these stems from some aspect of traditional belief systems.
- Old guard thinking, politics, the business culture
- Poor hiring practices
- Low or no investment in training
- Low-pay, high-turnover strategy
Old Guard Thinking, Politics, and Business Culture
Old guard thinking, politics, and general business culture often stifle using employees’ creative skills or producing innovative assignments that could result in significant process improvements. Unfortunately, in many organizations an employee’s perceived importance to the organization is generally directly proportional to his or her salary or directly linked to his or her title. This is common in the United States and seldom seen in Japanese companies.
Poor Hiring Practices
Most human resource departments are faced with the difficult task of how to attract and retain skilled employees. Poor hiring practices usually stem from the structure of the department and management’s mandate for critical components of the hiring process, such as pay level, required skills, or required experience. All of these could hinder getting the best candidate for the position.
There are many factors that can go into poor hiring practices. A few common mistakes include:
- Inadequate job advertisements
- Position definition
- Nepotism
- Not matching skills to position requirements
- Not understanding the technical aspects of job requirements
- Inability to identify the skills necessary to add value to a position
Low or No Investment in Training
Good data on training time, although readily available from many sources, is often difficult to translate to an organization. The American Society for Training and Development (ASTD) puts the dollars per year per employee at about $1,400. For a $40,000/year employee, this equates to about 3.5% of annual salary. It has been cited in the literature that top-performing companies spend approximately 4 to 6% of annual salary on training. It has also been reported that average American companies spend less than 5% on employee training. LSS organizations often approach 10%, with 3 to 4% of annual salary direct spending on new training and 6% employee time committed to improvement activities.
All companies tend to view training differently. One observation is unavoidable—poor-performing companies tend to invest little or nothing in training, while higher-performing organizations invest in training and focus on process improvement.
Low-Pay, High-Turnover Strategy
Another common trait of traditional organizations is the “low-pay, high-turnover rate” philosophy. This is characterized by hiring to a specific hourly or salary level regardless of skills, and living with the performance that pay rate returns. Because the conditions are poor, employees either leave to pursue a better opportunity or are let go by the company for myriad reasons. This is an internally focused philosophy and completely ignores the voice of the customer.
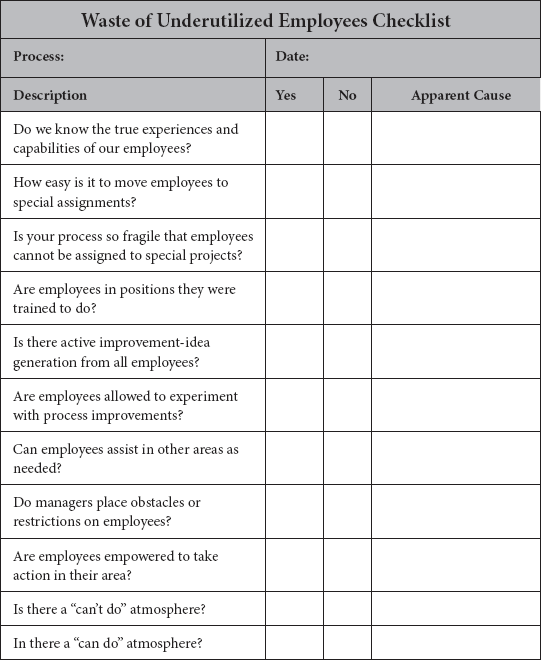
How to Identify Underutilized Employees Waste
The learning to see underutilized people checklist in Figure 3.13 points out some questions you can use to assess your current employee utilization and expose some apparent causes for lack of effective employee use.
Waste 9: Behavior
Behavior waste is any waste that results from human interactions. It is present to some extent in all organizations. It can be minimal in truly LSS organizations; however, it can be pervasive and devastating in traditional organizations. Behavior waste naturally flows from an individual’s or a company’s inherent beliefs. “The concept of waste has not yet been effectively extended to the self-defeating behaviors of individuals and groups of people in the workplace.”*
Behavior waste is a root cause of the other eight common wastes. Many of the previously described wastes alluded to employee beliefs and behaviors as causes for waste generation. The identification and elimination of behavior waste is critical to any successful LSS initiative.
Waste of underutilized people.
How to Identify Behavior Waste
Behavior waste is classified as either personal (yourself) or people (between two or more employees). Identifying these behavior wastes in your organization is the first step to elimination of this disruptive waste.
Personal Behavior Waste
Personal waste is waste that comes from within oneself. It stems from the way you view yourself, your goals and objectives, or possibly your position in the organization. Oftentimes personnel who prefer a Theory Y organization (empowered-employee environment) and are working in a Theory X organization (command and control environment) feel underappreciated. As a consequence, they become an underutilized employee and can exhibit low morale. The personal waste they generate comes directly from their individual belief system. Gossip, self-imposed barriers, deceptions, and ego are a few of the many examples of personal waste.
Personal waste has been described as the little voice inside your head that provides constant running (negative) commentary. It can control an employee’s inability to suspend judgment and projects unresolved internal conflicts of the employee. It does not take much personal waste to bring continuous improvement to a screeching halt. In fact, personal waste will restrict process improvement and Lean deployment at any process step that touches this employee, which is basically your entire value stream.
People Behavior Waste
People waste has to do with relationships between fellow employees. This includes between department managers and senior managers, as well as the manager-employee relationship. Some categories of people waste include turf wars, fiefdoms, or politics. Some specific examples of what people say when they are exhibiting people waste are:
- “Bill’s initiative is so stupid!”
- “Forget about what Jane says!”
- “John is impossible to work with!”
One can see how personal waste, when coupled with people waste, can stifle all process improvement.
SUMMARY
Learning to see variation and waste is a critical first step to improving quality, productivity, and profitability. Only after employees begin to learn to see waste and variation with new eyes can they identify previously unnoticed waste in the organization and effectively begin to eliminate the sources of waste and variation.
Processes add either value or waste to the creation of goods or services. The seven wastes originated in Japan, where waste is known as muda. The eighth waste is a concept tool to further categorize muda and was originally developed by Toyota’s chief engineer Taiichi Ohno as the core of the Toyota Production System, which also became known as Lean Manufacturing. The ninth waste—behavior waste—is by far the most damaging of all the wastes. The reason is simple: Everything we think, everything we say, and everything we do shape the behavior of all employees in our organization and gets them going in a direction of either creating value for the customer or creating waste.
To eliminate variation or waste in a process, it is important to understand exactly what waste is and where it exists, and to clearly view, measure, and limit variation. While activities can significantly differ between factories and the office workplace may seem to be a different world, or in service organizations where the product is actually a service, the typical wastes found in all these environments, and in fact in all business environments, are actually quite similar.
All forms of the nine wastes are highly costly to an organization because waste prohibits the smooth flow of materials and actually degrades quality and productivity. The Toyota Production System mentioned in this chapter is also referred to as just-in-time (JIT) because every item is made just as it is needed. Conversely, overproduction is referred to as just-in-case. This creates excessive lead times, results in high storage costs, and makes it difficult to detect defects. The simple solution to overproduction is turning off the tap; this requires a lot of courage because the problems that overproduction or behavior wastes are hiding will be revealed. The concept is to schedule and produce only what can be immediately sold and shipped and improve machine changeover/setup capability.
For each waste, there is a strategy to reduce or eliminate its effect on an organization, thereby improving overall performance and quality, while at the same time lowering costs. Learning to see is all about learning to use these strategies and tools in a productive manner.
_____________________________
* Muda, ![]() translation to English on Sanseido: “exceed.” Japanese-English Dictionary.
translation to English on Sanseido: “exceed.” Japanese-English Dictionary.
† Lean Lexicon, 4th ed., Lean Enterprise Institute, Cambridge, MA, March 2008.
* H. James Harrington, Glen D. Hoffherr, Robert P. Reid Jr., Statistical Analysis Simplified, McGraw Hill, New York, 1998.
* H. James Harrington, Praveen Gupta, Frank Voehl, The Six-Sigma Greenbelt Handbook, Paton Press, New York, 2009.
* As a management technique, companies seek to provide additional value-added in their products as a way of distinguishing them from competitors; value-added in this sense is a means of avoiding commoditization and maintaining profit margins.
* Many of the TPS/Lean techniques work in a similar way. By planning to reduce manpower, or reduce changeover times, or reduce campaign lengths, or reduce lot sizes, the question of waste comes immediately into focus upon those elements that prevent the plan being implemented. Often it is in the operations area rather than the process area that muda can be eliminated and remove the blockage to the plan. Tools of many types and methodologies can then be employed on these wastes to reduce or eliminate them.
* Shigeo Shingo divides process-related activity into process and operation. He distinguishes process, the course of material that is transformed into product, from operation, which are the actions performed on the material by workers and machines. This distinction is not generally recognized because most people would view the operations performed on the raw materials of a product by workers and machines as the process by which those raw materials are transformed into the final product. He makes this distinction because value is added to the product by the process but not by most of the operations. He states that whereas many see process and operations in parallel, he sees them at right angles (orthogonal); this throws most of operations into the waste category. See value stream mapping for a further explanation.
* Overproduction happens each time you engage more resources than needed to deliver to your customer. For instance, large batch production, because of long changeover time, exceeds the strict quantity ordered by the customer. For productivity improvement, operators are required to produce more than the customer needs. Extra parts will be stored and not sold. Overproduction is a critical muda because it hides or generates all others, especially inventory. Overproduction increases the amount of space needed for storing raw material as well as finished goods. It also requires a preservation system.
* Inventory, be it in the form of raw materials, work-in-process (WIP), or finished goods, represents a capital outlay that has not yet produced an income either by the producer or for the consumer. Any of these three items not being actively processed to add value is waste.
* Whenever defects occur, extra costs are incurred reworking the part, rescheduling production, etc. Defects cause scrap, repair, rework, backflow, and warranty/replacements; consume resources for inspection, correction, and replacement; cause opportunity loss (capacity and resources used to fix problems); cost 5% of sales for Six Sigma and 40% of sales for One Sigma processes; and reduce variability, lock gains, implement controls, and error proofing.
* Having a direct impact to the bottom line, quality defects resulting in rework or scrap are a tremendous cost to most organizations. Associated costs include quarantining inventory, re-inspecting, rescheduling, and capacity loss. In many organizations the total cost of defects is often a significant percentage of total manufacturing cost. Through employee involvement and continuous process improvement (CPI), there is a huge opportunity to reduce defects at many facilities. In the latest edition of the Lean Manufacturing classic Lean Thinking, underutilization of employees has been added as an eighth waste to Ohno’s original seven wastes. Organizations employ their staff for their nimble fingers and strong muscles but forget they come to work every day with a free brain. It is only by capitalizing on employees’ creativity that organizations can eliminate the other seven wastes and continuously improve their performance. Many changes over recent years have driven organizations to become world-class organizations or Lean enterprises. The first step in achieving that goal is to identify and attack the nine wastes. As many world-class organizations have come to realize, customers will pay for value-added work, but will never knowingly or willingly pay for waste.
* This waste is related to ergonomics and is seen in all instances of bending, stretching, walking, lifting, and reaching. These are also health and safety issues, which in today’s litigious society are becoming more of a problem for organizations. Jobs with excessive motion should be analyzed and redesigned for improvement with the involvement of plant personnel.
* Transporting product between processes is a cost incursion that adds no value to the product. Excessive movement and handling cause damage and are an opportunity for quality to deteriorate. Material handlers must be used to transport the materials, resulting in another organizational cost that adds no customer value. Transportation can be difficult to reduce due to the perceived costs of moving equipment and processes closer together. Furthermore, it is often hard to determine which processes should be next to each other. Mapping product flows can make this easier to visualize.
* M. L. Emiliani, “Lean Behaviors,” Management Decision 36/9 (1998) 615–631.