5
INTANGIBLE ASSETS, BRANDS, AND SHAREHOLDER RETURNS
The failure of the accounting system to reflect the value of these [intangible] assets in financial reports, to properly account for their impact on firms' operations, and to provide investors with information about the exposure of these assets to threats of infringement and disruption, is a major cause of accounting's relevance lost. How ironic (or sad) that largely irrelevant assets to companies' growth and competitive edge—like inventory, accounts receivable, or plant and machinery—remain prominently displayed on corporate balance sheets, whereas patents, brands, IT, or unique business processes are accounting MIAs.
—Baruch Lev and Feng Gu1
Brands build resonance through a hierarchy of meaning that roughly parallels Maslow's hierarchy of needs: functional, emotional, social, and cultural. Unless a brand can ensure that it is conveying the lower levels of meaning, it will fail to achieve the higher levels.… If a brand is intended to create sustainable competitive advantage, then that brand had better be well differentiated.… Think about the brands that are typically cited by marketers as the ones they admire: Apple, Virgin, Facebook, Disney, Coke, Audi, Jack Daniel's. These brands are all well differentiated; they set the trends for their category or transcend it, and they act differently and stand out from the competition.
—Nigel Hollis2
This chapter extends the life-cycle framework to provide a logical and intuitive understanding of the relationship between shareholder returns (see Figure 5.1) and the market over the long term. However, a prerequisite to analyzing shareholder returns in today's New Economy is an insightful understanding of connectivity-enabled innovation, networks, platforms, and the increased importance of intangible assets (e.g., brands).
When expenditures are incurred that yield benefits beyond the accounting period being measured, these outlays represent intangible assets. Examples include expenditures for R&D, building a brand, supply chain software, customer recommendation algorithms used by Amazon and Netflix, expansion of lean manufacturing expertise, platforms that greatly expand their value as more users join, and much more. The measurement challenge is in estimating the useful life over which benefits accrue from the intangible expenditure.
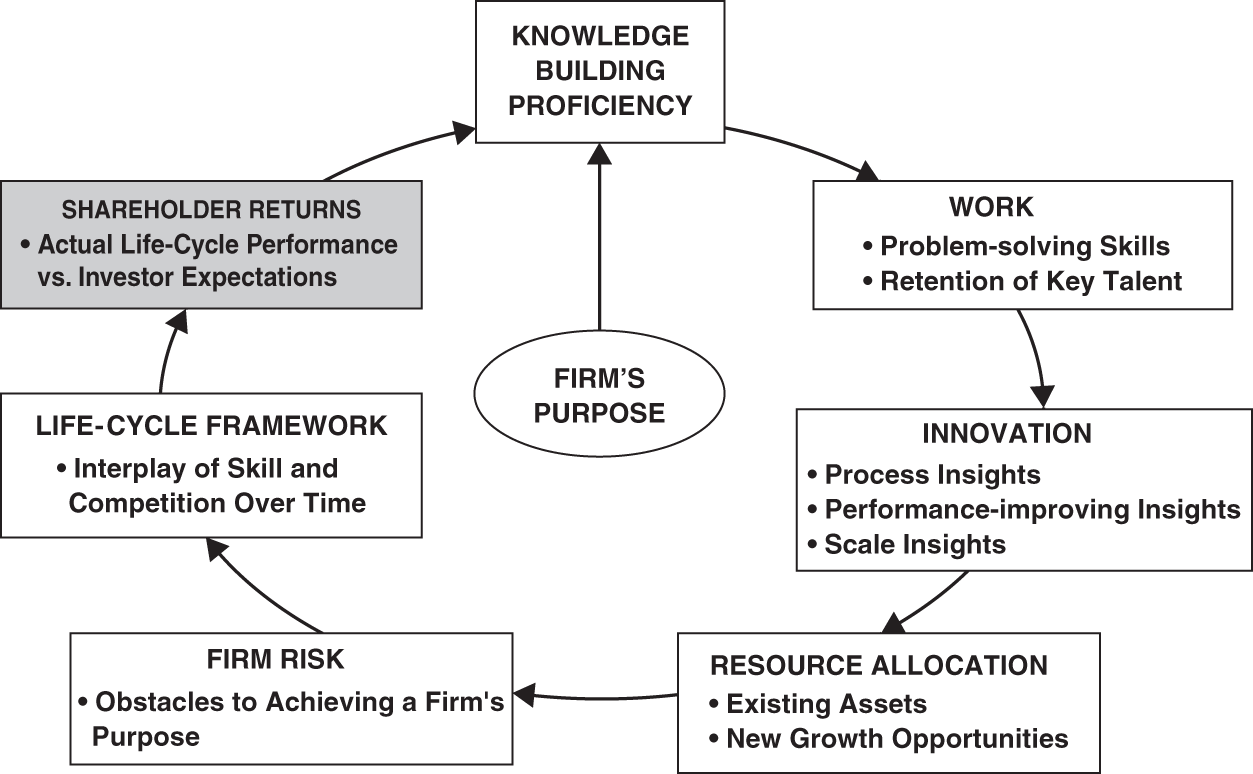
FIGURE 5.1 Shareholder returns
Intangibles play an important role in the generation of a firm's life-cycle performance. When the actual life-cycle performance is significantly higher (lower) than investor expectations, the result is excess positive (negative) shareholder returns as noted in Figure 5.1.
THE NEW ECONOMY AND CONNECTIVITY-ENABLED BUSINESS MODELS
We begin by focusing on what is fundamentally the same principle for economic growth in the New Economy as it was in the Old Economy: value creation depends upon the quality of ideas. Investing in noninnovative ways, such as building more horse-drawn carriages, did little to improve the standard of living and job creation compared to the development of the automobile. Another example is building houses with electricity, lights, heating and air conditioning compared to building houses containing nothing more than a roof, walls, and a fireplace. In both instances, the builders committed resources that might have alternatively been used for immediate consumption and instead made a capital investment in order to receive greater benefits in the future. But the quality of the ideas incorporated in the modern house is the critical difference that spurs innovation-induced economic growth and a rising standard of living. This resonates with this book's theme that a firm's knowledge-building proficiency—its competency in generating high-quality ideas of practical use in creating value—is the dominant determinant of its long-term survival and prosperity.
Economists and accountants would conclude that a capital asset was created with both the primitive house and the modern house. On one hand, it is easy to visualize the important ideas incorporated in the modern house. On the other hand, the primitive house also incorporated important ideas about transforming trees into usable lumber and creating and using nails and hammers in order to build a structure that offers shelter. This way of looking at investment suggests that, fundamentally, capital is embedded ideas. Ideas are no less important in the Old Economy as the New Economy.
Accountants calculate balance sheets and income statements using rules to compute assets and then deduct liabilities to determine what remains for the firm's capital owners (debt and equity). In the Old Economy ideas principally were used to create tangible assets such as oil reserves (note that ideas for internal combustion engines enabled oil reserves to become valuable), machinery and related equipment in factories, and so on. These assets had verifiable useful lives and the accountants could deduct depreciation expenses on the income statement and directly compute net assets (net of accumulated depreciation) on the balance sheet. The accounting objective is to match revenues with related expenses over time, yielding a reliable measure of earnings and assets. In the Old Economy most assets were tangible with verifiable useful lives and could be depreciated accordingly. But in the New Economy, mostly intangible assets are critical for value creation and, as previously noted, estimated useful lives for these intangibles are exceedingly difficult to estimate. The result is big problems not only for the accounting rule-makers who require verifiable data, but also for managers and investors who use accounting data for decision-making.
The above discussion on the fundamental role of ideas in economic growth connects to Paul Romer's thinking highlighted in Chapter 1. Romer points out that physical stuff is limited but ideas are limitless and most (nonpatented) ideas can be distributed at essentially zero cost, which is not fully appreciated by neoclassical economics. Sharing ideas is an important part of the New Economy. In addition, the Internet and related connectivity technology offer new opportunities to create value which were unavailable in the Old (pre-Internet) Economy. Some of these opportunities disrupt Old Economy firms and create substantial market value for the disruptor firms accompanied by shareholder returns that greatly exceed the general market.
A particularly important way to create significant value in the New Economy is winning the competitive battle to secure a dominant platform that efficiently makes connections that were previously either unavailable or expensive in time and money. Internet search via Google's search engine (platform) connects the users with information. Ebay's platform connects buyers and sellers. Amazon's platform connects consumers to products that previously required visits to physical stores.
Platforms facilitate network connections. The two primary network effects are: (1) incremental benefit to existing users for each new user joining the network, and (2) diminishing marginal costs to serve new customers. In contrast to a linear business model (i.e., one where a linear supply chain is used), a successful platform/network business scales more efficiently since revenues can rise faster than costs for an extended time period.
When a linear business gains a customer, it adds only one new relationship—one buyer of products or services. When a platform adds a new user, that person doesn't add just a single relationship but rather a potential relationship with all of the platform's users. In other words, platforms grow exponentially rather than linearly. As a result, platform business models are far more cost-effective and higher scale than the old, linear models they are replacing … it's still possible to build a valuable linear business, but its competitive advantage often evaporates quickly as products get commoditized and competitors copy features—leaving the originator continually scrambling to replace those strengths. Features are easy to emulate; networks aren't. Products get commoditized, platforms don't.3
In the Old Economy, firms created the most value by controlling physical resources and/or supply chains with factories that made products that were then distributed to other firms that sold to the end customers. Leading Old Economy firms scaled physical assets to gain efficiency and market share. In the New Economy, leading firms scale up their platforms by connecting more and more users.
For instance, the value of Facebook's platform to its users increases exponentially as the number of Facebook users increase. The more drivers who sign up with Uber, the more valuable its platform is to consumers needing to connect with a driver. Uber's efficiency relates to its avoidance of owning tangible assets, since drivers own their vehicles. The market value of Uber depends upon satisfying customers in need of a ride, that is, scaling up both its drivers and the consumers who automatically use the Uber driver app on their cellphones. More and more firms create value, like Uber, through their intangible assets.
EMPIRICAL EVIDENCE ABOUT INTANGIBLE ASSETS
There is less uncertainty about achieving benefits over the economic life of tangible assets such as machinery. However, intangible assets typically involve considerable uncertainty as to both the magnitude and duration (life) of future benefits. The DNA of accounting rule-makers compels them to require verifiable amounts on accounting statements, which helps to explain the exceptionally slow pace of adoption of rules to capitalize and amortize intangibles.
In the United States, the Financial Accounting Standards Board (FASB) ruled that technologically proven software development costs should be capitalized. Interestingly, acquired R&D (verified transaction) becomes an intangible asset recorded on the balance sheet; yet, similar internally developed R&D must be expensed. Outside the United States, the International Accounting Standards Board (IASB) controls the IFRS (International Financial Reporting Standards) standards which currently allow capitalization of the “D” part of R&D expenditures given certain conditions (IAS 38).
It is informative to briefly summarize empirical research about the importance of intangibles for the firm's financial performance and valuation. The bottom line is that a compelling logical rationale exists for capitalizing and amortizing these expenditures when the assigned economic lives are defensible. Decades of empirical studies (briefly summarized below) conclude that future benefits accrue from expenditures for intangibles and that the stock market rewards these types of investments. Of considerable importance to investors analyzing a firm's track record of financial performance is that full expensing for firms with substantial expenditures for intangibles yields return-on-capital metrics that are biased in complex ways.4 (This is why R&D is capitalized for the calculation of CFROIs, as noted in Chapter 4.) In addition to capitalization and amortization of intangibles, valuable information can be presented by management via supplementary disclosure; for example, information about the potential scalability of a firm's intangible assets is critical for investors analyzing the risk and reward from investing in intangibles-intensive firms.
Academic research has documented the economically consequential link between profitability and market valuation with intangible assets.5 Early academic research found that
brands impact a firm's market value; R&D, and patents in particular, are useful predictors of future shareholder returns; asymmetric knowledge (insiders versus outside investors) about a firm's intangibles leads to substantial insider trading profits and higher costs of capital (all else equal, higher bid-ask spreads for trading stocks) for intangibles-intensive firms.6
Reviewing empirical studies on intangibles leaves the distinct impression that the researchers are formulating hypotheses that logically mirror common sense. For example, especially large increases in R&D expenditures subsequently tended to lead to profitability gains and positive above-market returns to shareholders.7 Organizational (intangible) capital developed by talented employees tends to be reflected in efficient business processes and is associated with significant excess shareholder returns.8
As to employee satisfaction, management can expect to retain key employees when they work in a culture that supports win-win partnerships enabling employees to directly connect their efforts to deliver value to customers and to making the world a better place. With such a culture, job satisfaction can offer more motivation than monetary compensation. Using a large-scale proprietary database of employees' compensation and employment duration at specific firms, research has shown that when “pivotal” employees (measured by percentage pay progression) leave firms at a fast pace, a firm's CFROIs (cash-flow-return-on-investment) subsequently decline, whereas high retention rates of pivotal employees subsequently led to higher CFROIs.9 Talented employees are an exceedingly important intangible asset.10
Intangibles research clarifies stock market valuations for many types of firms. The high market-to-book ratios of firms in the wireless communications industry are influenced by advertising and especially radio spectrum licenses (intangible asset).11 Consider firms with large information technology (IT) outlays. The performance of these IT-intensive firms was impacted by the degree of alignment between IT outlays and IT capabilities.12 In addition, explanatory details about the customer base for subscription-based firms helps explain market valuations.13
Outside of R&D expenditures, the main source of investments in intangible assets is specific components to a firm's selling, general, and administrative (SG&A) expenditures. The predictability of future earnings and shareholder returns is improved by dissecting SG&A expenditures into pure operating expenses versus outlays for intangibles.14 Interestingly, after management received long-term equity incentives, increases soon followed in those SG&A components tied to future economic benefits.15
An important conclusion from this summary of intangibles empirical research is that in the New Economy, competitive advantage, and excess shareholder returns depend on hard-to-duplicate intangible assets. One example of a hard-to-duplicate, and highly valuable, intangible asset is a firm's unique brand that ideally makes an emotional connection with consumers.
BRANDS IMPACT A FIRM'S MARKET VALUE
Research on brands ranges from exploring a conviction that brands are best viewed as existing in the minds of consumers to explicit quantitative estimates of point-in-time values for brands. As an example, Starbucks sold to Nestle the right to use the Starbucks name on Nestle coffee products for $7 billion, which strongly suggests that the Starbucks brand is a uniquely valuable asset owned by Starbucks. To be sure, a brand does not have the easily measured value of cash on the balance sheet. However, a brand value is assigned when a firm acquires a brand as part of an acquisition. Nevertheless, accounting rules currently prohibit internally developed brands from being recorded as intangible assets thereby distorting the cross-comparison of performance metrics that use as-reported balance sheets of firms with significant brands.
On February 22, 2019, Kraft Heinz's stock price dropped 27% as investors reacted to management's lowering of expectations of future earnings, and especially, the news that the firm incurred a $15 billion goodwill impairment charge related to the perceived values of Kraft and Oscar Mayer brands. Noteworthy, Kraft Heinz management had been significantly reducing investment outlays for its brands while consumers were moving away from highly processed products and toward fresh food. Brands impact a firm's market value. Brands are important intangible assets.
What is a brand? A brand consists of one or more assumptions held by consumers about the rewards from buying the product. The stronger the assumptions and the higher the anticipated rewards, the more valuable is the brand. Consumer assumptions influence how the product is perceived by consumers and the premium they are willing to pay. With the most valuable brands, consumers emotionally bond with the product, believing that it excels in delivering what is important to them. Noteworthy was Frank Sinatra's instructions to be buried with a bottle of Jack Daniel's whiskey. Brown-Forman, the firm that owns the Jack Daniel's brand, subsequently created a new whiskey, Sinatra Select. Brown-Forman management has successfully spread its brand message—“Charcoal mellowed. Drop by drop.” They have nurtured a wide consumer franchise from bankers to bikers, affirmed in a notable advertisement: “Jack Daniel's—served in fine establishments and questionable joints.”
The energy drink Red Bull was launched in 1987 and targeted consumers who needed an energy pickup to stay sharp and on task. The Austrian firm Red Bull GmbH pioneered the energy drink market and built the brand by linking Red Bull to extreme sports that require high energy and a sharp mind. The brand slogan is: “Red Bull gives you wings.” This product illustrates a hugely successful marketing innovation focused on building an enduring connection (a bond) with highly specific consumers across countries and cultures.
You cannot create passion by appealing to all people equally. If you stand for something, some people will love you and some will hate you, but the ones who love you will buy your brand and pay a premium for it. This no-compromise attitude extends to the Red Bull business model. Their focus is single-minded: no diversification, no licensing, no brand merchandising, and no umbrella branding. How many brands can you think of that lost their way by trying to spread beyond their core positioning and target group? I suspect Red Bull is one of the very few not to try.16
Building a stellar brand name such as Jack Daniel's or Red Bull entails much more than simply a recognizable name. Who gets inspired by Yahoo or General Motors?
But at one time, countless American consumers aspired to be part of the GM family and work their way up the ladder of GM brand choices, starting with the value-conscious Chevrolet, the higher quality Oldsmobile, and on to the luxurious Cadillac and its image of well-heeled prosperity. Clearly, maintaining a brand is just as difficult as building one. A reasonable question now is: What do these GM brands stand for in the eyes of consumers?
On one hand, when firms with highly valued brands miss a major technological change, their brands can easily lose their emotional connection to consumers. Blockbuster, BlackBerry, and Kodak are prime examples. On the other hand, when a firm originates a new experience that clearly fulfills consumer needs, it has an opportunity to create a brand that suggests this firm “owns this space.” Such an opportunity was seized by Peloton Interactive, the home exercise equipment firm that brought consumers a digitally connected stationary bike. Their brand name cleverly refers to those cyclists at the front of the pack known as “peloton.” Users of Peloton bikes are digitally connected to a “virtual pack” and the brand name resonates with the community experience of riding (and competing) with other cyclists, not just solo exercising.
Brands and R&D have similar measurement challenges given their characteristics as intangible assets. Recall in Chapter 4 the emphasis on the importance of capitalization and amortization of R&D for R&D-intensive firms (e.g., biopharmaceutical firms). Capitalization of R&D is needed to improve one's understanding of a firm's track record, specifically its economic returns, which become biased in complex ways when substantial investments in intangible assets are ignored. In addition, past reinvestment rates (asset growth rates) are misleading when calculated using unadjusted accounting data.
There is considerable current interest in the inclusion of brand “values” on balance sheets. This is partly due to the recognizable impact of brands on a firm's market value. But note that brands are an integral part of a business system that generates future cash flows. An explicit estimate of a brand value can falsely imply a stand-alone value that can be monetized independently of the firm currently using the brand. For example, all else equal, a firm with highly skilled management will utilize a brand better than a much-less-skilled management and generate higher future cash flows. Nevertheless, supplementary information about brands can help investors make long-term forecasts of the firm as a total system in order to calculate warranted valuations.
Consider the ubiquitous automobile brand Chrysler. Daimler-Benz and Chrysler managements announced a “merger of equals” in 1998, although in reality Daimler-Benz actually acquired Chrysler and controlled the new firm. This combination proved to be a financial disaster and illustrates the lack of skill by Daimler-Benz management in both planning and execution. They failed to effectively use the Chrysler brand and sold Chrysler in 2007.
The next section provides a conceptual roadmap for handling intangible assets such as brands, which benefit over time from outlays that are expensed even though they yield future benefits.
A CONCEPTUAL ROADMAP FOR HANDLING INTANGIBLE ASSETS
There is substantial ongoing intellectual effort focused on intangibles in general, and R&D and brands in particular. Nevertheless, after decades of research documenting the value-relevancy of intangibles, very little has been accomplished by way of useful accounting rules. In fact, the FASB's rule that mandated expensing of R&D was shown to negatively impact market valuations of R&D intensive firms.17 It is time for the accounting rule-makers to think differently and adopt a more holistic perspective. Let's begin with what different constituents (i.e., accounting rule-makers, management, and investors) ideally want.
The primary objectives of accounting rule-makers are:
- Match revenues with expenses so that “true” earnings can be calculated.
- Provide useful and reliable information to users of accounting statements.
Managements seeking to optimize long-term value creation should want to:
- Avoid business-as-usual, automatic funding of business units and related projects and be vigilant for the need to adapt to a changing environment in order to at least earn the cost of capital over the long term.
- Improve decision making by adjusting, as needed, accounting-based performance metrics to reflect the economic reality of long-term benefits from R&D expenditures and selected selling, general, and administrative (SG&A) expenditures.
- Disproportionately direct investment outlays to the most compelling value-creation opportunities.
The primary objectives of knowledgeable investors, including active (as opposed to passive index investors) money managers, are:
- For a firm of interest, articulate a range of plausible forecasts of future performance that links to valuation (e.g., optimistic, most likely, and pessimistic).
- Compare these forecasts to market expectations implied in a firm's current stock price.
- Evaluate a firm's upside potential and the downside risk in order to make buy/hold/sell decisions.
While the above objectives may seem highly attuned to the specific needs of each constituent, there are five principles that can be applied to the mutual benefit of rule-makers, managements, and investors:
- A firm's key financial performance metric is its ROI (return-on-investment) versus the cost of capital.
- An ROI compares what is given up (the historical cost of resources consumed) to what is received (cash inflows).
- The historical cost of assets should be preserved on a firm's balance sheet.
- An asset's (e.g., a brand's) estimated market value or relevant data for estimating an asset's contribution to future cash flows should be supplementary disclosure that complements the historical-cost-based balance sheets.
- For practical purposes, the usefulness of accounting data depends upon how well it assists analyzing the warranted value of a firm or a business unit. This necessarily involves a valuation model and a related track record.
The above five principles are offered as a beginning point in developing a conceptual roadmap for intangibles. Furthermore, we should constructively challenge two subtle assumptions that rarely are questioned. First is that intangibles are an accounting problem and the complete solution needs to be provided by the accounting rule-makers. Actually, it is a problem involving accounting and valuation, which are inextricably connected. Second is the assumption that the handling of intangibles should be strictly guided by the goal of true earnings wherein revenues match expenses. Adherence to true earnings as the ultimate goal constricts the array of other mechanisms for handling intangibles, such as adjustments to forecast fade rates.
Before delving into discussing a way forward, let's look at the past and understand why so little has been accomplished for handling intangibles. Baruch Lev and his coauthors have published a large number of empirical studies that yield genuine insights about intangibles. He makes the following astute observations:
I believe that the major obstacle for an accounting-for-intangibles change is the absence of change-incentives of the two major accounting constituents, or “influencers”: corporate managers and public accountants.… My sense is that executives' opposition to intangibles' capitalization reflects their reluctance to present on the balance sheet assets (capitalized intangibles) whose value can be impaired, or even vanish when disrupted by new technologies. Investors' consequent questions about why the intangibles were not properly protected against disruption, or even why the investments were made in the first place will surely be embarrassing. Better, from managers' perspective, to expense all intangibles immediately, thereby leaving no trace of them in the financial reports.… Public accountants too seem unenthusiastic about changing the accounting for intangibles.… With intangibles' capitalization, auditors will have to periodically assess the viability of the capitalized intangibles and whether they were impaired, thereby enhancing their responsibility for these hard-to-value assets. Why create additional liability concerns?18
The above reality check suggests that supplementary disclosure will likely play an important role in the future regarding more extensive handling of intangibles.
It is worthwhile to review an episode of the rule-makers, in this case the U.S. Securities and Exchange Commission (SEC), aggressively implementing rules to compel management to report more “relevant” information. During the high-inflation environment of the 1970s, the SEC mandated that 1,000 of the largest U.S. firms estimate how much it would cost to replace their assets, and then compute depreciation charges based on replacement cost. The logic was that this would be more informative to investors than historical cost accounting. This proved to be a hugely expensive mistake. Why?
Returning to the life-cycle valuation model reviewed in Chapter 4, the value of the firm is comprised of the value of its existing assets and its future investments. Management should seek the best opportunities for future investments, which may or may not be reinvestment in existing assets. Neglecting this management guidepost leads one to conclude that depreciation charges are automatically reinvested in order to maintain the firm as a “going concern.” With this view, it seemed logical to the SEC that the high-inflation environment necessitated depreciation charges to be estimated based on higher replacement cost.
The SEC made two major mistakes. One concerns economic performance measurement and the other concerns valuation. First, from the investors' perspective the “real” or inflation-adjusted economic return of an investment uses cash outflows and cash inflows that actually occurred, and adjusts them into units of constant purchasing power via the GDP Deflator. Estimated replacement costs are unnecessary. Second, knowledgeable investors forecast future net cash receipts, and many are assisted by using life-cycle-based forecasts of economic returns and reinvestment rates. Such forecasts should anticipate how management will adapt to change, including the pernicious effects of inflation. The role of accounting data is to provide useful information and not to make assumptions about management's future investment decisions. For example, with the accelerating use of battery-powered electric vehicles today, is it not misleading to assume gas stations will be replaced in their current configuration. The key point is that the strict adherence to a notion of “true earnings” blinds accounting rule-makers from developing a holistic perspective that would include the role of investors in forecasting future cash flows.
A holistic or systems perspective suggests that the preferred way forward will involve experimentation and learning that should be facilitated by, and also inform, the accounting rule-makers. Figure 5.2 outlines an evolutionary path that exploits the usefulness of experimentation and feedback. This process returns full circle to the knowledge-building loop of Figure 2.1, which is central to every chapter in this book.
As shown in Figure 5.2, SG&A and R&D expenditures that qualify as intangible assets should be classified into two groups. The first group includes expenditures that involve economic lives that can reasonably be estimated and these expenditures should be capitalized. Such intangibles confer ownership rights to the firm and are expected to generate future benefits. Consequently, their estimated economic lives can be defended as reasonable attempts to add relevance to the accounting data. Their capitalization and amortization would incorporate management's intimate knowledge of these assets, leading to more accurate calculations of earnings, economic returns, and reinvestment rates. The second group includes the remaining expenditures that would not be capitalized but rather expensed. Both groups of intangibles warrant supplementary disclosure that assists investors in analyzing firms' track records and making forecasts that help to quantify the value effect from scenarios ranging from optimistic and most likely to pessimistic. Importantly, investors could experiment with capitalization and also adjust their long-term fade forecasts of economic returns and reinvestment rates to incorporate their overall assessment of a firm's prospects, including its intangible assets such as brands. Figure 5.3 highlights this process. This notion of investor experimentation is not an abstract idea. Rather, professional money management organizations, including those that subscribe to the Credit Suisse HOLT global database that provides the data for the life-cycle track records in this book, are well equipped to both experiment with capitalization and related economic life assumptions and translate their research analyses into fade forecasts for firms. Increased supplementary disclosure would further boost such efforts.

FIGURE 5.2 An evolutionary path for quantifying the value of intangibles

FIGURE 5.3 Intangible assets and fade rates
The benefits of experimentation for handling intangibles extend to management. The next section describes how this can be accomplished.
INTEGRATED REPORTS, LIFE-CYCLE REVIEWS, AND INTANGIBLES
There is an accelerating trend for firms to publish Integrated Reports that recognize that, over the long term, shareholder interests should be aligned with other stakeholders. This is consistent with the four-part definition of the purpose of the firm discussed in Chapter 1. “Integrated Reports,” as explained by Robert Eccles and Michael Krzus:
is, at its core, a social movement. When put into practice by companies and used by the audience of report consumers, it can transform the way resource allocation decisions are made inside companies and markets across the globe. Its social goal is to use corporate reporting as a means to influence companies and investors such that they incorporate the consequences of the positive and negative externalities of corporate decisions (most typically referred to as “sustainability” regarding social and environmental issues) and the increasing importance of intangible assets.… The litmus test for both advocates and skeptics is whether integrated reporting leads to better corporate performance through integrated thinking, all of which should be ultimately reflected in a company's stock price.19 (italics added)
Integrated Reports focus attention on a holistic view of organizations that includes social and environmental issues. Referring to the four-part purpose again, recall how it emphasizes that nothing works long term if a firm consistently fails to earn its cost of capital. Said differently, a firm with high marks for social and environmental issues that fails to earn the cost of capital is unsustainable. As reviewed in Chapter 1, a sustainable firm fulfills its four-part purpose: (1) a vision to make the world a better place, (2) survive and prosper through continual gains in efficiency and innovation, (3) sustain win-win relationships with all of the firm's stakeholders, and (4) take care of future generations. Sustainability is rooted in achieving a sound and inspiring purpose that creates genuine value.
As to the practical tasks of value creation, it is imperative for management and the board of directors to widely implement a common valuation language that is focused on return on investment and the cost of capital, that is, long-term value creation, and explicitly apply value-creation thinking to the firm's business units. A systematic application of this value-creation language could take the form of a Life-Cycle Review focused on a firm's business units.20 Life-Cycle Reviews would improve resource allocation decisions and help management engage in a dialogue with the very investors they would want in their shareholder base—highly knowledgeable investors seeking to own firms for the long term.
A Life-Cycle Review focuses on the firm as a whole plus its individual business units and has three components. It details past life-cycle track records; highlights key value-creation issues; and guides strategic resource allocation decisions. Some have voiced concern that the life-cycle track records for business units would reveal too much information that could be useful to a firm's competitors. On the other hand, the comprehensiveness, transparency, and rigor of the information is well suited to transitioning investor communications away from short-term myopia to long-term fundamentals. A decision to not publicly display perceived sensitive information should not deter managements and boards from internal use and gaining insights not otherwise available. The three components are described below.
- Value-relevant track records. Management would display the top two panels of life-cycle charts (e.g., Figures 4.4 and 4.5)—economic returns versus cost of capital and reinvestment rates—for their firm and individual business units. The necessary calculations involve a tradeoff between accuracy and simplicity, such as how R&D is capitalized and amortized. Reinvestment rates should be decomposed into organic growth and the growth impact of any acquisitions or divestitures.
- Strategy and reinvestment. In the context of a business unit's track record of economic returns in relation to the cost of capital and its reinvestment rates, management's strategy is explained. By positioning a business at a point in time in its life-cycle, relevant issues are raised. For example, there is a compelling strategic logic for mature business units that have steadfastly been earning approximately the cost of capital to raise their economic returns instead of chasing asset growth. This is especially true for an ongoing business unit (not a startup) that has been unable to earn the cost of capital.
- Intangibles. Management provides an overview of how intangible assets are used to improve long-term financial performance. This overview represents work-in-progress and a learning experience for those who prepare the adjusted data to better measure economic returns and reinvestment rates, and for those who use the information for their own analysis. Chief financial officers and their staffs would play a vital role in leading this learning experience. They probably would be much more enthused about participating in this innovative and highly useful work versus providing voluminous 10-K data that few investors find useful or even read.
In addition to improving decision making inside the firm there are three other reasons for implementation of Life-Cycle Reviews. First, their preparation enables management to gain deep knowledge about the most useful information to include in the Supplementary Disclosure section of their annual report. Second, Life-Cycle Reviews provide insights for connecting financial performance to the broader stakeholder concerns addressed by Integrated Reports.
Third, consider the following thought experiment. You won a prize that entitled you to select one stock from a group of stocks about which you have very limited information. The prize is $50,000 worth of shares of stock in one of the firms in the group, and you must hold that stock for a minimum of five years. The information you receive is that all firms are in the same industry and have been in business for at least twenty years. In addition, the CEO of every firm will soon announce that a major investment initiative has begun that will depress near-term quarterly earnings, although management forecasts significant long-term value creation.
You must specify one criterion to be applied to all firms in the group and this will determine which stock you own. In all likelihood you give serious thought to what is the most important characteristic of a firm that is straightforward to measure; is highly predictive of success in the future; and can potentially convince investors not to sell their shares due to management's purposeful depressing of near-term quarterly earnings. A reader of this book who embraces its ideas would likely choose this criterion: “Demonstrated long-term track record of significant value creation by management.”
Put differently, management needs to earn the right to reduce quarterly earnings in order to make large investments. In Chapter 4 we noted that Jeff Bezos, Amazon's CEO, has repeatedly made large investments that, on average, proved exceedingly rewarding to patient shareholders. To no surprise, in the past Amazon's stock price has risen in the face of quarterly “shortfalls” that were part of big investment outlays. One reason for writing this book is to support the transition for publicly traded firms to minimize quarterly report myopia and manage for long-term value creation, similar to how highly successful, privately held firms are managed. In summary, Life-Cycle Reviews can advance value creation by putting planned future investments in the context of past results.
The next three sections analyze value creation via the long-term histories of three companies with exceptionally well-known brands.
EXPECT MORE THAN COFFEE—STARBUCKS
Innovative business models do not require a revolutionary idea new to humankind. Rather, one can make observations and new connections that lead to genuine value creation, such as when Howard Schultz observed the intense relationship that Italians had with drinking their coffee at neighborhood coffee bars. He intuitively knew that this social type of coffee drinking could flourish in the United States. That was 1983. Schultz became CEO of Starbucks in 1987, and today the company has over 30,000 worldwide stores.
Schultz orchestrated an authentic win-win relationship with employees and an emotional connection with customers resulting in the uniquely valuable Starbucks brand. The life-cycle track record in Figure 5.4 attests to a superior-performing company that was built over decades outperforming the S&P 500 more than 10-fold (see lower panel of Figure 5.4) from 1992 to 2018. CFROIs were depressed in the early years due to an exceptionally rapid expansion of stores.
As to the culture driving this performance, Schultz noted:
But the story of Starbucks is not just a record of growth and success.… It's living proof that a company can lead with its heart and nurture its soul and still make money. It shows that a company can provide long-term value for shareholders without sacrificing its core belief in treating its employees with respect and dignity, both because we have a team of leaders who believe it's right and because it's the best way to do business.
… a comprehensive health-care program, even for part-timers, and stock options that provide ownership for everyone. We treat warehouse workers and entry-level retail people with the kind of respect most companies show for only high executives.
If people relate to the company they work for, if they form an emotional tie to it and buy into its dreams, they will pour their heart into making it better. When employees have self-esteem and self-respect they can contribute so much more to their company, to their family, to the world.21

FIGURE 5.4 Starbucks 1992 to 2018
Source: Based on data from Credit Suisse HOLT global database.
Schultz relinquished the CEO reins in 2000 and became Starbucks chairman focusing on global strategy and expansion. Large-scale store expansion (see middle panel of Figure 5.4) was a top priority, which, however, resulted in operating problems culminating in a sharp drop in profits in 2008. Keep in mind that the natural tendency for companies with substantial growth for decades, and becoming large organizations, is to encounter heightened competition which hastens the transition into the mature life-cycle stage. To avoid this competitive decline, Schultz returned as CEO in 2008 intent on reigniting the emotional connection to consumers in order to improve profitability. Schultz penned a memo that reflected a hard-nosed reality check (feedback) about the business situation:
Over the past 10 years, in order to achieve the growth, development and scale necessary to go from less than 1,000 stores to 13,000 stores and beyond, we have had to make a series of decisions that, in retrospect, have led to the watering down of the Starbucks Experience, and what some might call the commoditization of our brand.
Many of these decisions were probably right at the time, and on their own merit would not have created the dilution of the experience; but in this case, the sum is much greater and, unfortunately, much more damaging than the individual pieces.22
The renewal of Starbucks was successful as depicted in the rising CFROIs (top panel Figure 5.4) well in excess of the cost of capital.
COSTCO STARTS BY CARING FOR ITS EMPLOYEES
A firm admired for consistent superior financial performance in the retail industry is Costco. Similar to Starbuck's recent performance, Costco has delivered sustained CFROIs well in excess of the cost of capital. It is a multinational corporation operating membership-only warehouse clubs with a well-deserved reputation for selling quality merchandise at low prices. Large-scale efficiency is the hallmark of Costco.
Notably, Costco employees are much higher compensated (salary and benefits) compared to competitors, such as Walmart's Sam's Club. Unsurprisingly, the annual turnover of Costco's highly motivated employees is a fraction of the turnover of its competitors. James Sinegal, Costco's cofounder and CEO from 1983 to 2011, explains:
Paying your employees well is not only the right thing to do but it makes for good business. In the final analysis, you get what you pay for. Paying rock-bottom wages is wrong.… It doesn't keep employees happy. It keeps them looking for other jobs. Plus, managers spend all their time hiring replacements rather than running your business.… When employees are happy, they are your very best ambassadors.… If we take care of the business and keep our eye on the goal line, the stock price will take care of itself.23
Costco's life-cycle track record in Figure 5.5 shows sustained value-creating CFROIs with recent asset growth slowing as the firm grows larger. Although, as I write this chapter, Costco's first store opened in China, and the stampede of new Chinese Costco members forced the store to close early on opening day.
At times, analysts have criticized Costco's generous (by industry standards) employee compensation packages. Sinegal responds:
You have to take the shit with the sugar, I guess. We think when you take care of your customer and your employees, your shareholders are going to be rewarded in the long run. And I'm one of them [the shareholders]; I care about the stock price. But we're not going to do something for the sake of one quarter that's going to destroy the fabric of the company and what we stand for.24
A Costco warehouse has a limited selection of about 4,000 items with about 75% being consumer staples and the remainder special items which frequently change and add adventure to a Costco shopping experience. In addition, Costco's Kirkland Signature brand covers a wide range of products from nuts to dress shirts to golf balls. The common denominator is high quality at a price significantly lower than competing brands. To sum up, this is a formidable business model which is exceedingly difficult to compete against due to Costco's scale advantages.
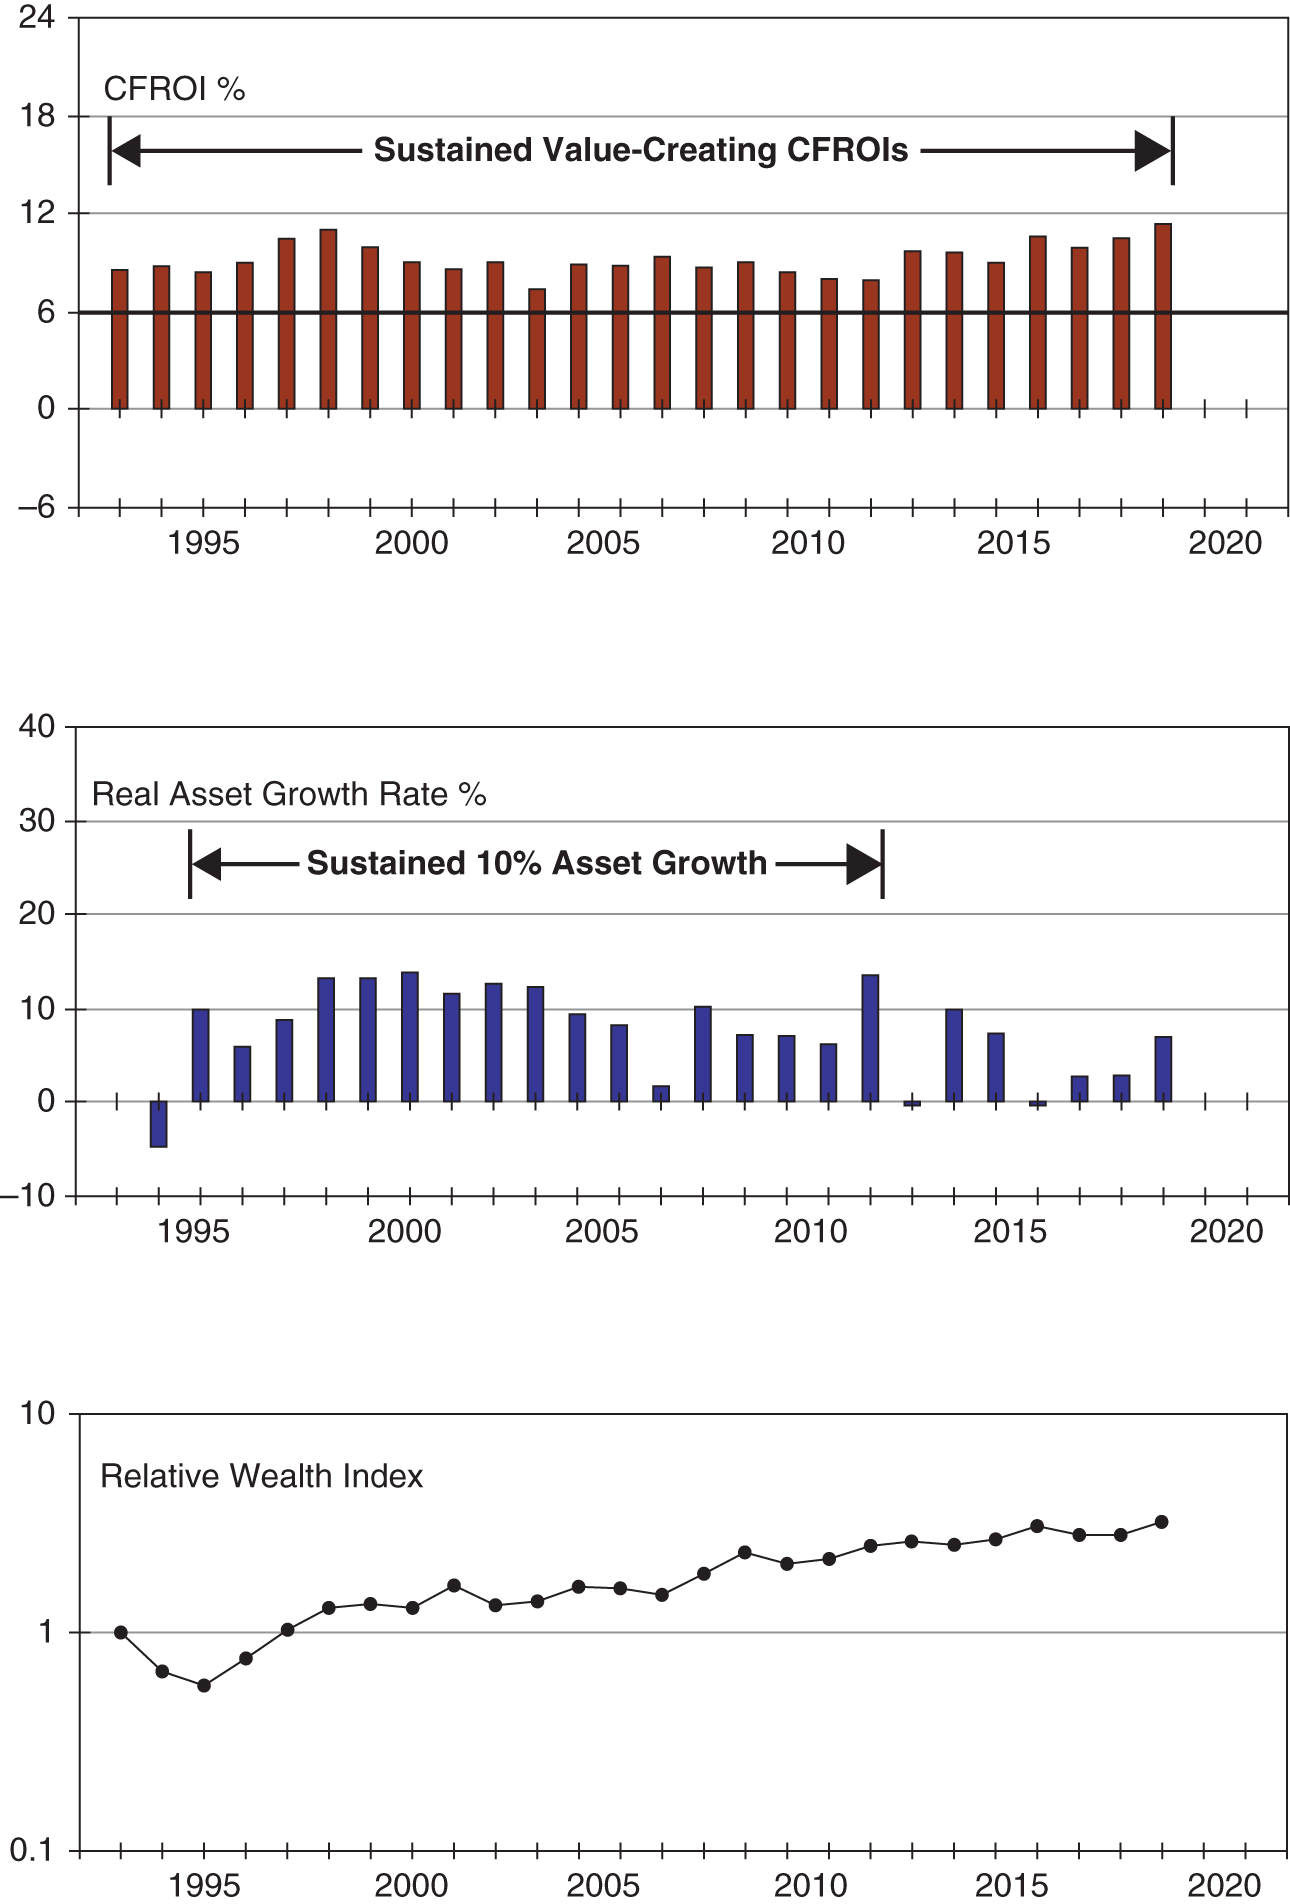
FIGURE 5.5 Costco 1993 to 2018
Source: Based on data from Credit Suisse HOLT global database.
Costco as a company is a valuable brand in addition to its Kirkland signature brand. However, technology changes and new competitors arrive that can significantly dilute a once valuable brand. The BlackBerry smartphone brand suffered this fate with the arrival of the Apple iPhone. Avon is another once highly valuable brand that became decidedly less valuable as the world changed.
RINGING DOORBELLS AND CHANGING TIMES—AVON
Avon began in 1886 when David McConnell decided to switch from selling books door-to-door to perfumes. The firm grew to hold the dominant position in door-to-door selling of beauty products. As I write about the company in late 2019, Avon is likely to be acquired by Natura, a Brazilian cosmetics firm with a similar business model as Avon's. Brazil is now Avon's largest market. The acquisition purchase price is about $2 billion, which compares to an equity market value of about $20 billion two decades earlier.
The beginning of the life-cycle track record for Avon (Figure 5.6) shows a successful business model keyed to the widely recognized Avon brand that resulted in high CFROIs (top panel) and high asset growth (middle panel) from 1960 to the early 1970s. Competitive fade occurred as CFROIs then declined to the mid-1980s.
Hicks Waldron became CEO in 1983 after Avon's CFROIs and stock price had sharply fallen from their peak in the early 1970s. Under his watch, the core business of direct selling was deemphasized, and a series of failed health care acquisitions soon followed. In his 1985 letter to shareholders, Waldron wrote these uninspiring words: “This is an exciting time at Avon, and I am pleased to be a part of it.… This is also an awkward time. We are not what we have been. Neither are we what we will be.”
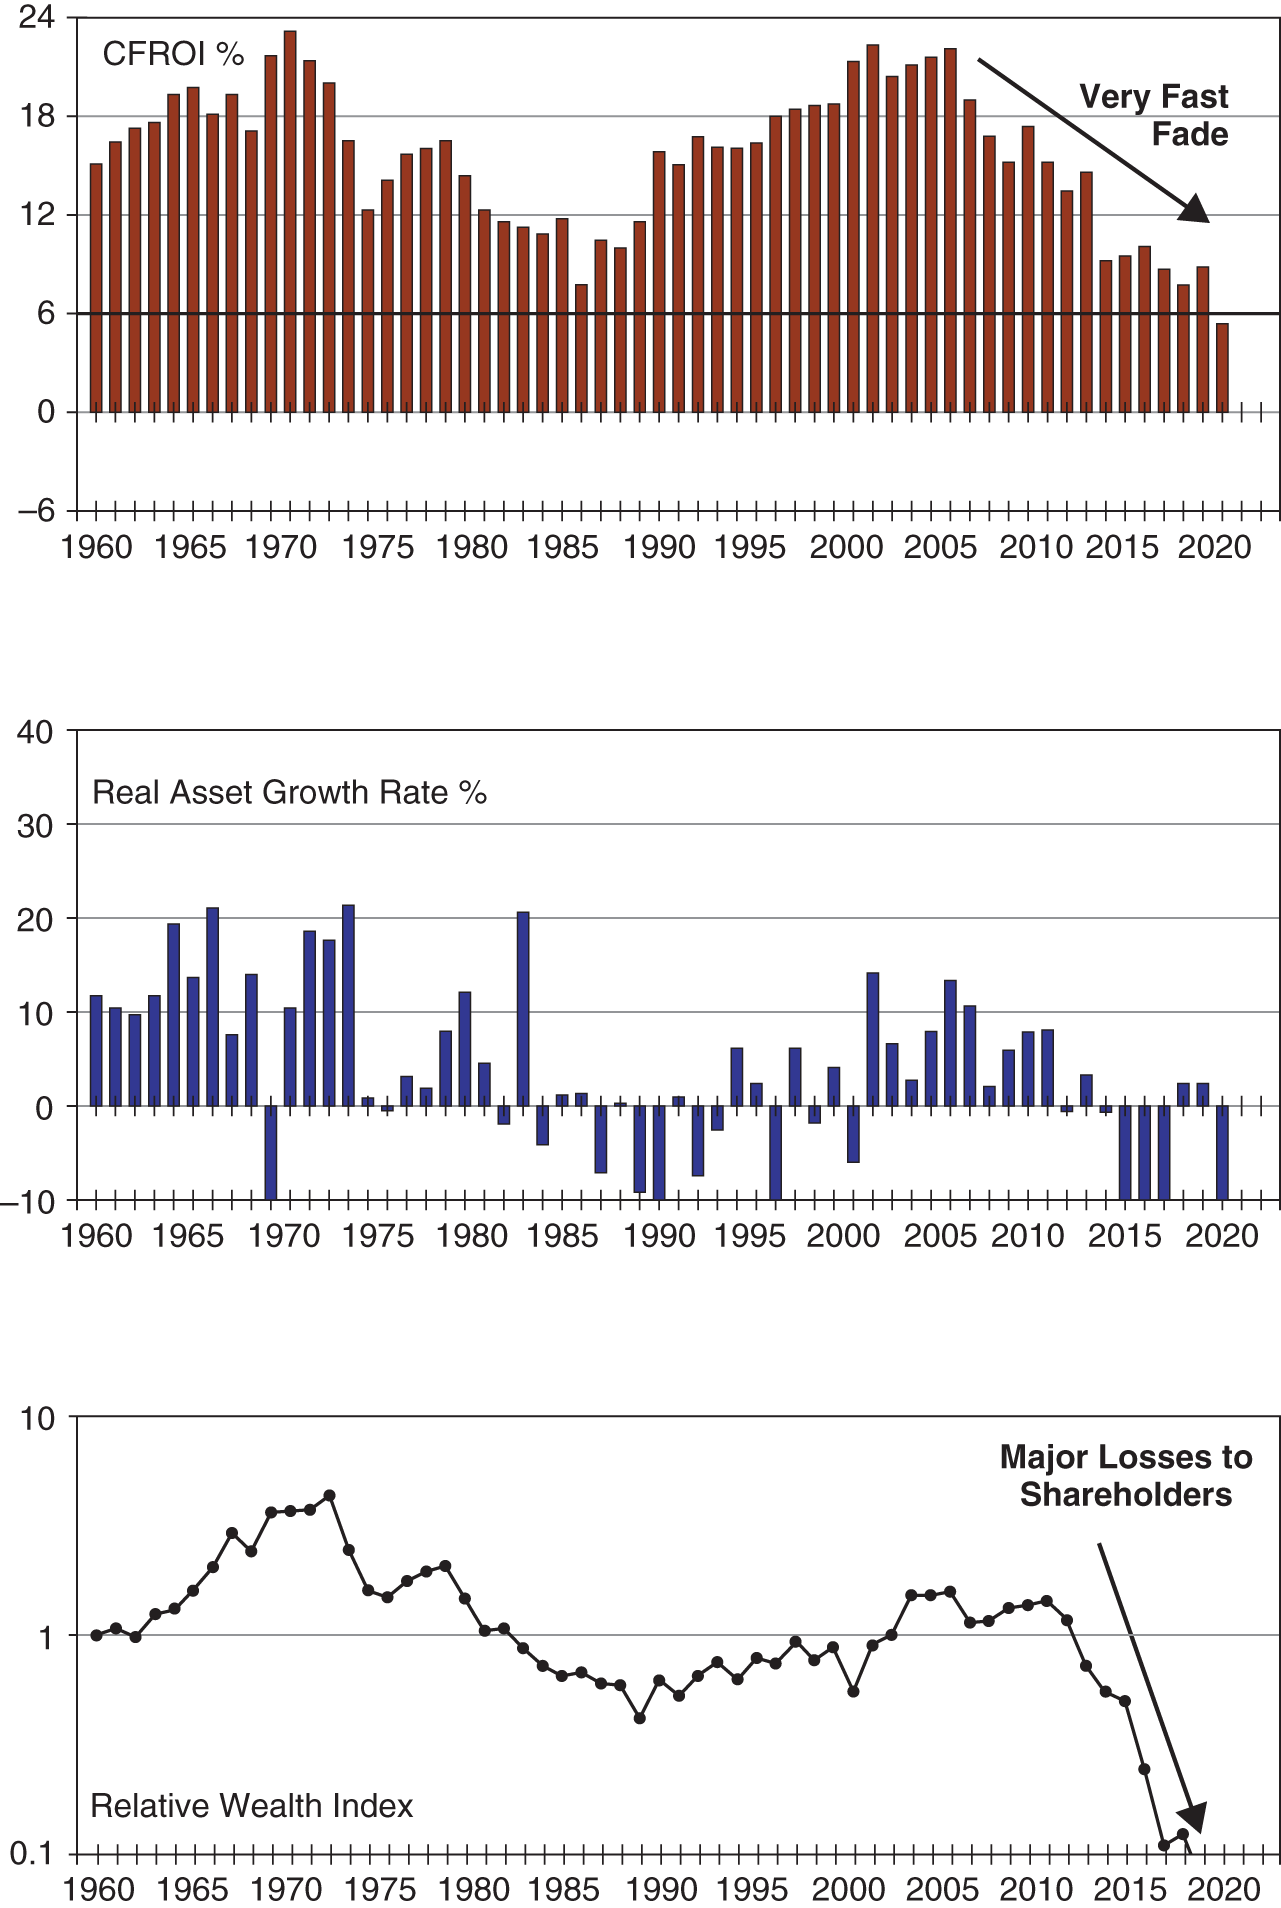
FIGURE 5.6 Avon 1960 to 2018
Source: Based on data from Credit Suisse HOLT global database.
In 1988, James Preston became CEO and announced the obvious that the health care diversification strategy was ill-conceived and value-dissipating. Furthermore, he stated that Avon's core beauty and direct selling business was the future. Preston immediately focused on curtailing Avon's free-spending habits in order to generate cash flow to handle the debt load incurred by his predecessor's debt-financed acquisitions.
In Preston's 1992 letter to shareholders, he crafted a new vision for Avon: “To be the company that best understands and satisfies the product, service, and self-fulfillment needs of women—globally.”
In 1999, Andrea Jung became Avon's first female CEO and held that position until 2012. As the top panel of Figure 5.6 displays, after early success, a fast fade of CFROIs took place under her leadership. Not only was Avon executing poorly, but the firm faced heightened competition from physical retail stores and online Internet stores; meanwhile costly corruption charges in China took years to resolve. Also, more women were working and not at home for easy access by Avon's sales representatives. Sheri Cox became the next CEO, and the firm continued to falter with severe losses to shareholders (bottom panel of Figure 5.6).
WHY DID ILLUMINA OUTPERFORM THE STOCK MARKET 18-FOLD FROM 2004 TO 2014?
Illumina is today's leader in instrumentation tools for large-scale analysis of genetic variation and function. Figure 5.7 plots monthly stock prices for Illumina beginning at year-end 2004. From this point to year-end 2014, Illumina's stock outperformed the S&P 500 18-fold. Why?
To answer the question of excess return, either positive or negative, one needs to quantify investor expectations of financial performance at the beginning of the period and compare these expectations to subsequent financial performance. The life-cycle framework is ideally suited for this task. Illumina's life-cycle track record (Figure 5.8) identifies the period 2000 to 2004 as startup years with repetitive negative CFROIs (top panel).

FIGURE 5.7 Illumina stock price 2005 to 2019
Source: Based on data from Credit Suisse HOLT global database.
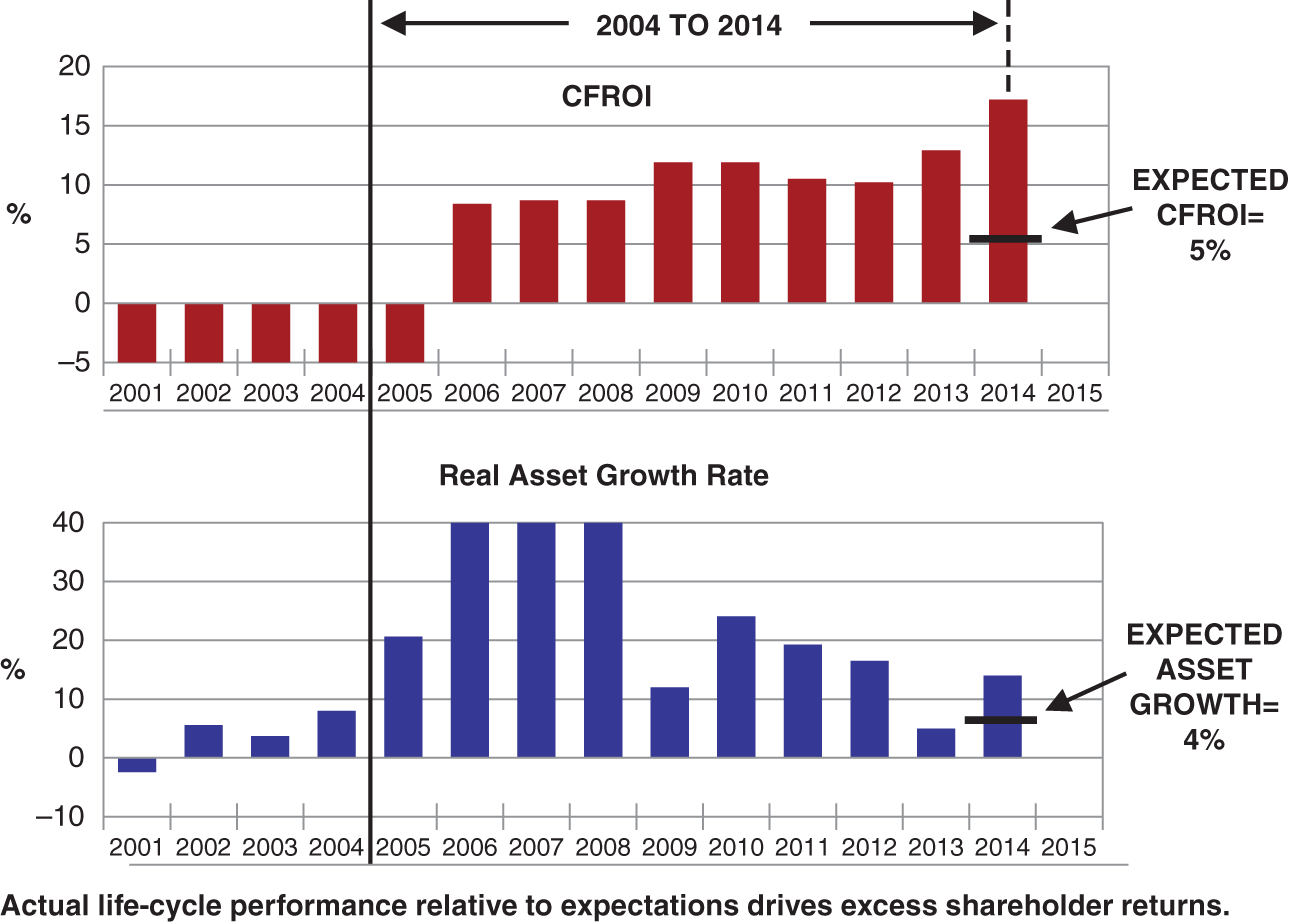
FIGURE 5.8 Illumina life-cycle expectations year-end 2004
The life-cycle valuation model described earlier (Figure 4.6) in Chapter 4 was used with data from the HOLT global database to quantify expectations implied in Illumina's stock price at year-end 2004. Given the estimated investor discount rate for Illumina at that time and the known market value of the company, the implied net cash receipt stream was calculated and expressed in life-cycle language. The expectations were that CFROIs would only improve to about 5% in 2014 coupled with asset growth of approximately 4% as shown above. In other words, investors did not expect what actually happened with Illumina dominating the genetic instrumentation market with rising CFROIs well above the cost of capital and high asset growth. As this stellar life-cycle performance unfolded during this 10-year period investors continually revised their expectations upward, which generated the 18-fold outperformance of the S&P 500 Index.
At one level of analysis, we have answered the question of why the outperformance occurred. But at a deeper and more holistic level, what caused this superior financial performance? The cause of Illumina's excess return from 2004 to 2014 was a superior knowledge-building culture reflected in both the strategic acquisitions made and the management of employees.
Jay Flatley, CEO from 1999 to 2016, excelled at knowledge building. His feedback about the external environment pinpointed where Illumina's technology was lagging in the fast-moving environment of DNA sequencing. Consequently, he made a series of acquisitions to expand Illumina's technology expertise, including a critically important 2007 acquisition of Solexa. As to his managerial approach, Flatley noted:
One of the really important things we did, early on, was structured our product development process in a way where we could very efficiently run a large number of projects simultaneously. This is what has given us the ability to scale, in size and complexity and number of products, and still be able to manage with a limited number of top executives. That's because of how we empower our teams to go off and do great things. They only have to come back to us under a very fixed set of circumstances. We [in management] can set the strategy and direction and talk about specifications. They can do the execution, which they are really good at.25
The Illumina example illustrates how cause and effect analysis improves understanding, which is a topic discussed further in the next section.
THE EFFICIENT MARKET HYPOTHESIS AND THE FACTOR ZOO
This chapter began with a review of intangibles as a prerequisite to analyzing the process of generating excess (positive/negative) shareholder returns. Empirical studies summarized the influence of intangibles on both firms' financial performance and their shareholder returns. The implicit logic of this research is that since intangibles are important, they also impact shareholder returns.
When researchers find that variable X is important for the successful management of firms, expect them to formulate a hypothesis that high/low values of X contribute to high/low shareholder returns. For example, corporate culture is generally acknowledged as an important variable impacting firm performance.26 Using employees' personal evaluations of firms as a favorable place to work as a proxy for a value-creation culture favorable to business success, data indicates that a value-weighted portfolio of the “100 Best Companies to Work for in America” earned a four-factor alpha of 0.29% per month from 1984 to 2009, or 3.5% per year.27
Environmental, social, and governance (ESG) practices are increasingly viewed not as optional “do good” initiatives but as an integral component to firms sustaining long-term success. A study of high sustainability companies with highly-rated ESG practices versus a matched sample of low sustainability companies documented that the former outperformed the latter over the long term both in terms of investor returns and accounting-based performance.28 In an influential report, From the Stockholders to the Stakeholders, Omar Selim summarized research on ESG:
In this enhanced meta-study we categorize more than 200 different sources. Within it, we find a remarkable correlation between diligent sustainability business practices and economic performance. The first part of the report explores this thesis from a strategic management perspective, with remarkable results: 88% of reviewed sources find that companies with robust sustainability practices demonstrate better operational performance, which ultimately translates into cash flows. The second part of the report builds on this, where 80% of the reviewed studies demonstrate that prudent sustainability practices have a positive influence on investment performance.
This report ultimately demonstrates that responsibility and profitability are not incompatible, but in fact wholly complementary. When investors and asset owners replace the question “how much return?” with “how much sustainable return?,” then they have evolved from a stockholder to a stakeholder.29
However, there is a danger that some managements will conclude that any outlay that improves their ESG rating is worthwhile. This becomes all the more tempting as money management firms gather assets earmarked for investment in firms that are highly rated as to ESG practices. Importantly, ESG outlays should be an integral part of managing to create value; for example, effective corporate governance practices result in resources being allocated to their most likely best uses. Successful ESG outlays meaningfully contribute to a firm sustaining its long-term ability to at least earn the cost of capital.
As to investor returns, the number of finance articles devoted to empirical tests of the degree of market efficiency is extraordinarily large and seemingly never ending. This is not surprising since the heart of modern finance seeks to connect risk and return within an equilibrium setting of market efficiency. The workhorse model first used to test market efficiency was CAPM, using Beta as a one-factor model. In his Nobel lecture, Gene Fama summarized his extensive contributions to finance research, noting:
It was clear from the beginning that the central question is whether asset prices reflect all available information—what I labeled the efficient market hypothesis.… The difficulty is making the hypothesis testable. We can't test whether the market does what it is supposed to do unless we specify what it is supposed to do. In other words, we need an asset pricing model, a model that specifies the characteristics of rational expected asset returns in a market equilibrium. Tests of efficiency basically test whether the properties of expected returns implied by the assumed model of market equilibrium are observed in actual returns. If the tests reject, we don't know whether the problem is an inefficient market or a bad model of market equilibrium.… The [CAPM] model is an elegantly simple and intuitively appealing tour de force that lays the foundations of asset pricing theory, but its major prediction that market B [Beta] suffices to explain the cross section of expected returns seems to be violated in many ways.30
Fama and French subsequently developed a three-factor model which, in addition to Beta, added size measured by a firm's market capitalizations (smaller size yields higher returns) and value measured by book-to-market ratios (higher ratios outperform) as proxies for risk not captured by Beta.31 That started an outpouring of factor studies that has lasted for decades with no sign of fatigue. To date, more than 300 factors have been reported in academic articles, prompting this research to be characterized as a “factor zoo.”32 Fama and French added profitability (higher leads to higher investor returns) and asset growth (lower leads to higher investor returns) to produce a five-factor model.33 Some contend that these additional factors reflect risk not captured by Beta. Others point out the implausibility of labeling some factors as a proxy for risk such as price momentum after a firm delivers surprisingly favorable quarterly operating performance.
The process by which the prices of assets, such as a firm's stock price, move to incorporate new information to better estimate a “rationally” determined price (“the price is right”) is important. Asset prices drive decentralized decision making, including resource allocations, and therefore are critical to a free (decentralized) market economy. An efficient market implies prices that incorporate all available value-relevant information with the result that there is no easy way to earn excess returns after transaction costs. This idea is simple enough.
However, researchers then confront the joint hypothesis problem articulated by Fama whereby abnormal returns may compensate for one or more unknown risk factors (deficient asset pricing model).34 If markets are efficient in the sense that the price is right, then the price likely reflects knowledgeable investors' forecasts of future net cash receipts translated to a present value using the investors' discount rate (Figure 4.6). Periods of high volatility can be due to variation in expected net cash receipts and/or changes in the investor discount rate. The latter point is referred to as time-varying expected returns and is corroborated by the time series discount rate data displayed in Figure 4.9.
What is the end game for research searching for factors that attempt to parsimoniously explain many investor return anomalies? What value is delivered and to whom?
The evidence on the predictability of stock returns is increasingly more difficult to reconcile with the efficient market framework.… We find particularly compelling the evidence that healthier and safer firms, as measured by various measures of risk or fundamentals, often earn higher subsequent returns. Firms with lower Beta, lower volatility, lower distress risk, lower leverage, and superior measures of profitability and growth, all earn higher [investor] returns.… If these firms are riskier, it is odd that they should exhibit future operating and return characteristics that suggest the opposite.35
There is a persuasive logical argument that markets may be efficient in the sense of no easy way to earn abnormal profits after transactions costs, yet actual prices may deviate from the rationally determined DCF (discounted cash flow) warranted valuations made by knowledgeable investors participating in setting the price.36 Consistent with this line of thinking, serious investors equipped to do DCF analysis on firms should always be skeptical of market prices; monitor investor expectations implied in stock prices; and also monitor their upside, most likely, and pessimistic forecasts for plausibility as new information is received. Such a skeptical mindset and a well-grounded willingness to disagree with the market is facilitated by forecasts expressed in life-cycle terms and expectations implied in current stock prices articulated in life-cycle terms (i.e., economic returns and reinvestment rates).
EXCESS SHAREHOLDER RETURNS AND THREE LEVELS OF CAUSE-AND-EFFECT LOGIC
The previous section focused on tests of market efficiency and highlighted statistical studies that have produced a factor zoo. Let's pause for a moment and seriously question the research process at work. Specifically, the beginning point is the CAPM that elegantly connects risk and return in an environment of equilibrium coupled to the efficient market hypothesis. This framework led to statistical studies using regression equations to measure correlations of variables with excess return. But these studies, for the most part, lack a cause-and-effect logic as to what drives a firm's market valuation.37 This should be no surprise since in equilibrium an efficient market means that it is futile to seek excess risk-adjusted returns by analyzing how firms create value and calculating warranted valuations. This is because all available value-relevant information is assumed to be assimilated in the current price.
One way to think about empirical research on the topic of excess shareholder returns is to divide this research into three levels according to the type of cause-and-effect logic employed. Level 1, described above, is essentially a search for correlations between readily available computerized financial data on firms and excess returns. These studies address both market efficiency and candidate variables (factors) to improve upon the one-factor (Beta) CAPM. Little attention is given to a deeper understanding of life-cycle-type analysis and the role of a firm's knowledge-building proficiency. However, the life-cycle lens can provide insights that lead to groupings of firms that behave in predictable ways totally missed by data analysis that ignores life-cycle stages (Figure 4.2). For example, asset growth rates have been shown to be correlated with excess returns, that is, low asset growth firms exhibit higher shareholder returns, on average, than high asset growth firms.38 But attention to causality suggests that we consider the relationships of all the variables in the life-cycle valuation model, not merely isolate on asset growth.39 Should we not employ a more fine-grained analysis that segments the aggregated data to focus on the impact of knowledge building in sustaining a firm's profitability at high levels? In these situations, big reinvestment rates (asset growth) coupled to high and sustained CFROIs can easily produce positive excess returns—the opposite of the reported relationship for asset growth.40 Also, we could observe the type of firms recording high asset growth due to repeated acquisitions. Consider grouping firms earning high CFROIs due to demonstrated skill in consolidating industries or improving the operations of acquired firms (e.g., Danaher). This group differs from less skilled acquisitive firms, some of which may be earning low CFROIs and in need of restructuring rather than empire-building acquisitions. These “skilled” acquirers who exhibit high asset growth may perform quite differently than the aggregated data and deliver, on average, positive excess shareholder returns.
Many Level 1 studies can be criticized for ignoring the increasing importance of intangibles (not yet a meaningful part of accounting data) in the New Economy. Reported accounting numbers for book values lose meaning in more recent years compared to historical years when tangible assets dominated. The often-tested book-to-market ratio is clearly a problematic variable as to its predictability for excess returns in future years. Moreover, in the Old Economy entrepreneurial small firms led the innovation charge while large firms were faced with saturated markets for their products. However, in the New Economy firms with successful platforms quickly get large and then begin an extended period of value creation. So, size in the future may not be a predictive factor for excess returns, which would be contrary to findings based on historical data. Many successful startup firms in the New Economy do an IPO at a valuation that makes them a large company. These are examples of potential problems when correlations using financial variables are divorced from causality and changing context.
Compared to Level 1, Level 2 thinking uses more straightforward cause-and-effect logic between a variable and its perceived impact on firm performance. The idea is that investors may not fully appreciate the variable's importance and, as firm performance unfolds over time, investors react and the result is excess shareholder returns. Three variables discussed earlier in this chapter are representative of Level 2 thinking. First, environmental, social, and governance (ESG) research was summarized that affirmed a correlation with firm performance and excess shareholder returns. Keep in mind that successful (and therefore) profitable firms have available cash to fund increased ESG expenditures and consequently one needs to be careful about cause and effect as to how much of a firm's success was directly due to ESG expenditures. Second, as previously noted, the impact on firm performance and excess investor returns was documented due to a firm's value creation culture. Third, a similar finding was documented for a wide range of studies focused on intangibles. Importantly, Level 2 research more closely connects causal variables to life-cycle performance and investor returns compared to the myriad correlations and inferences about not-yet-specified risk variables encountered in Level 1 research. Recall the example of Illumina whereby the life-cycle valuation model was used to calculate investor expectations at year-end 2004 for the next 10 years. The subsequent actual economic returns and reinvestment rates significantly exceeded these expectations generating an investor return that outperformed the S&P 500 Index 18-fold. This kind of analysis represents a much stronger cause-and-effect logic versus Level 1 research.
Level 3 thinking emphasizes the primary importance of a firm's knowledge-building proficiency (i.e., the pragmatic theory of the firm). Put differently, top management skilled in knowledge building will most likely appreciate that value creation requires the development of intangible assets, the “right” culture, and a firm's purpose that motivates ESG initiatives that support value creation for all stakeholders (see Figure 5.9). In this sense, the fundamental cause of what shows up as long-term shareholder returns is rooted in a firm's knowledge-building proficiency. At bedrock, this causality is what the pragmatic theory of the firm explains in detail.
A similar bedrock causality was addressed in Chapter 2 concerning Christensen's Theory of Jobs to Be Done. Of course, consumers hire a product to get a specific job done—so obvious once the idea is explained and it fully sinks in. Useful theories do not require elegant mathematical expressions, just powerful connections that explain causality. Application of the Jobs Theory helps explain why certain product innovations do poorly while others do well. Similarly, application of the pragmatic theory of the firm helps explain long-term shareholder returns as caused by life-cycle performance, which is driven by a firm's knowledge-building proficiency.

FIGURE 5.9 Cause-and-effect logic applied to shareholder returns
The above discussion about the three different levels of cause-and-effect logic is summarized in Figure 5.9.
The difference between Level 2 thinking and Level 3 thinking is revealed by answering questions like the following, which involve drilling down to root causes:
- Why did Nucor's stock outperform the market 10-fold from 1975 to 1995? This is a steel company in a notoriously low return cyclical industry. Importantly, Nucor's life-cycle track record shows economic returns that were cyclical but averaging well above the cost of capital and substantially greater than its industry peers during this time period.
- What caused this financial performance? Many point to Nucor's innovation of especially productive mini-mills that use electric arc furnaces and high bonuses paid to its exceptionally productive employees.
- What caused this productivity? The answer is Nucor's knowledge-building proficiency orchestrated by Ken Iverson, its longtime CEO who retired in 1996. Iverson was the root cause of Nucor's value-creation culture that produced industry-leading technology and the industry's highest productive employees. In Iverson's words:
- My way of thinking … Instead of telling people what to do and then hounding them to do it, our managers focus on shaping an environment that frees employees to determine what they can do and should do, to the benefit of themselves and the business.
- I recall that we started a crew on a straightener machine—which straightens steel angles to meet our customers' requirements—at a production bonus of eight tons per hour. The rated capacity of the machine was ten tons per hour. Well, that crew kept tinkering and experimenting. They installed a larger motor, fed the angles into the machine in various ways, and so on. Within a year, their production was up to twenty tons an hour, twice that machine's rated capacity. Perhaps the engineers who calculate a machine's capacity should come up with a new formula, one that estimates the capacity of machines run by people who earn according to what they produce.41
Level 2 puts a spotlight on hypothesized causes of a firm's life-cycle track record. Life-cycle track records decompose a firm's financial performance showing the results of key strategic choices and management's skill in adapting to change. To my knowledge, empirical studies in the top academic journals to-date have not used the life-cycle framework similar to the Illumina example even though this yields a far greater understanding of cause and effect versus Level 1 correlation studies.
Occasionally a study addresses Level 3 thinking and focuses on “smart” management (highly rated as to knowledge-building proficiency) and hypothesizes that smart management is more likely to create significant future value compared to less skilled management. A study by Lauren Cohen, Karl Diether, and Christopher Malloy represents Level 3 thinking. The authors gauge a firm's knowledge-building proficiency according to its track record of translating R&D expenditures into sales.
Our approach is based on the simple idea that some firms are likely to be skilled at certain activities, and some are not, and this skill may be persistent over time.… We show that … substantial return predictability exists by exploiting the information in these firm-level track records. We find that a long-short portfolio strategy that takes advantage of the information in past track records yields abnormal returns of 11 percent per annum.… We show that the firms we classify as high ability based on their past track records also produce tangible results with their research and development efforts. In particular, R&D spending by high ability firms leads to increased numbers of patents, patent citations, and new product innovations by these firms in the future. The same level of R&D investment by low ability firms does not.42
Here is one more example of Level 3 thinking regarding knowledge building and firm performance. A creative study was done that focused on an exogenous shock to a group of medical device firms which caused the firms to lose, for a period of time, the knowledge-building contribution from nonemployee physicians, and this negatively impacted firm performance.
In 2005, the U.S. Department of Justice (DOJ) investigated the five leading orthopedic device companies regarding their close relationships with physicians. We … find evidence of a large decline in FDA-approved products for the firms under investigation.… We find the largest decreases in both the number and average quality of inventions in the technology areas where physician knowledge is most important and the largest decreases in the number of FDA-approved products in areas related to prosthesis and spine, where physician collaboration is crucial.43
A transition to Level 3 research entails significant creativity and willingness to gather data that is not so easy to obtain compared to the computerized financial data typically used in Level 1 research.
USEFUL IDEAS FOR INVESTORS, MANAGEMENTS, AND ACADEMIC RESEARCHERS
Investors
I have had a long career working with the life-cycle framework applied to corporate consulting and especially money management. Here are key observations about the worldview of successful money managers who have committed to the life-cycle framework for analyzing companies and guiding their buy/hold/sell decisions.
- Stock prices, on average, represent extraordinarily astute forecasts of a firm's future life-cycle performance. There is no easy way, on a sustained basis, to earn excess investor returns after transactions costs when managing a sizable portfolio.
- The long-term success of active portfolio managers depends upon their valuation model and their skill in forecasting variables such as fade rates and their discipline in waiting for opportunities. An opportunity represents exploitable mispricing because of their specific company insights and cognizance of why a company's stock price trades as it does. These successful active managers recognize that most stocks most of the time offer no exploitable mispricing.
- Life-cycle track records need to use accounting data that has been adjusted by capitalizing and amortizing intangibles for which economic lives can be approximated to a reasonable degree. The resulting time series of economic returns and reinvestment rates help explain why a stock has outperformed or underperformed the market over longer periods of time.
- Life-cycle track records enable one to understand a company's history in an economically meaningful way. To judge the plausibility of a forecast, it helps to juxtapose a firm's forecasted future life-cycle performance next to its past life-cycle performance and also compare to track records of competitors.
- Display one's optimistic, most likely, and pessimistic long-term forecasts as economic returns and reinvestment rates that fade over time. A uniquely valuable skill for investors is in forecasting future fade rates which incorporate the likely contribution of intangible assets.
- Invest for the long term.44 Patiently wait for the occasional opportunity to disagree, via a well-grounded analysis, with the investor expectations implied in current stock prices.
- Knowing why current investor expectations differ from one's most likely forecast is especially useful. Is this due to a short-term situation that does not fundamentally alter one's long-term forecast? Or, is the market possibly seeing around a corner and one's current assessment of a firm's future will be proved wrong?
Managements
Management is about value creation. Experience communicating to management and boards concerning the basic fundamentals about value creation and how the stock market works suggests the following key points.45
- Top management, board members, and other groups within the firm typically have strong opinions about competitors and can easily rank competing firms high to low on skill in efficiently creating value for customers.
- When the life-cycle track records of these competitors are presented, invariably these financial performance scorecards correlate closely with the ranking of companies by skill. In addition, it is straightforward to demonstrate that the life-cycle framework does a significantly better job than P/E multiples and earnings growth rates in explaining investor expectations implied in stock prices.
- Value is created by earning economic returns above the cost of capital and high reinvestment in these businesses is warranted; investing in cost-of-capital businesses represents getting bigger but not creating incremental value; and those businesses (not startups) that steadfastly fail to earn the cost of capital need to purge business-as-usual reinvestment and restructure.
- The logical next step is to construct life-cycle track records for a firm's business units. At this point, the handling of intangible assets is no longer an abstract accounting issue but an important measurement challenge that needs to be addressed. There is a tradeoff between accuracy and simplicity. Begin with conventional RONA (return-on-net assets) and experiment with more accurate calculations along the lines of the CFROI. As previously noted, when substantial intangibles are capitalized and amortized, more accurate track records result.46
- In the spirit of the Life-Cycle Review discussed earlier, management and the board are better equipped to debate strategy and resource allocation when business unit performance is put in the context of life-cycle track records.
Academic Researchers
Finance, accounting, and management researchers would benefit from fresh thinking about the Efficient Market Hypothesis, related factor models, and the information needs of management in the New Economy. The following points are relevant:
- As previously noted, knowledgeable investors agree that there is no easy way to make money, after transactions costs, in publicly traded markets on a sustained basis, and especially with larger assets being managed.47
- Finance researchers should reassess the rationale for continually enlarging the factor zoo. As to research on investor returns, a transition from Level 1 thinking to Level 2 and especially Level 3 thinking may generate new insights connecting a firm's financial performance to its investor returns.
- Simulations, such as the display in Figure 4.11, that connect known economic scenarios (e.g., cash-out and cash-in time series for modeled firms) to the resulting accounting data are a fertile field that has not yet been meaningfully plowed and could lead to innovative breakthroughs in accounting for intangibles to the benefit of management, investors, and the accounting rule-makers.48
- Historical studies of firms would benefit from the inclusion of life-cycle track records that sharpen the link between management behavior and financial performance.
- Finance, accounting, and management researchers should jointly work on the information needs of management to improve firm performance. A useful starting point is the six critical questions outlined in the next section.
SYSTEM PRINCIPLES AND EFFECTIVE LANGUAGE
Keep in mind that a useful theory brings a deeper understanding of the phenomena of interest, makes important predictions, and also reveals problems that otherwise remain unnoticed. Specifically, a major thrust of Lean Thinking is problem solving to yield continual process improvements. Employees should be motivated to develop, and be compensated for, continual process improvements. But, at higher organizational levels of most firms, management uses accounting-based reports to measure business unit performance. Tom Johnson summarizes the situation:
No company that talks about improving performance can know what it is doing if its primary window on results is financial [accounting] information and not system principles.… The dilemma facing all companies that intend to become “lean” is that they can follow a truly systemic path to lean or they can continue to use management accounting “levers of control.” They can't do both.49
But, the pragmatic theory of the firm suggests that doing both is needed to promote value creation. Consider how accounting data is needed in order to calculate economic returns (ROIs) achieved by a firm and to help management make smart resource allocation decisions. Why continue with incremental improvements to a business unit that realistically can never earn the cost of capital? However, Johnson is on target with his emphasis on controlling those key variables that cause the accounting results. For example, radically reducing inventories to “improve” RONA (return on net assets) before first transitioning to a far more efficient lean process can easily worsen results. So, there is a crossover problem involving a transition from accounting data used for decision making at higher levels to process control variables measured at lower levels of the firm where the work is done.
The crossover problem, illustrated in Figure 5.10, spotlights the need for a deeper understanding of value creation and the kind of information that is truly useful.50 As we improve our understanding, expect our language to become more precise for describing how the system functions and how to manage improvements.
Language is perception's silent partner.51 Julio Olalla notes that: “We live in language in the same way that fish live in water: it is transparent to us…We are unaware that language is shaping the world as we see it.”52
For example, those in business continually deal with management's goal of reducing costs. For many, the meaning of the word cost is rooted in the language of accounting. That word can easily shape the world into independent activities thereby promoting actions to minimize accounting cost without regard to the consequences on the overall system.
Consider the improvement in language (and thinking) when we work toward a goal of reducing waste (any activity that does not add value) along the entire value stream. The value stream is all of the actions that transition raw materials to a product delivered to a customer. The same concept applies to service firms as well as manufacturing firms. The value stream concept helps shape our worldview to embrace horizontal flows as opposed to vertical silos with their own stand-alone accounting costs.
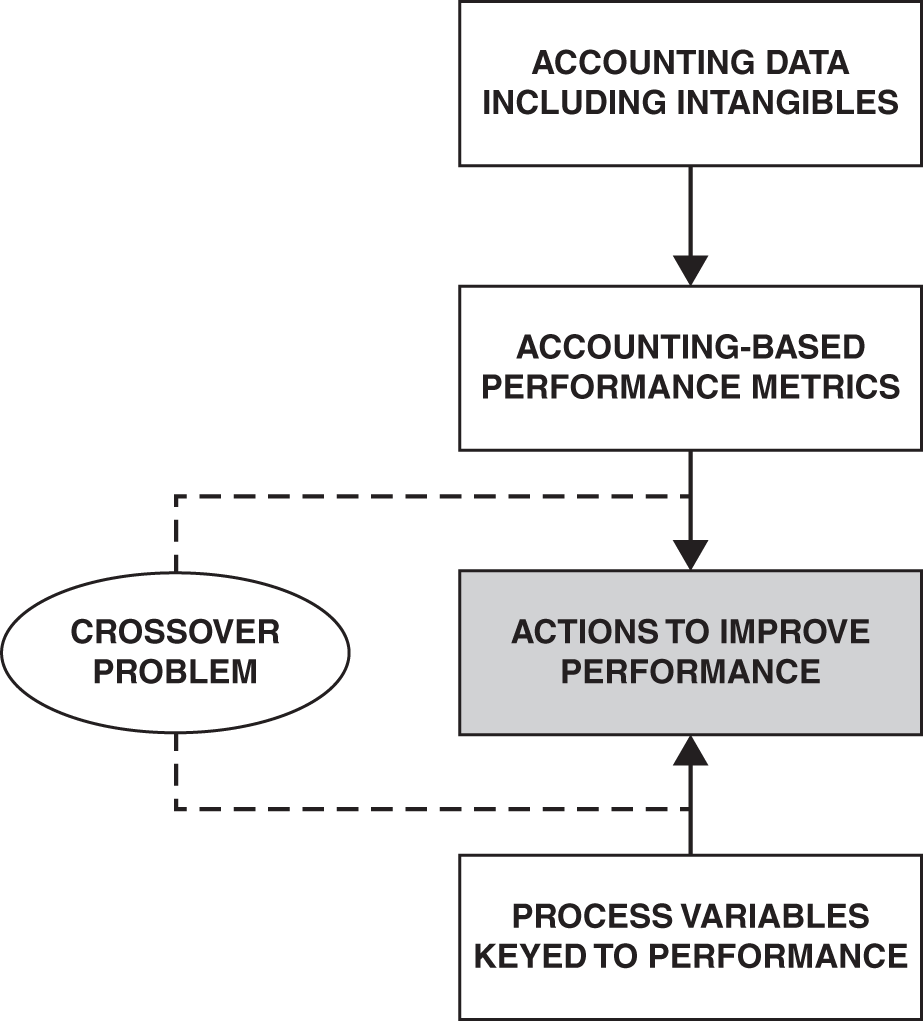
FIGURE 5.10 The crossover problem
The usefulness of our current language used to manage firms can be assessed by its effectiveness in answering six critically important questions.
- How best to communicate to employees a cause-and-effect logic that is operationally useful for them and connects to strategy, resources, and value streams? Both products sold and services delivered to customers involve a value stream that has a horizontal flow through many localized activities, typically organized as silos within the firm and its suppliers. The value stream mindset is helpful for understanding how value is created as well as identifying waste (non-value-adding activities).53 Disconnected from the perspective of lower-level employees is the process whereby management sets strategic objectives, develops resources, and allocates resources.
- How best to organize improvements with an eye on the key constraint? At any point in time, management should be able to identify the key constraint arising within the system (i.e., the firm). The analysis may suggest that improving the localized efficiency of one component degrades the efficiency of the overall system. For example, suppose the bottleneck (key constraint) is located at B downstream from activity A. Hence, improving A (install faster machine) can easily worsen the bottleneck situation at B.
- How best to utilize process variables in order to link to accounting-based data and to ROI measurement? Process variables provide guideposts for those performing work but are not expressed in accounting language that translates to an ROI. This is a significant measurement problem.
- How best to design a learning process inside the firm for generating useful data (quantitative and qualitative) on intangibles? There are three major needs: (1) improved decision-making for investing in intangibles; (2) improved process for incorporating intangibles into the language of accounting in order to generate more useful track records of economic returns and reinvestment rates for a firm and its business units; and (3) better explanations for investors as to how a firm creates long-term value.
- How best to design compensation packages that optimize the balance between short-term performance and building long-term value, which may involve significant outlays for intangibles? This work would benefit from experience in using the life-cycle framework to understand long-term value creation as reflected in stock prices. In particular, one should appreciate the process of value creation illustrated by Amazon's quarterly earnings shortfalls due to making exceptionally large investments in new businesses which coincided with rising stock prices. Similarly, Netflix made large investments which tempered their quarterly earnings but resulted in a sharply rising subscriber base and a rising stock price.
- How best to organize data about the firm's operations and management's decisions (especially strategic decisions) that shows how well or poorly these activities utilize components of the knowledge-building loop illustrated in Figure 2.1: purposes, worldview, perceptions, actions and consequences, feedback, and the validity of core assumptions in the knowledge base? A core proposition in this book is that if you could choose just one thing for a firm's management to get right in order to survive and prosper over the long term, that would be a firm's knowledge-building proficiency.
There are many ongoing approaches designed to improve communication in order to facilitate value-creating decisions. This is an obvious commonsense need to fill. Although these various approaches do not attempt to deal with all of the key questions posed above, some of these approaches represent significant steps to improve decision-making.
For instance, the Balanced Scorecard is designed to coordinate activities to achieve long-term strategic goals. Measurements are focused on financial performance, customer knowledge, business processes, and capabilities. The architects of the Balanced Scorecard, Robert Kaplan and David Norton, note that: “Every measure selected for a Balanced Scorecard should be an element in a chain of cause-and-effect relationships that communicate the meaning of the business unit's strategy to the organization.”54 Moreover, they recommend an Office of Strategic Management to coordinate activities across functions and business units (conceptually similar to value stream maps used by lean thinkers).55 This important thinking about coordination is shared by Toyota, which gives remarkably wide responsibility to their Chief Engineers (CEs). At Toyota, CEs have responsibility for developing new vehicles but no authority over the functional groups doing the work. Their success depends upon their skill in building knowledge and effectively communicating with others—the essence of a value-creating language. The following is a glimpse into the role of CEs and their emphasis on building knowledge:
It's clear that the chief engineers are target-driven and timing-driven, yet always willing to step back and reflect on the range of options that are available. One thing about the Lexus and the Prius is the “no-compromise” attitude of the chief engineers. At some point, with the intense time pressure to do a seemingly impossible job, one would expect the leader to say, “OK, let's pick a direction and just get on with it.” But repeatedly throughout the Prius development, Uchiyamada [CE Takeshi Uchiyamada] would step back and say, “Let's stop and reflect. Let's rethink what this project is about. Let's test every possible design for a hybrid engine in the world. Let's have a design competition and get all the styling studios to generate competitive designs.” Suzuki [Ichiro Suzuki, who has the reputation of being the Michael Jordan of Toyota's CEs] decided to do what had never been done in engine technology, aerodynamics, and fuel economy through experimenting and trying new ideas.… Exploring all possible alternatives and considering pros and cons of each while consulting all partners who have something to offer allows Toyota to execute fast, once a decision is finally made, without backtracking to remake decisions.56
Perhaps a useful name for those who specialize in this type of coordination is system conductor, similar to the role of an orchestra conductor. Much can be learned about a value-creating language by studying the thinking and communicating processes used by Toyota CEs and others who orchestrate highly effective coordination in complex environments. The qualitative nature of these studies sharply differs from those using quantitative accounting-based data; however, such studies can yield valuable insights about how knowledge is created and communicated, leading to value creation involving thousands of people, which is of the utmost importance to understand.
In their book, The End of Accounting and the Path Forward for Investors and Managers, Baruch Lev and Feng Gu promote an industry-specific Strategic Resources and Consequences Report designed to communicate how a firm can potentially achieve economic returns above the cost of capital (competitive advantage). The report is organized in a logical sequence with detailed information that addresses: developing resources (e.g., R&D outlays), resource stocks (e.g., patents), resource preservation, resource deployment, and value created. This proposal is in the spirit of Integrated Reports (Chapter 5) but with a far greater emphasis on business economics. Importantly, the spotlight is put on intangibles which can be unique and difficult for competitors to duplicate as opposed to tangible assets that are easily copied.
Keep in mind that today's accounting system was mainly shaped in the early 1900s to support manufacturing products in batches—a push system which is diametrically opposite to a preferred pull system that ties manufacturing to customer orders using lean processes designed to reduce waste throughout the entire system. Standard cost accounting is about minimizing cost per unit produced, which encourages local efficiencies, not overall system efficiency. For manufacturing firms, standard cost accounting is designed to reward maximum production and work-in-process inventories and penalize unused capacity. Both lean proponents and Theory of Constraints (TOC) proponents strongly object to standard cost accounting and instead tie measurements to value streams using a systems mindset. TOC founder, Eli Goldratt, often made presentations titled “Cost Accounting—Public Enemy Number One of Productivity.”57
The above discussion about accounting language, specifically the language of standard cost accounting, returns us to the knowledge-building loop of Figure 2.1, which has purposes as one component. Note the divergent purposes between standard cost accounting and overall system efficiency:
Lean companies make money by maximizing flow on the pull from the customer, not by maximizing resource utilization. Lean companies realize that maximizing resource utilization leads to overproduction, inventory, and large batches.… Lean companies relentlessly eliminate waste to create available capacity to meet increasing customer demand—and generate more profits. Again, standard cost information will send the wrong message—that resources are being underutilized even though customer-focused operational performance such as improved on-time shipments, are improving. Operational performance in a lean [manufacturing] company is measured by improvements in cycle time, productivity, quality, flow, and cost. Standard cost information does not provide any relevant performance measures in any of these areas. Indeed, standard costing systems provide information that motivates people to take actions that sabotage lean operational improvement.58
The use of accounting data should be in the context of value creation and not the standard cost accounting that is attuned to the manufacturing world of the early 1900s. At one level of analysis, value creation is about a comparison of ROI versus the opportunity cost of capital. A more comprehensive level addresses market value created and involves present value calculations of future net cash receipts. As explained in Chapter 4, an especially useful way to forecast net cash receipts is via the life-cycle variables of economic returns and reinvestment rates that incorporate long-term mean-reversion.
Another way to express the critical ROI versus cost of capital comparison is to deduct a capital charge from a firm's income. The resulting residual income (first used by General Electric) involves a deduction computed as the product of a firm's assets multiplied by its cost of capital.59 The residual income concept has been popularized as EVA (economic value added).60
What is the difference between EVA track records and the life-cycle track records using CFROIs, which are displayed throughout this book?
We can differentiate these concepts by focusing on purpose. The purpose of residual income/EVA is to draw attention to the direction and magnitude of value created (positive) or dissipated (negative) for ongoing business units and firms (not startups). This is a step in the right direction away from earnings and earnings per share growth rates as a guide to a firm's performance. However, users of EVA in business environments need to be mindful of the previously discussed crossover problem. Managing with an accounting-based metric like EVA at lower levels of the business can be at cross-purposes with managing improvements guided by process variables.
The purpose of life-cycle track records is to gain insights as to levels and trends in economic returns and reinvestment rates; to understand the key issue determining a firm's current market value—its economic returns or reinvestment rates, or both; to facilitate comparisons with competitors on a global basis; to raise questions as to the adjustments (especially for intangibles) made to calculate economic returns and reinvestment rates; and to provide plausible checks regarding forecasts of future fade of economic returns and reinvestment rates. Consequently, we see that EVA's gain in simplicity, by compressing all the life-cycle variables into a single number, is a shortcoming for deeper analysis.61 For example, EVA users often use some version of a CAPM/Beta equity cost of capital which involves an estimate of Beta and an estimate of the equity risk premium. These estimates are subject to wide variation and can have a significant impact on the final calculation of EVA, such as switching from a positive EVA to a negative EVA. But this dilemma is obfuscated by the single compressed EVA number.
What we see is the unavoidable tradeoff between simplicity and complexity. For example, CFROIs and reinvestment rates are inflation adjusted, which is essential for analyses that cover long time periods and especially important for cross-comparisons with firms on a global basis. However, inflation adjustments entail significant effort whose incremental cost may not exceed the benefit for managers whose firms operate in a low-inflation environment.
Here is an important issue when interpreting a time series (track record) of EVAs for a business unit or firm. Is a year-to-year increase in EVA due to a higher reinvestment rate in above-cost-of-capital projects or a reduction in reinvestment in below-cost-of-capital projects? The former is more difficult to do and is encouraging for favorable fade in the future, whereas the later tends to be a short-term benefit and less sustainable as to value creation over the long term. In contrast, life-cycle track records provide a clear visual explanation of the interrelated impact of economic returns, cost of capital, and reinvestment rates on value creation.
In summary, the above discussion of six critically important questions involves knowledge building, especially the role of language in shaping our perceptions. Research that improves our answers to these questions will likely involve seeing behind the assumptions in the words we use and thereby sharpening our language for value creation.
NOTES
- 1 Baruch Lev and Feng Gu, 2015, The End of Accounting and the Path Forward for Investors and Managers. Hoboken, NJ: John Wiley & Sons, p. 81.
- 2 Nigel Hollis, 2013, Brand Premium: How Smart Brands Make More Money. New York: Palgrave Macmillan. pp. 95 and 105–106.
- 3 Alex Moazed and Nicholas L. Johnson, 2016, Modern Monopolies: What It Takes to Dominate the 21st Century Economy. New York: St. Martin's Press, pp. 31 and 212.
- 4 Baruch Lev, Bharat Sarath, and Theodore Sougiannis, 2005, “R&D Reporting Biases and Their Consequences,” Contemporary Accounting Research 22(4): 977–1026.
- 5 Anne Wyatt, 2008, “What Financial and Non-financial Information on Intangibles Is Value Relevant? A Review of the Evidence,” Accounting and Business Research 38(3): 217–256. For a particularly comprehensive review, see Daniel Zeghal and Anis Maaloul, 2011, “The Accounting Treatment of Intangibles—A Critical Review of the Literature,” Accounting Forum (35): 262–274. The importance of accounting for scale in regression studies focused on the value relevance of intangibles was demonstrated in Mustafa Ciftci, Masako Darrough, and Raj Mashruwala, 2014, “Value Relevance of Accounting Information for Intangible-Intensive Industries and the Impact of Scale: The U.S. Evidence,” European Accounting Review 23(2): 199–226.
- 6 These findings are taken from John Hand and Baruch Lev, eds., 2003, Intangible Assets: Values, Measures, and Risks. Oxford: Oxford University Press.
- 7 Allan C. Eberhart, William F. Maxwell, and Akhtar R. Siddique, 2004, “An Examination of Long-Term Abnormal Stock Returns and Operating Performance Following R&D Increases,” Journal of Finance 59(2): 623–650.
- 8 Andrea L. Eisfeldt and Dimitris Papanikolaou, 2013, “Organization Capital and the Cross-section of Expected Returns,” Journal of Finance 68(4): 1365–1406.
- 9 Mark C. Ubelhart, 2009, “An Economic View of the Impact of Human Capital on Firm Performance and Valuation.” In Rawley Thomas and Benton Gup, eds., 2009, The Valuation Handbook: Valuation Techniques from Today's Top Practitioners. Hoboken, NJ: John Wiley & Sons. This research is discussed in Mark L. Frigo and Mark C. Ubelhart, 2015, “CFO+CHRO=POWER PAIR.” Strategic Finance, November 2015. For a comprehensive literature review of how human capital impacts firm performance see Aaron Bernstein and Larry Beeferman, 2015, “The Materiality of Human Capital to Corporate Financial Performance.” New York: IIRC Institute.
- 10 A study addressed this question: Are differences in inventor productivity due to differences in inventors' skills or differences in the capabilities of the firms where they were employed? The conclusion was: “Our estimates suggest human capital is 4 to 5 times more important than firm capabilities for explaining the variance in inventor productivity.” Ajay Bhaskarbhatla, Deepak Hegde, and Thomas Peeters, 2017, “Human Capital, Firm Capabilities, and Innovation.” SSRN working paper abstract=3081933.
- 11 Mark Klock and Pamela Megna, 2000, “Measuring and Valuing Intangible Capital in the Wireless Communications Industry,” Quarterly Review of Economics and Finance 40(4): 519–532.
- 12 Sinan Aral and Peter Weil, 2007, “IT Assets, Organizational Capabilities, and Firm Performance: How Resource Allocations and Organizational Differences Explain Performance Variation,” Organization Science 18(5): 763–780.
- 13 Massimiliano Bonacchi, Kalin Kolev, and Baruch Lev, 2013, “Customer Franchise—A Hidden, Yet Crucial Asset,” Contemporary Accounting Research 32(3): 1024–1393.
- 14 Luminita Enache and Anup Srivastava, 2018, “Should Intangible Investments Be Reported Separately or Commingled with Operating Expenses? New Evidence,” Management Science 64(7): 3446–3468 and Annete Ptok, Rupinder P. Jindal, and Werner Reinartz, 2018, “Selling, General, and Administrative (SG&A) Expense-based Metrics in Marketing: Conceptual and Measurement Challenges,” Journal of Academy of Marketing Science 46(6): 987–1011.
- 15 Ragiv Banker, Rong Huang, and Ram Natarajan, 2011, “Equity Incentives and Long-term Value Created by SG&A Expenditures,” Contemporary Accounting Research 28(3): 794–830.
- 16 Nigel Hollis, 2008, The Global Brand: How to Create and Develop Lasting Brand Value in the World Market. New York: Palgrave Macmillan, p. 38
- 17 Urooj Khan, Bin Li, Shivaram Rajgopal, and Mohan Venkatachalam, 2018, “Do the FASB's Standards Add Shareholder Value?” Accounting Review 93(2): 209–247.
- 18 Baruch Lev, 2018, “Ending the Accounting-for-Intangibles Status Quo,” European Accounting Review, http://doi.org/10.1080/09638180.2018.152165 28(1): 1–24.
- 19 Robert G. Eccles and Michael P. Krzus, 2015, The Integrated Reporting Movement: Meaning, Momentum, Motives, and Materiality. Hoboken, NJ: John Wiley & Sons, pp. 59 and 99.
- 20 The concept of a Life-Cycle Review was first proposed in Bartley J. Madden, 2007, “For Better Corporate Governance, the Shareholder Value Review,” Journal of Applied Corporate Finance. 19 no. 1 (Winter): 102–114. See also Bartley J. Madden, 2007, “Guidepost to Wealth Creation: Value-Relevant Track Records,” Journal of Applied Finance 17(2): 119–130.
- 21 Howard Schultz, 1997, Pour Your Heart into It: How Starbucks Built a Company One Cup at a Time. New York: Hyperion, pp. 5–6.
- 22 Howard Schultz, 2011, Onward: How Starbucks Fought for Its Life without Losing Its Soul. New York: Rodale, p. 23.
- 23 Rajendra S. Sisodia, David B. Wolfe, and Jagdish N. Sheth, 2007, Firms of Endearment: How World-Class Companies Profit from Passion and Purpose. Upper Saddle River, NJ: Wharton School Publishing, p. 34.
- 24 John Heylar and Ann Harrington, November 24, 2003, “The Only Company Walmart Fears,” Fortune.
- 25 Luke Timmerman, April 29, 2015, “DNA Sequencing Market Will Exceed $20 Billion, Says Illumina CEO Jay Flatley,” Forbes.
- 26 Luigi Guiso, Paola Sapienza, and Luigi Zingales, 2015, “The Value of Corporate Culture,” Journal of Financial Economics 117(1): 60–76.
- 27 Alex Edmans, 2011, “Does the Stock Market Fully Value Intangibles? Employee Satisfaction and Equity Prices,” Journal of Financial Economics 101(3): 621–640. See also James K. Harter, Frank L. Schmidt, and Theodore L. Hayes, 2002, “Business-Unit-Level Relationship between Employee Satisfaction, Employee Engagement, and Business Outcomes: A Meta-Analysis,” Journal of Applied Psychology 87(2): 268–279.
- 28 Robert G. Eccles, Ionnis Ioannou, and George Serafeim, 2014, “The Impact of Corporate Sustainability on Organizational Processes and Performance,” Management Science 60(11): 2835–2857.
- 29 Gordon L. Clark, Andreas Feiner, and Michael Viehs, 2015,. From the Stockholder to the Stakeholder. Smith School of Enterprise and the Environment and Arabesque Partners. Similar conclusions are contained in Gunnar Friede, Timo Busch, and Alexander Bassen, 2015, “ESG and Financial Performance: Aggregated Evidence from More Than 2000 Empirical Studies,” Journal of Sustainable Finance & Investment 5(4): 210–233.
- 30 Eugene F. Fama, 2014, “Two Pillars of Asset Pricing,.” American Economic Review 104(6): 1467–1485.
- 31 E. F. Fama and K. R. French, 1992,. “The Cross-Section of Expected Stock Returns,” Journal of Finance 47(2): 427–465.
- 32 Harvey, Campbell R. and Yan Liu, 2018, “Lucky Factors.” SSRN working paper. https://ssrn.com/abstract=2528780.
- 33 Eugene F. Fama and Kenneth R. French, 2015, “A Five-Factor Asset Pricing Model,” Journal of Financial Economics 116(1): 1–22.
- 34 For an empirically based argument that risk is misunderstood by efficient-market proponents, see Eric Falkenstein, 2012,. The Missing Risk Premium: Why Low Volatility Investing Works. Hoboken, NJ: John Wiley & Sons.
- 35 Charles M. C. Lee and Eric So, 2014, “Alphanomics: The Informational Underpinnings of Market Efficiency,” Foundations and Trends in Accounting 9(2-3): 59–258.
- 36 Robert Shiller, 1984, “Stock Prices and Social Dynamics," Brookings Papers on Economic Activity 2: 457–510.
- 37 Ian D. Gow, David F. Larcker, and Peter C. Reiss, 2016, “Causal Inference in Accounting Research,” Journal of Accounting Research 54(2): 477–523.
- 38 Cooper, Michael J., Huseylin Gulen, and Michael J. Schill, 2008, “Asset Growth and the Cross-Section of Stock Returns,” Journal of Finance 63(4): 1609–1651.
- 39 For an insightful and comprehensive discussion of causality and data analysis, see Judea Pearl and Dana Mackenzie, 2018, The Book of Why: The New Science of Cause and Effect. New York: Basic Books.
- 40 Similar thinking suggests that high asset growth may be related to positive excess returns for firms with demonstrated innovation skill as measured by securing patents. This is, in fact, supported by Kumar, Praveen and Dongmei Li, 2016, “Capital Investment, Innovative Capacity, and Stock Returns,” Journal of Finance 71(5): 2059–2094. For a discussion of how Walmart's sustained 20% plus asset growth rates from 1979 to 1989 contributed to its stock outperforming the market 13-fold see Bartley J. Madden, 2016, Value Creation Thinking. Naperville, IL: LearningWhatWorks, pp. 131–133.
- 41 Ken Iverson, 1998, Plain Talk: Lessons from a Business Maverick. Hoboken, NJ: John Wiley & Sons, pp. 98 and 105–106.
- 42 Lauren Cohen, Karl Diether, and Christopher Malloy, 2013, “Misvaluing Innovation,” Review of Financial Studies 26(3): 635–666.
- 43 Aaron K. Chatterji and Kira R. Fabrizio, 2016, “Does the Market for Ideas Influence the Rate and Direction of Innovative Activity? Evidence from the Medical Device Industry,” Strategic Management Journal 37(3): 447–465.
- 44 Martijn Cremers and Ankur Pareek, 2016, “Patient Capital Outperformance: The Investment Skill of High Active Share Managers Who Trade Infrequently,” Journal of Financial Economics 122 (2): 288–306. See also Brad M. Barber and Terrance Odean, 2000, “Trading Is Hazardous to Your Wealth: The Common Stock Investment Performance of Individual Investors,” Journal of Finance 55(2): 773–806.
- 45 For many years at Callard Madden & Associates I worked with Bob Hendricks on corporate consulting assignments, and later joined Bob at HOLT Value Associates prior to the firm being acquired by Credit Suisse. Bob was a master communicator and especially skilled at explaining corporate performance and valuation issues to top managements and boards of directors.
- 46 Christopher D. Ittner, 2008, “Does Measuring Intangibles for Management Purposes Improve Performance? A Review of the Evidence,” Accounting and Business Research 38(3): 261–272.
- 47 That most reported accounting-based return anomalies are spurious was documented in Juhani T. Linnainmaa and Michael R. Roberts, 2016, “The History of the Cross Section of Stock Returns.” NBER Working Paper 22894, http://www.nber.org/papers/w22894. See also Campbell R. Harvey, Yan Liu, and Heqing Zhu, 2015, “… and the Cross-Section of the Expected Returns,” Review of Financial Studies 29(1): 5–68.
- 48 Chapter 7 of Bartley J. Madden, 2016, Value Creation Thinking. Naperville, IL: LearningWhatWorks discusses the major issues in measuring economic returns (e.g., CFROI) that are displayed as a time series. For a history of the CFROI development see Bartley J. Madden, 1999. CFROI Valuation: A Total System Approach to Valuing the Firm. Oxford: Butterworth-Heinemann. See Timo Salmi and Ilkka Virtanen, 1997, “Measuring the Long-Run Profitability of the Firm: A Simulation Evaluation of the Financial Statement Based IRR Estimation Methods,” Acta Wasaensia No. 54.
- 49 H. Thomas Johnson, “Lean Dilemma: Choose System Principles or Management Accounting Controls—Not Both.” In Joe Stenzel, ed., 2017, Lean Accounting Best Practices for Sustainable Integration. Hoboken, NJ: John Wiley & Sons.
- 50 H. Thomas Johnson and Anders Bröms, 2000, Profit Beyond Measure: Extraordinary Results through Attention to Work and People. New York: Free Press.
- 51 See Chapter 3 of Bartley J. Madden, 2014, Reconstructing Your Worldview: The Four Core Beliefs You Need to Solve Complex Business Problems. Naperville, IL: LearningWhatWorks.
- 52 From the Foreword to Chalmers Brothers, 2005, Language and the Pursuit of Happiness. Naples, FL: New Possibilities Press.
- 53 Dan Jones and Jim Womack, 2011, Seeing the Whole Value Stream. Cambridge, MA: Lean Enterprise Institute. The authors note: “We drew the path of a humble cola can. This simple product with only three parts (barrel, top, and ‘pop-top’) traveled 319 days through nine facilities owned by six companies in four countries to progress from ore in the ground into the hands of the customer. Yet during this long march only three hours of value-creating activities were performed and the great majority of the steps—storing, picking, packing, shipping, unpacking, binning, checking, reworking, and endless movements of information to manage the system's complexity—created no value at all.”
- 54 Robert S. Kaplan and David P. Norton, 1996, The Balanced Scorecard: Translating Strategy into Action. Boston: Harvard Business Press, p. 31.
- 55 Robert S. Kaplan and David P. Norton, 2008, The Execution Premium: Linking Strategy to Operations for Competitive Advantage. Boston: Harvard Business Press.
- 56 Jeffrey K. Liker, 2004, The Toyota Way: 14 Management Principles from the World's Greatest Manufacturer. New York: McGraw-Hill, p. 64.
- 57 Eric Noreen, Debra Smith, and James T. Mackey, 1995, The Theory of Constraints and Its Implications for Management Accounting. Great Barrington, MA: North River Press.
- 58 Brian Maskell and Nicholas Katko, “Value Stream Costing: The Lean Solution to Standard Costing Complexity and Waste.” In Joe Stenzel, ed., 2007, Lean Accounting: Best Practices for Sustainable Integration. Hoboken, NJ: John Wiley & Sons.
- 59 David Solomons, 1965, Divisional Performance: Measurement and Control. Homewood, IL: Richard D. Irwin.
- 60 G. Bennett Stewart, 1991, The Quest for Value. New York: HarperBusiness. EVA is a registered service mark of Stern Value Management, Ltd. (originally by Stern Stewart & Co. in 1994) for financial management and consulting services in the area of business valuation, and is registered as a trademark by Institutional Shareholder Services Inc. (originally by EVA Dimensions LLC in 2008) for a number of uses.
- 61 For a discussion of some of the measurement problems with EVA, see Greg Milano, 2019, “Beyond EVA,” Journal of Applied Corporate Finance 31(3): 116–125. The author explains the advantage of a return measure based on gross assets, as used in the CFROI calculation. The problem with using a return measure based on net assets, as used in the EVA calculation, is that as assets age their accumulated depreciation charges rise. This produces a declining net asset amount thereby artificially boosting the calculated return on net assets and EVA.