CHAPTER 4
Decision Analysis: Architecting Decisions
In their 2012 study, Andrew McAfee and Erik Brynjolfsson found that “companies in the top third of their industry in the use of data-driven decision making were, on average, 5% more productive and 6% more profitable than their competitors.”
In this book we focus on data-driven decisions over process because we believe it is the anchor point that drives actions. If we focus on process alone, we miss what is truly driving a person's ability to act, which is the ability to make a quality decision. This viewpoint is further elaborated on in Brad Power's article, “Drive Performance by Focusing on Routine Decisions,” where he states:
Later in the article he quotes Rob Moon:
In this chapter we introduce the tools and techniques to conduct your Decision Analysis to empower managers with data-driven decisions. The Lego pieces you choose to bring together may vary depending on the business problem and type of analytics. At the heart of this phase in the methodology are six components: Category Tree, Question Analysis, Key Decisions, Data Needs, Action Levers, and Success Metrics. These techniques help you elicit and gather requirements for your analytical solution.
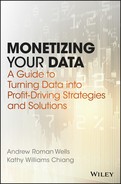
Before we discuss the techniques, let's review where we are in the methodology. Figure 4.1 is the Decision Architecture methodology with the Decision Analysis as the second phase. Note that this is the beginning of an iterative cycle between Decision Analysis, Agile Analytics, Monetization Strategy, and Enablement. We find ourselves cycling back and forth between these phases. For example, if you have a requirement for a certain metric in the Decision Architecture phase but are unable to source the data during the Data Development process step, you may decide to briefly cycle through the Decision Analysis phase again to gather a new set of metrics.

Figure 4.1 Decision Architecture: Decision Analysis Phase
Category Tree
Let's start our discussion with the Category Tree, which serves as our story for how an executive will leverage our analytical solution. The Category Tree is a grouping of like questions and decisions fit into a business context. It is a hierarchical structure that provides the subjects or topics that the manager will want to analyze codified into the Inform > Diagnose > Action > Measure framework. For example, if many of the questions we are uncovering during requirements involve knowing the performance of a particular division, we will want to group those questions together into a category node called “Performance.”
We will cover the Category Tree several times within the Decision Analysis phase. The first time relates to scoping the project and structuring working sessions and interviews to draw out requirements. We cover it a second time after we complete the Question Analysis and Key Decisions process steps when we have additional information to help us complete a fuller picture of the Category Tree. The last time we address it is to finalize its structure when we bring all of the requirements together to develop our solution.
To determine the groupings and structure for the Category Tree, we review existing reports, conduct interviews, and/or facilitate workshops. We find the interviews and working sessions in the Discovery phase are a great place to start.
Let's begin with an example of the Edison Car Company, which wants to use the Decision Architecture methodology to build an analytical solution that helps them increase revenue 10 percent over last year.
In performing our discovery process we develop two hypotheses that are still a little vague at this point, but help us start our journey. The two hypotheses are:
- Increase revenue through targeted promotional campaigns.
- Drive revenue through data science helping to understand out-of-stock incidents and inventory levels.
In our discovery interviews, we ask several questions to understand how they solve various issues and opportunities related to our hypotheses. We are able to determine that the first set of questions they ask are related to how the company is performing from an overall sales perspective. Next, they drill into specific product lines looking for trends, and finally they look at product sales by geography.
From there we ask for common analytics that they currently perform. We find they do a lot of work to diagnose issues with their “Budget to Forecast” sales figures to see if they are on target for the year. “Pricing” is another area they spend time analyzing the optimal price for a particular product line. Finally, we uncover an “Inventory” diagnostic where they look into the supply chain to provide visibility to manufacturing on the number of cars they are selling, overall demand, out-of-stock issues, and excess inventory.
From our Discovery phase, we were able to compose the Category Tree in Figure 4.2 aligned to the Inform and Diagnose stages in the Analytical Cycle.

Figure 4.2 Edison Car Company Category Tree
With the Category Tree in place we have a general scope for the project. In the Decision Analysis phase, we structure sessions for each node to continue to develop the tree. Our first session focuses on Performance with the goal of uncovering the Questions, Decisions, Actions, and Metrics they currently ask themselves when solving for an opportunity or issue. The techniques in the following sections help us unearth each of these components and provide a structure for capturing them.
The Category Tree is broken out into the Inform and Diagnose stages. We label nodes 1 through 3 as part of the Inform stage and nodes 4a to 4c as part of the Diagnose stage. The first part of the tree structure is hierarchical and then breaks out into various branches once the diagnostics process begins. This is not always the case, as the branches may occur during the Inform stage as well.
When navigating the tree, we begin with the Inform stage, asking questions about Performance of the company. The managers use the topic Performance to understand how well they are doing relative to their goals. An example of the questions might be the following:
| Q1: Are sales down for the United States, Canada, or Mexico? | (Sales/High-Level Geography) |
| Q2: What product lines were down for the month? | (Product/Time) |
| Q3: What regions were sales down for? | (Sales/Detailed Geography) |
Once we answer these three questions, the manager may want to break off to perform specific diagnostics. A diagnostic is a specific component of the analytical solution with a narrow focus on solving a specific issue. Examples of a diagnostic include:
- D1: Pricing—Should we increase the price for the Electric car product line?
- D2: Inventory—Should we slow down production for the SUV product line?
We see that in the diagnostic realm, the questions turn to decisions. This is a vital component we use when we map actions to specific diagnostics.
Question Analysis
When trying to understand how a manager utilizes information to make a decision, we need to understand the questions they ask themselves. The questions, along with decisions, are the threads that guide the manager through the Decision Analysis phase. In the Question Analysis process step, our goal is to elicit the questions the manager asks when trying to solve an opportunity or issue.
Before going into the Question Analysis process, let's cover types of questions that we ask to facilitate the process of gathering questions. The techniques we use most often are the following:
- Open Ended—These questions are typically broad-based questions designed to elicit a range of responses. Examples: Tell me about how you measure sales productivity. What are the top 3–5 questions you ask yourself to understand opportunity in your area?
- Closed Ended—These questions are designed to shut down a conversation or get to a final answer. They are often yes-or-no questions or asking for a final result. Example: Do you measure sales productivity as Number of Total Units Sold or Total Revenue amount?
- Clarifying—These are usually statements of fact that one is looking to validate or leverage to continue a deeper line of questioning. Examples: Is sales productivity only measured in the Number of Total Units Sold metric? What did you mean when you said the competitor metric is correlated to units shipped?
- Root Cause—This question type is one of our favorites for soliciting questions. The premise of this type of questioning is to find if there are a deeper set of issues or concerns for a particular symptom or line of reasoning. It entails asking 5–7 questions in succession around a particular topic to uncover the root cause of an issue. We'll provide an example of a root cause question later in this section.
We think the most important factor when asking questions is to just be curious. Take a keen interest in the interviewee's business problems, issues, decisions, and actions. You do not have to become the expert, but it helps to get a deep understanding of how their business works, their role, and how they utilize data.
An interview that deconstructs the Question Analysis for a role is usually the starting place for the exercise. To elicit the questions, one can review existing reports, conduct interviews, or facilitate workshops.
When eliciting questions from the user, we find it useful to stick with a particular subject thread and perform a root cause analysis. This usually entails asking a series of questions, five to seven of them, that drill into a particular subject area. For example, let's look at a root cause analysis for the Edison Car Company.
With a problem statement presented, we perform a working session to uncover the questions, decisions, actions, and metrics. We guide this process with a root cause analysis of questions and answers. The following is a set of questions the managers ask themselves, along with associated answers, when diagnosing the issue:
- Example Problem Statement: Sales for North America are down last month in March for the Edison Car Company.
- Q1: Are sales down for the United States, Canada, or Mexico?
- Answer 1: US is down by 2 percent, Canada is flat, and Mexico is slightly up.
- Q2: What product lines are down for the month?
- Answer 2: Sedan, Economy, and mostly SUV.
- Q3: Which regions were sales down for?
- Answer 3: Northeast is 5 percent off forecast for March, which is the biggest offender.
- Q4: Were there any seasonal concerns, events, or weather issues last month for the Northeast?
- Answer 4: There was a blizzard in the Northeast that shut down several cities for the second week of the month.
- Q5: Which product line's sales were hurt the most by the blizzard?
- Answer 5: We normally sell 500 SUVs in that region in a given month; we sold only 350 due to the weather issue.
As you can see, after about five questions, we are able to get to the root cause of the sales issue for the month. We are also able to glean how the team thinks through the process of troubleshooting issues. They go from performance at an overall level, to product, to geography before they diagnose the weather as the root cause. You can see how something informational is turned into the start of a diagnostic exercise.
The root cause analysis helps us determine current state. We want to challenge this to make sure it is the best approach as well as iterate through additional questions and decisions that a manager might ask as we compose our final solution.
To continue our example, what can we decide from this line of questioning? We might determine to slow down production in order to not overproduce given the drop-off in sales. We may also start looking into moving some of the inventory in the region to other regions. However, just looking at sales figures during this snapshot in time might be a false indicator. Let's see what happens when we add data science and metrics to the process with two additional questions.
- Q6: What is the Actuals Sales to Forecast Indicator (AFI) for the region year-to-date?
- Answer 6: The AFI is reading .98, which equates to 98 percent of actuals to budget.
- Q7: What is the Product Velocity Metric (PVM) for the region?
- Answer 7: The PVM reads 1.05, which means that the volume has been increasing for the past three months and is forecasted to accelerate over the next two months.
When we add Data Science to the process, the conclusion changes. We see two important data points that are hidden if we only look at the raw sales numbers.
First we see that our forecast to budget looks good through the AFI metric with our actual sales at 98 percent to our forecast. This tells us that we had a great January and February, but March was the issue due to the weather. This leads us to conclude that the event is probably an anomaly.
The next metric, PVM or velocity, is really interesting. PVM tells us that volume of sales had actually been on the increase until the incident in March.
It is interesting how the conclusions change with a few key metrics in place to provide a broader context of performance of the region over a period of time versus a single snapshot in time.
Let's start to record our results in the Decision Architecture template:
| Business Objective | Increase revenue by 10 percent over last year using Decision Architecture methodology. |
| Hypothesis | Increase revenue through targeted promotional campaigns. Drive revenue through data science helping to understand out-of-stock incidents and inventory levels. |
| Decision Architecture | |
| Questions |
|
| Decisions | TBD |
| Metrics | TBD |
| Actions | TBD |
Key Decisions
Another key process step in the Decision Analysis phase is to understand the types of decisions that the manager needs to make on an ongoing basis. Key Decisions help us understand what a manager will do with the information. Will the analyst act on a piece of information or is it just a nice-to-have metric? Will the information drive a particular action or event?
Typically, at the end of our Question Analysis, we have enough information to start to tease out decisions based on the answers to the questions. For example, from our working sessions we uncover a great set of questions as well as the following decisions that the team may make:
-
Should we increase marketing spend for the Northeast Region?
With the Actuals Sales to Forecast Indicator (AFI) metric of 98 percent, we decide to increase our marketing budget for the Northeast to assist in making up for our deficit by offering a dealer rebate to generate additional sales. The AFI metric is a key indicator for us to determine marketing spend. Since we are below forecast, the region needs more energy in order for sales to catch up to plan.
-
Should I redirect inventory from the Northeast to other regions?
Based on the information provided in the last section, we decide to redirect new inventory shipments of SUVs to other regions until current capacity levels decrease in the Northeast. However, we know that Product Velocity Metric (PVM) is increasing and need to dig more to determine if this is a good decision and for which product lines.
By leveraging the root cause analysis questions technique, you can drill into the opportunity or issue until you arrive at a decision that leads to an action. We are also able to uncover the metrics that drive each of the decisions, which are important pieces of information.
What is interesting about this approach is that we are able to elicit the actions associated with the decisions. This will help us build out the overall Decision Analysis to tie together the pieces of Inform, Diagnose, and Action. There will be more to come on this topic.
Another approach to finding the Key Decisions is to start by asking the manager about the major decisions they make on a routine basis. If we perform the exercise of Key Decisions without performing a Question Analysis first, the path might be a little different. What we are looking to gather is the top five to eight Key Decisions the person wants to make to perform effectively in their role. For example, we ask the interviewee what are the Key Decisions they make when thinking about Sales for North America.
Subject Area: Sales for North America
- Key Decision 1—Should I increase or decrease marketing spend?
- Key Decision 2—Should I change my sales forecast to slow down or increase production for a particular product line?
- Key Decision 3—Should we develop any specific rebates or promotions to help increase sales?
- Key Decision 4—Should I talk to specific salespeople about their performance?
- Key Decision 5—Should I go on a dealer roadshow to boost sales performance?
For each of the decisions, try to understand if there is a key piece of information or metric that would drive the decision. If not, keep probing using a root cause analysis to unearth the metric. For example, let's deconstruct Key Decision 1.
Key Decision 1—Should I increase or decrease marketing spend?
-
Q1: What would help you determine whether to increase or decrease marketing spend?
Answer: There are several factors that might help me with the decision:
- AFI for the region by product line
- New promotional events that are not on the marketing calendar
- Specific dealer issues or promotions
- Product issues
- Safety emergency events
-
Q2: What would you look for in the AFI metric to determine the allocation of marketing spend?
Answer: If AFI was down for a particular product line we might decide to run a campaign to help boost vehicle sales for that region.
-
Q3: What level would the indicator need to read to tell you there is an issue?
Answer: If AFI was more than 5 percent off, we would probably want to look deeper and take actions.
The approach with Decisions as the primary driver for decomposing the Key Decisions leads us to a very similar place as the Question Analysis process. Here again we see that AFI is an important metric for the Edison Car Company and a major lever they pull when the need to make up a revenue gap arises.
Let's fill in more of our Decision Architecture document with the decisions we have gathered:
| Business Objective | Increase revenue by 10 percent over last year using Decision Architecture methodology. |
| Hypothesis | Increase revenue through targeted promotional campaigns. Drive revenue through data science helping to understand out-of-stock and inventory levels. |
| Decision Architecture | |
| Questions |
|
| Decisions |
|
| Metrics | TBD |
| Actions | TBD |
At this point, we have more information to fill out our Category Tree with a fuller set of diagnostics. From the line of questions in the prior section, we can see a general pattern beginning. As you interview 4, 5, 6+ people, the pattern begins to become more apparent. From our interviews so far, we add several new diagnostics to the Category Tree (see Figure 4.3).

Figure 4.3 Edison Car Company Category Tree: Diagnostics
Data Needs
One of the major outputs of the Question Analysis and Key Decisions process steps are the data sources necessary to answer the questions. This is a valuable piece of information that we derive from the techniques. We also use this information to start our data analyst looking into the various systems to see if good-quality data exists to support an analytical solution, specifically the questions, decisions, and metrics.
Based on the data review, we may decide to add elements to our Decision Analysis or remove them due to lack of data or data-quality issues. Without the right data or quality data, we are not able to perform the analysis to develop our analytical solution. Our suggestion is to repeat this process step once you finish each session to determine if you have the right data to support the analysis.
In our example, we determine we need the following data subject areas for our data analyst to source:
- Sales data
- Product data
- Budget data
- Forecast data
- Pricing data
- Inventory data
- Marketing spend data
- Dealer data
- Salesperson data
This information may come from one place, like an enterprise data warehouse, or from other reporting systems that house your Sales or Financial data. Since the data analyst has a big job on their hands with these types of projects, this role is engaged very early on in the life of the project.
In the Data Needs process step, we try to challenge the business in their current thinking about what data they have available to them. There is the ability to purchase external data as well as leverage unstructured data. An example of this comes from Harvard Business Review Analytical Services, which published the article, “Analytics That Work: Deploying Self-Service and Data Visualization for Faster Decisions.” The article is based on a survey conducted with over 827 business managers and posits:
A good example of using unstructured data comes to us from the luxury hotel business. In this case study, hotel management was spending their time and energy focused on making their dinner service to be a fine dining experience on which to build the hotel's reputation. Leveraging social media information and text mining, they discovered that breakfast is the most important meal when travelers choose hotels. In her article, “Using an Algorithm to Figure Out What Luxury Customers Really Want,” Ana Bryant says,
This is a powerful example of how stretching the current sources of data to include external unstructured data leads to a change in strategy for the hotel. One of our goals as a decision architect is to work with the managers and analyst to understand their current situation and challenge them on new techniques and methods that analytics and data can provide.
Action Levers
The actions, or Action Levers, are the output of a decision. What is interesting about this exercise is that by understanding someone's decisions we are able to quickly see what levers the person has available to manage their business. The decisions they make and actions that stem from these decisions drive their business results.
From the working session in our example, we were able to determine that the manager has three main levers to effect change in their role:
- Production—Slowing down or increasing via sales forecast
- Marketing Spend—Rebates, promotions, advertising, dealer roadshow
- Sales Management—Working with sales teams to drive deal volume
Actions are an important component of the methodology as we want our analytical solutions and monetization strategies to be actionable. If our solution simply provides good information, we have missed the mark.
In the working session we identify the important pieces of information we need to take action for each decision. It is important that we drive down to this level of detail in our working sessions to understand the Action Levers available to the manager to determine how to best align metrics with each of the actions.
We make note of the Action Levers when we hear them raised during the interviews or working sessions. If Action Levers are not surfacing, we push for them when we discuss the Key Decisions. For example, if we are not getting the actions associated with the decision, we ask the following question:
-
Q: What are the key business levers you have at your disposal in order to drive actionable results?
Answer: I have four main levers that I can pull to influence the results of my role:
- Production—Slowing down or increasing via sales forecast
- Marketing Spend—Rebates, promotions, advertising, dealer roadshow
- Sales Management—Working with sales teams to drive deal volume
- Pricing—Working with our revenue management team to change the pricing structures
By asking the question, we uncover a fourth important lever, Pricing. These are four powerful Action Levers that we want to dig deeper into to understand how our analytics can support the decisions associated with them.
Action levers should tie back to business levers that drive the monetization strategy. If we are unable to map our selected action levers to a business lever, we need to revisit the decisions we are solving for to determine if it is the right set of decisions. We discuss business levers in further detail in the Monetization Strategy chapter (Chapter 5) of this book.
Success Metrics
Success Metrics help drive an organization's decisions. In this section we refer to metrics as something that drives a decision or something that we can measure. We use the word success because an organization can flood itself in measuring every aspect of the business. In our experience the top 10 to 15 metrics make the difference and should be used to drive behavior; otherwise we can quickly get lost in the noise.
When managers attempt to use a large number of metrics to manage their business, more often than not, analysis paralysis sets in and the value of each additional piece of information diminishes. This is true, especially, in the Inform stage of the analysis. Additional metrics may come into good use during the Diagnose stage when trying to pinpoint specific issues, but outside of specific diagnostics, less is more. There is a lot of eloquence in simplicity.
We need to ask ourselves, does the metric drive any action or measurement? If not, it is probably just informative and should be reconsidered. Our key point is to rationalize our metrics to the top 10 to 15 that are the most impactful and directly related to the business problem we are trying to solve.
In the example above, we use two Success Metrics:
- Actuals to Forecast Indicator (AFI)—The AFI helps to quickly identify if actuals are meeting forecast. This metric is simple math, but helps managers determine if they are on or off target with a single number versus doing the math in their head.
- Production Velocity Metric (PVM)—The PVM metric is based on data science and provides the information user with an understanding of the direction of production volume. The indicator is a moving average of the last three months, helping a user understand if things are trending up or down. In addition, it has a forward-looking component, leveraging the last three months to forecast the next two months to determine the upcoming trend. The data gets really interesting at this point; it can help a manager determine if the velocity of production will increase or slow down in the weeks ahead. This demand signal might affect several decisions and would need to be watched closely.
Thresholds are another key concept we cover in detail in the Data Science chapter (Chapter 9). We discuss them at a high level here because thresholds help bring metrics to life. They assist the manager or analyst in determining when metrics fall outside a normal or expected distribution and require a closer look. Thresholds are the signal for action.
Thresholds enable a manager to focus on the metrics with a signal that points to an issue or opportunity and not divert valuable attention to metrics that are going well.
In our Success Metrics above, examples of thresholds might include the following:
- Actuals to Forecast Indicator (AFI)—After analysis by the data scientist, we determine the threshold for the AFI is 5 percent of forecast. Therefore, we want a signal that indicates when the AFI is outside of this range, telling the information user to look further into this issue.
- Product Velocity Metric (PVM)—The PVM might have a higher or lower tolerance due to the variance for a particular product line or production schedule. The PVM may not read out of variance until you reach 1.1 or .9 (a 10 percent variance) for a particular car product. However, at an aggregate product level, the tolerance might be tighter, closer to a 5 percent variance, or 1.05/.95.
The individual threshold may be a combination of insights from the data found by the data scientist and/or subject matter experts. In addition, thresholds are rarely one-size-fits-all. The data scientist will need to perform an analysis to determine if the threshold for a particular product line or geography can be set to a standard or if it should be modified due to unique circumstances. We do not want to throw off a false positive with a threshold that is too narrow or broad in a particular instance.
Now, let's finish our Decision Architecture template to make sure we have captured all of our requirements.
| Business Objective | Increase revenue by 10 percent over last year using Decision Architecture methodology. |
| Hypothesis | Increase revenue through targeted promotional campaigns. Drive revenue through data science helping to understand out-of-stock and inventory levels. |
| Decision Architecture | |
| Questions |
|
| Decisions |
|
| Metrics |
|
| Actions |
|
This may not be the complete set of requirements but it is a good start. As we meet with more managers, analysts, and subject matter experts, we will get a fuller set of requirements.
Category Tree Revisited
Let's continue on with our Category Tree, having completed requirements for the Decision Architecture. We go through two exercises to accomplish this task. First we map our Success Metrics, Question Analysis, Key Decisions, and Action Levers to each of the applicable categories on the tree. Second we map the Category Tree to dashboards to gain an understanding of how many dashboards we want to develop in our automated solution. This process may require many iterations. The end product of this alignment is our roadmap for development.
Let's use the example of the Edison Car Company to map the questions, decisions, metrics, and actions to the Category Tree. Below is the list from our requirements documentation that we have developed in the last few sections:
- Questions (Q)
- Q1: Are sales down for the US, Canada, or Mexico?
- Q2: What product lines are down for the month?
- Q3: Which regions were sales down for?
- Q4: Were there any seasonal concerns, events, or weather issues last month for the Northeast?
- Q5: How much did the blizzard impact sales volume for the month for SUV product line?
- Q6: What is the Actuals Sales to Forecast Indicator (AFI) for the region year to date?
- Q7: What is the Product Velocity Metric (PVM) for the region?
- Key Decisions (D)
- Key Decision 1—Should I increase or decrease marketing spend?
- Key Decision 2—Should I change my sales forecast to slow down or increase production for a particular product line?
- Key Decision 3—Should we develop any specific rebates or promotions to help increase sales?
- Key Decision 4—Should I talk to specific salespeople about their performance?
- Key Decision 5—Should I go on a dealer roadshow to boost sales performance?
- Key Decision 6—Should I redirect inventory from the Northeast to other regions?
- Success Metrics (SM)
- SM1: AFI—Actuals to Forecast Indicator
- SM2: PVM—Product Velocity Metric
- Action Levers (AL)
- AL1: Production—Slowing down or increasing via sales forecast
- AL2: Marketing Spend—Rebates, promotions, advertising, dealer roadshow
- AL3: Sales Management—Working with sales teams to drive deal volume
- AL4: Pricing—Working with our revenue management team to change the pricing structures
Taking all of these items together, we have the Decision Architecture. From Figure 4.4 we can see the mapping of the various questions, decisions, actions, and metrics to Category Tree.

Figure 4.4 Category Tree Mapped to Questions, Decisions, Metrics, and Actions
In Figure 4.4 we observe several Questions (Q), Decisions (D), and Metrics (SM) that get repeated often. We also notice a new section added to the Category Tree, our Actions. Each of the actions is aligned to a particular diagnostic that is focused on helping the manager make a particular decision.
When we go through the process of aligning each of the elements to the Category Tree, we test each item to assess if it is truly a fit and drives an action. For example, when going deeper into the Pricing diagnostic, we may decide to include five additional metrics necessary for a complete diagnosis. At the same time, we take out metrics that are no longer needed. The decision architect, subject matter experts, and team cycle through an iterative process to get the best analytical solution by adding and removing elements to each node in the tree. Once the elements of the Category Tree come to life on a dashboard, the manager may choose to make additional revisions. At this point they are better able to determine if the right elements are in place to solve the purpose of that node in the Category Tree.
If the plan is to automate the analysis, an important point to consider is that each node may map to an individual dashboard or many dashboards. Figure 4.5 is an example of this type of mapping.

Figure 4.5 Category Tree Mapped to Dashboards
The number of nodes in a Category Tree can map one to one with the number of dashboards or can be many to many. For example, in Figure 4.5 we see that nodes 1 and 2 in the Inform stage map to one dashboard, Sales/Product dashboard, while node 3 maps to one dashboard, Geography dashboard. In addition, node 4a maps to two dashboards, Actuals to Forecast dashboard and Budget to Forecast dashboard. We take our cues from the Category Tree when assembling the dashboards, but it is not always a direct one-to-one relationship.
Summary
We covered a lot of ground in this chapter and it could easily be its own book. We reviewed the components of the Decision Analysis phase: Category Tree, Question Analysis, Key Decisions, Success Metrics, and Action Levers. These components make up your Decision Architecture.
The process of composing your Decision Architecture takes practice and may not be apparent when you first start the interview process. Our recommendation is to get through all of the interviews, take copious notes, and assemble your initial thoughts on the Category Tree and Decision Architecture template from the elements you collect.
If they are not fitting together, develop a few straw models to run by your SMEs for counsel. After you have created a model you feel is worth sharing, hold a working session with the stakeholders to review. It is helpful to repeat often and early. In addition, it is helpful to narrow the scope of subject areas to get quick wins to begin gaining momentum.