
Chapter 7
Technology Considerations
THE FOLLOWING ITIL INTERMEDIATE EXAM OBJECTIVES ARE DISCUSSED IN THIS CHAPTER:
- ✓ Service automation
- ✓ Service interfaces
 To do well on the exam, you must ensure that you understand the concepts associated with service automation and service interfaces. You will need to demonstrate that you can apply these concepts to the scenarios by analyzing the information provided in the exam questions.
We also include a brief look at service analytics.
Service Automation
We automate processes and activities because automation offers significant advantages when compared with doing the same things manually. Automated systems can be much faster, and they can work without breaks or holidays. They are also consistent, performing the same task in exactly the same way over and over, as compared to human operators who may have different approaches, make mistakes, and so on. Automation can therefore have a significant impact on the performance of service assets such as management, organization, people, process, knowledge, and information. Many processes that used to be handled by human operators are now performed by software-based service agents, made possible by advances in technology.
For example, a chatbot is a computer program designed to simulate an intelligent conversation with one or more human users. Chatbots are often integrated into dialog systems for purposes such as offline help. Some chatbots use sophisticated natural language processing systems, but many simply scan for keywords within the input and pull a reply with the most matching keywords, or the most similar wording pattern, from a textual database.
Automation can offer many benefits, improving the utility and warranty of services:
- It is easier to adjust capacity to automated resources in response to variations in demand volumes than to train staff, who may not then be required.
- As stated previously, automated tools help to eradicate human error and have fewer restrictions on time of access; they don’t sleep, eat, get sick, or take holidays.
- They present a standardized service, making measurement easier because there are not the variations that humans bring to an interaction. For example, a voice-activated system to confirm identity and then reset a password will take the same time every time. The time to do this by calling a service desk could vary greatly.
- The volume of calculations required for areas such as load balancing in capacity management, and the speed at which these calculations must be done, is beyond the capacity of human agents.
- Automated processes can be used to gather information in a consistent manner and then to distribute it as required. This overcomes the issue of knowledge being lost when employees move within the organization or permanently leave.
Used with care, automation of service processes helps improve the quality of service, reduce costs, and reduce risks by reducing complexity and uncertainty.
Automation and Service Management
The following are some of the areas where service management can benefit from automation:
- Design and modeling
- Service catalog, including self-service request fulfilment
- Pattern recognition and analysis, used in event management to correlate events, for detection, and monitoring of events
- Classification, prioritization, and routing, as used in service desk systems
- Detection and monitoring
- Optimization in capacity management
As we have already remarked, people do not work at a consistent level. Their performance can be affected by the workload, their motivation, and the nature of the task at hand (easy but boring, for example); different staff will have different knowledge, skills, and experience affecting their productivity. These factors can lead to inconsistent processing times, which in turn may result in degradation of service levels, as shown in Figure 7.1. Standardizing processing time by removing the “human factor” will reduce variation and prevent service level degradation.

Figure 7.1 Degrading effect of variation in service processes
Copyright © AXELOS Limited 2010. All rights reserved. Material is reproduced under license from AXELOS.
Preparing to Automate
Automation should be introduced with care. Although introduced to improve service, a failed attempt at automating something can be a source of customer dissatisfaction and poor staff morale. The simpler the process, the easier it is to automate and the smaller the chance of error, so processes should be simplified before being automated. Removing unnecessary steps may itself reduce performance variations because there are fewer steps to go wrong. Simplification does not mean degradation; unnecessary steps may be removed, but the process should still deliver the same end result, with the same quality of output.
There are limits to simplification. When the process cannot be simplified any further, it is appropriate to start to consider how to automate it.
When automating a process, ensure that the activities, allocation of tasks, required information, and interactions are all fully understood. All users of the automated service should be clear about the required inputs. Automate, clarify, test, modify, and then automate again.
Self-service can hide the underlying systems and processes from the user; the interface should be simplified so that users see only the attributes needed to present demand and extract utility.
Remember, complex tasks, or those with significant variations in terms of inputs, resources, and outcomes each time, may not be suitable for automation. The greatest advantage in terms of efficiency gains will come with automating simple but frequent tasks; automating a complex task will require more effort, which may not be justified if the task is performed only rarely.
Service Analytics
Information is necessary but not sufficient for answering questions such as, Why is the data as it is? and How is it likely to change in the future?
Information is static. It only becomes knowledge when placed in the context of patterns and their implications. By understanding patterns of information, we can answer questions such as these: How does this incident affect the service? How is the business impacted? How do we respond?
This is service analytics.
To understand means to put it in context. Analysis produces knowledge; then synthesis provides understanding. You should remember the data, information, knowledge, wisdom (DIKW) model from your Foundation course; it is illustrated in Figure 7.2.

Figure 7.2 The flow from data to wisdom
Copyright © AXELOS Limited 2010. All rights reserved. Material is reproduced under license from AXELOS.
Data alone does not answer any questions, but it is a vital resource. Most data collection is carried out by using instrumentation to measure the behavior of the infrastructure elements. These tools report actual or potential problems and provide feedback after adjustments. Most organizations already have tools for measuring infrastructure elements, similar to those in Table 7.1.
Table 7.1 Instrumentation techniques
| Technique | Action |
| Asynchronous capture | Passive listeners scan for alerts. |
| External source | Compile data from external sources, such as service desk tickets, suppliers, or systems—e.g., enterprise resource planning (ERP). |
| Manual generation | Manually create or alter an event. |
| Polling | Monitoring systems actively interrogate functional elements. |
| Synthetic transactions | Simulate the end user experience through known transactions. |
Copyright © AXELOS Limited 2010. All rights reserved. Material is reproduced under license from AXELOS.
Instrumentation provides raw data, but the behavior of a service is impacted by a combination of elements working together. We need to understand the context to understand the actual relevance of any data.
Information is the understanding of the relationships between pieces of data. Information answers four questions: who, what, when, and where? Event management refines the data from instrumentation into those that require further attention. Both instrumentation and event management share the goal of creating usable and actionable information. Table 7.2 describes common event management techniques.
Table 7.2 Event management techniques
| Technique | Action |
| Compression | Consolidate multiple identical alarms into a single alarm. |
| Correlation | See if multiple alert sources occurring during a short period of time have any relationship with each other. |
| Filtering | Apply rules to a single alert source over some period of time. |
| Intelligent monitoring | Apply adaptive instrumentation. |
| Roll-up | Compress alerts through the use of hierarchical collection structures. |
| Verification | Actively confirm an actual incident. |
Copyright © AXELOS Limited 2010. All rights reserved. Material is reproduced under license from AXELOS.
A fault is defined as an abnormal condition that requires action to repair, while an error is a single event. A fault is usually indicated by excessive errors. Event management will monitor for thresholds being breached (an alert) or for a significant change of state (an event) of a configuration item.
Performance, however, is a measure of how well something is working. Operations staff will begin with fault management. As it becomes more mature, the function will move from being reactive to becoming proactive. Fault management systems often have difficulties in dealing with complex objects that span multiple object types and geographies. Further context is needed to make this information useful for services. We begin by transitioning from information to knowledge.
Service analytics is useful to model existing infrastructure components and support services and how they relate to the higher-level business services. This model shows the dependencies rather than the design, the chain of events that could cause a negative impact to the business services. The link between specific infrastructure events and corresponding business processes becomes apparent. The component-to-system-to-process linkage—also known as the service model—allows us to clearly identify the business impact of an event. Managers can then understand the behavior of the service as a whole, not just each error. The correct behavior of the service when it is operating normally can be defined as a baseline against which actual performance can be compared
Service analytics can help an operations group do a better job of identifying and correcting problems from the user’s standpoint. It can also predict the impact of changes to the environment. This same model can be turned around to show business demand for IT services. This is a high leverage point when building an on-demand environment.
Automation can therefore help with the early steps of the DIKW model. No computer-based technology can provide wisdom. People are required to provide evaluated understanding, to answer and appreciate the “why” questions. The application of intelligence and experience is more likely to be found in the organizational processes that define and deliver service management than in applied technologies.
Service Interfaces
The design of service interfaces is critical to service management. Service access points are associated with one or more channels of service. User interfaces include those provided for the customer’s employees and other agents as well as process-to-process interfaces. Service interfaces are typically present at the point of utilization or service access points (see Figure 7.3).
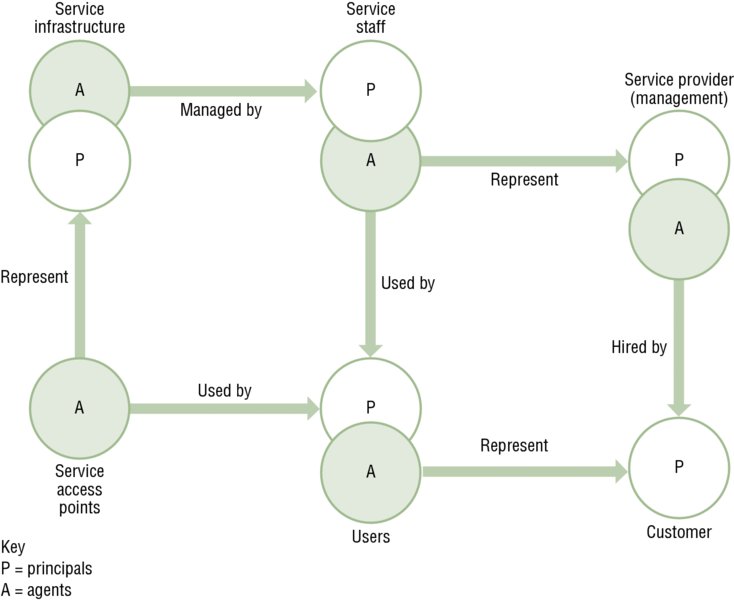
Figure 7.3 The critical role of service interfaces
Copyright © AXELOS Limited 2010. All rights reserved. Material is reproduced under license from AXELOS.
The service interfaces should meet the basic requirements of warranty:
- They should be easily located, ubiquitous, or simply embedded in the immediate environment or business context.
- They should be available in forms that allow choice and flexibility for users.
- They should be available with sufficient capacity to cope with the number of users.
- They should accommodate users with varying levels of skills, competencies, backgrounds, and disabilities.
- Ubiquity should be balanced with the need to keep interfaces low profile and low overhead to avoid undue stress.
- They should be simple and reliable and self-reliant.
Types of Service Technology Encounters
Customers now interact with service providers very differently than they used to; for example, using self-check-in kiosks at airports has replaced the interaction with the check-in staff
There are five modes in which technology interacts with a service provider’s customers:
- Mode A: technology-free. Technology is not involved in the service encounter. Employing a consultant to provide advice is an example of using the technology-free model.
- Mode B: technology-assisted. A service encounter in which only the service provider has access to the technology. An airline representative using a terminal to check in passengers is an example of a mode B interaction.
- Mode C: technology-facilitated. A service encounter in which both the service provider and the customer have access to the same technology. For example, a planner can share “what if” scenarios on a PC to illustrate capacity and availability modeling profiles.
- Mode D: technology-mediated. A service encounter in which the service provider and the customer are not in physical proximity. Communication may be through a phone. A customer receiving technical support services from a service desk is a mode D interaction.
- Mode E: technology-generated. A service encounter in which the service provider is represented entirely by technology, commonly known as self-service. Bank ATMs, online banking, and distance learning are examples of mode E interactions.
These are illustrated in Figure 7.4.

Figure 7.4 Types of service technology encounters
Copyright © AXELOS Limited 2010. All rights reserved. Material is reproduced under license from AXELOS.
Deciding on the most appropriate encounters requires the designer to consider aspects such as the level of technical knowledge of the customer’s employees, the implications of the encounter to the customer, and the customer’s expectations and perceptions. Some interactions are more suited to technology than others—calling your credit card company and inputting a code on your handset to check your balance works well using mode E, but a more complex interaction may work better using mode C or D.
Self-Service Channels
Automation, especially self-service, can be very useful in dealing with peaks of demand. Users are increasingly happy to use such channels because they are used for online shopping, banking, and so on. The Internet browser is a highly familiar service access point. In addition, self-service channels have low marginal cost, can be easily scaled up, provide a consistent service, and are available 24 hours a day. Users may even prefer the consistency of a self-service incident and problem management service rather than human service of variable quality, higher cost, and lower availability.
Poorly designed self-service channels may actually negatively impact the user perception, so the design should ensure usability, efficiency, and ease in interactions through the automated interface.
The level of control users are expected to assume with self-service options should be commensurate with the skill and experience level of the users.
Summary
This chapter covered the technology considerations for service strategy. In particular we looked at service automation, service analytics, and the five types of service interfaces: technology-free, technology-assisted, technology-facilitated, technology-mediated, and technology-generated.
Exam Essentials
Understand the advantages of automating processes and tasks. This includes understanding when it may not be appropriate to automate.
Be able to list the areas of service management where automation can be useful. Be able to give examples of how automation could be helpful.
Understand the steps that should be taken when preparing to automate. Understand the importance of simplification before automation.
Understand the instrumentation and event management techniques. Be able to list and explain the different techniques.
Understand how service analytics helps convert data into information and helps to develop knowledge. Understand why service analytics is not useful in the knowledge-to-wisdom step.
You can find the answers to the review questions in the appendix. Which of the following is NOT a benefit of service automation? Which of the following are event management techniques? (Choose all that apply.) Understanding patterns of information is called _____________________________ . Fill in the blanks in the following sentences: An abnormal condition that requires action to repair is a/an ____________________ . A/an ____________________ is a single event. We need to apply ____________________ to determine the relevance of any data. ____________________ alone can reduce variations in performance. Which example fits the term technology-assisted? Which of the following is NOT an instrumentation technique described in the ITIL Service Strategy publication? Which of the following are areas where service management may benefit from automation? Which of the following statements about implementing automation is/are incorrect? Which of the following statements about service analytics is/are TRUE and which is/are FALSE? What is being described in the following statement? “They should be easily located, ubiquitous, or simply embedded in the immediate environment or business context, available in forms that allow choice and flexibility for users and with sufficient capacity to cope with the number of users.”Review Questions