
Chapter 2
Service Strategy Principles
THE FOLLOWING ITIL INTERMEDIATE EXAM OBJECTIVES ARE DISCUSSED IN THIS CHAPTER:
- ✓ Service strategy basics
- Basic approach to deciding a strategy
- Strategy and opposing dynamics
- Outperforming competitors
- The four Ps of service strategy
- ✓ Services and value
- Services
- Value
- Utility and warranty
- ✓ Assets and service providers
- ✓ Defining services
- Eight steps to define services
- ✓ Strategies for customer satisfaction
- Kano model
- ✓ Service economics
- Return on investment
- Business impact analysis
- ✓ Sourcing strategy
- ✓ Strategy inputs and outputs within the service lifecycle
 To do well on the exam, you must ensure that you understand the basic principles of service strategy. These principles include the concepts of utility and warranty, service value and service economics. You will need to demonstrate that you can apply these concepts to the scenarios by analyzing the information provided in the exam questions.
Service Strategy Basics
This chapter covers the elements of service strategy that are necessary to understand, use, and apply the processes within service strategy to create business value. These concepts apply across the service lifecycle, but in this chapter we consider their relevance in service strategy. It will enable the use of the knowledge, interpretation, and analysis of service strategy principles, techniques, and relationships and the application for creation of effective service strategies.
Deciding on a Strategy
A strategy is a plan that enables an organization to meet a set of agreed objectives. It is important to establish the IT service management strategy for an organization so that the IT department is focused on meeting the needs and objectives of the organization as a whole and is not working in isolation.
To derive a successful IT service management strategy for the IT department, it is important to consider some key factors.
There are many sources for organizations to obtain their IT needs, and any strategic approach needs to recognize the potential competition. It should ensure that the IT department is in a position to exceed the performance of any outsourced suppliers or to be seen as delivering better value.
Whatever the desired objectives of the organization, the service provider should develop a strategy that recognizes the constraints under which it must operate.
This will enable the provider to establish the services that are required and the areas of the organization where they will be most effective. This can be expressed as the services offered and the markets served.
Strategy and Opposing Dynamics
It is necessary to understand the limitations of any strategic plan. These are often referred to as the opposing dynamics. In Figure 2.1, you can see a depiction of opposing dynamics.

Figure 2.1 Achieving a balance between opposing strategic dynamics
Copyright © AXELOS Limited 2010. All rights reserved. Material is reproduced under license from AXELOS.
Future vs. Present
This requires that we accommodate the pace of business change as business opportunities arise and disappear. The strategy has to be more than a plan and be able to adapt to the unforeseen.
Operational Effectiveness vs. Improvements in Functionality
Operational effectiveness should not be delivered at the expense of distinctiveness or the service provider may lose its customer base. There is a balance to be achieved here because although improvements increase competitive advantage, it is still important to deliver and provide the required functionality.
Value Capture
In the third dynamic, we are considering value capture. This refers to the value gained when innovations are launched versus the value captured during ongoing operations. Value capture is the portion of value creation a provider is able to keep. There is a very small window between the time an innovative feature is launched and the time the next competitor has the same capability. The service provider needs to be able to achieve a balance between introducing new functionality and maintaining normal practice.
Managing the balance between these opposing dynamics is critical for a successful service strategy. It is important for the service provider to understand the requirements of the organization and be able to react and predict, adapt, and plan to meet the changing needs of the business. Flexibility is a key attribute of the strategic approach.
Outperforming Competitors
The goal of a service strategy can be summed up as superior performance versus competing alternatives. A high-performance service strategy, therefore, is one that enables a service provider to consistently outperform competing alternatives over time and across business cycles, industry disruptions, and changes in leadership. It comprises both the ability to succeed today and positioning for the future.
Four Ps of Service Strategy
In 1994, Henry Mintzberg introduced four forms of strategy that should be present whenever a strategy is defined. These are illustrated in Figure 2.2 and are referred to as the four Ps of strategy.

Figure 2.2 Perspective, positions, plans, and patterns
Copyright © AXELOS Limited 2010. All rights reserved. Material is reproduced under license from AXELOS.
We will consider each of these in turn.
Perspective
Perspective is the vision and direction of the organization. A strategic perspective articulates what the business of the organization is, how it interacts with the customer, and how its services or products will be provided. A perspective cements a service provider’s distinctiveness in the minds of the employees and customers.
Positions
When we consider the position of a strategy, it should describe how the service provider intends to compete against other service providers in the market. The position refers to the attributes and capabilities that set the service provider apart from its competitors. Positions could be based on value or low cost, specialized services or providing an inclusive range of services, knowledge of a customer environment, or industry variables.
The framework considers a number of different types of positioning.
First, we look at variety-based positioning. This is where the service provider differentiates itself by offering a narrow range of services to a variety of customers with varied needs. For example, a cell phone company offers a range of predefined packages based on time and type of usage. Customers choose the package that suits them, even though they and other customers may use the same package differently.
Another option is that of needs-based positioning. The service provider differentiates itself by offering a wide range of services to a small number of customers. This type of positioning may also be called “customer intimacy.” The service provider identifies opportunities in a customer, develops services for them, and then continues to develop services for new opportunities or simply continues to provide valuable services that keep other competitors out. The relationship between the service provider and the customer is key in needs-based positioning. Examples here might be specialist service providers of medical systems in the pharmaceutical industry.
When a service provider targets a particular market and offers tailored services commonly based on a special interest or location, this is known as access-based positioning. Typically, only people in that group will have access to the service. For example, a service provider might offer branded items that can be bought in only a specific store or through a particular outlet, such as Harrods (London).
Last we consider demand-based positioning. As the name suggests, this is a type of positioning in which the service provider meets the demands of a customer by using a variety-based approach to appeal to a broad range of customers. The difference from variety-based positioning is that they allow each customer to customize exactly which components of the service they will use and how much of it they will use. This is an approach that is being explored by online service providers like Dropbox, which allows its customers to choose from different packages.
Plans
A strategy should be documented so that it is formally communicated throughout the organization. This is often the most tangible form of a strategy, a set of documents referred to as the strategic plan, and in many organizations this may be referred to as “the strategy.” The plan contains details about how the organization will achieve its strategic objectives and how much it is prepared to invest in order to do so.
To provide for an uncertain future, plans usually contain several scenarios, each one covering a strategic response and level of investment. Throughout the year, the plans are compared with actual events. This allows for adjustments to be made to adapt to any changes in the organizational requirements.
Some plans are high-level plans, such as the overall strategy, while others are more detailed, such as the execution plans for a particular new service or process. All plans should be coordinated and follow the same strategic framework.
Patterns
When we talk about patterns in service strategy, we are describing the ways in which an organization organizes itself to meet its objectives. The patterns could be organizational hierarchies, processes, interdepartmental collaboration, or services. Some patterns involve the way the organization works internally, whereas others involve the way in which the organization interacts with its customers and suppliers.
Recognizing patterns is important because they ensure that the service provider does not continuously react to demand in a new way every time. A pattern will enable the service provider to predict how a strategy will be met and forecast the investment that will be required.
There are two ways in which patterns can be formed. In some cases the organization will define the patterns it needs in its strategy. It will then define the way in which everyone complies with the patterns. In other cases, patterns that have been successful in the past will be formalized into the strategy of the organization. These are often referred to as emergent strategies.
Relationship between the Four Ps
We have already explored the way in which a service provider’s perspective and position will allow it to develop plans that, if executed, will ensure that the service provider achieves its strategic objectives.
However, planning involves the future, and even with the best intent, no plan can be fully reliable. Changes to the organization, its customers, and their respective environments can impact the successful execution of a plan. It is important that the service provider be flexible and not stick rigidly to a plan that is no longer valid. It may be necessary to alter the plan, defer it, or abandon it. In some cases, a service provider may have to merge plans or even create new ones. This is shown in Figure 2.3.

Figure 2.3 Strategic plans result in patterns.
Copyright © AXELOS Limited 2010. All rights reserved. Material is reproduced under license from AXELOS.
It is necessary to ensure that a strategy is not a rigid application of plans in a changing environment but is instead a continually adapting process, ensuring that the business and service provider stay relevant to a changing environment.
Services and Value
We are going to explore how the strategy for delivery of services is managed and what service management means for an organization.
Service
To refresh your memory, consider the definition of a service, as described in the framework.
A service is a means of delivering value to customers. Remember, customers are the people in an organization who pay for, or have financial authority over, what is delivered. The value is expressed in business terms, and it is the service provider’s responsibility to ensure that it enables the value to be realized. This is the facilitation of the outcomes while managing the costs and risks on the customers’ behalf.
When working on strategy, it is important to remember this definition because it should guide the thinking and decisions made by the service provider. Let’s continue to examine this definition.
It is important to remember that what we deliver in IT is not the same as something manufactured, like a physical product. There is a big difference between a service and a product.
Products are delivered as a fixed output, by a repeatable route. Consider the production environment of a factory. The output is produced by the application of a repeatable set of actions, taking raw materials and converting them to a physical end state. Value is created and realized through the exchange of the product between different parties—in other words, when the item is bought and sold.
A production environment also allows for stockpiling of products, which can be used at a later date. The value is maintained in the product itself, not its manufacture.
In contrast to products, services are dynamic interactions between customers and service providers reacting and responding to a real-time demand for a service. The output generated by a service is often variable, dependent on the scale and importance of the input. Think of the different transactions that can be generated by a single user, anything from a minor service request for a replacement of simple technology to the request for a complete new service.
This diversity of output means that we have to accommodate many different ways of delivering service. Consider the difference between a virtual transaction through a self-service portal and the human intervention still required for the physical repair of equipment.
The success of a service is based on the achievement of the customer’s desired outcome, not on whether or not the output of the service has been delivered. The value of a service is established only by its use to a customer. It is not the output of a service that is considered valuable but the customer’s ability to use its output to achieve their ends.
The result of this is that value can only be present in the relationship between customer and service provider. If there is no relationship, there is nothing to deliver, and there will therefore be no value.
This is often measured in terms of customer satisfaction, showing the importance of the relationship rather than a tangible product.
It is important to understand what we mean by an outcome—the ITIL guidance defines an outcome as “the result of carrying out an activity, following a process, or delivering an IT service.”
Outcomes are often described as either business outcomes or customer outcomes. Business and customer outcomes are differentiated by their context. Business outcomes represent the business objectives of both the business unit and the service provider and involve internal customers.
Customer outcomes are usually based on external service providers. For example, the external service provider may be focused on the outcome of delivering a profit, while the customer’s business outcomes will make use of the service to deliver their own requirements. Each will be able to fulfil their desired outcomes, but they do not have the same overall goal.
When we consider the difference between an outcome and an output, it’s important to remember that the definition of a service refers to an outcome, not an output. An output can be achieved, such as meeting service levels, but it may still result in customer dissatisfaction if the customer’s outcome is not met. Delivering a service requires the service provider to focus on the outcome desired by the customer and to track changes and adjust service accordingly.
Business outcomes are achieved when the business is able to perform activities that meet business objectives. They are defined in practical, measurable terms, as in the following examples:
- A product or service is delivered to a customer.
- An employee’s salary is paid.
- A financial report is submitted to a regulatory body.
- Taxes are collected.
- Cargo is shipped on a ship or airplane.
When we consider the responsibilities for specific costs and risks, it is important to remember that the focus for the customer is on outcomes and how the service will meet the needs. Customers are concerned about what a service will cost and how reliable it will be. The relationship between the service provider and the customer does not depend on knowing every expenditure item and risk mitigation measure that the service provider employs to deliver the service. The customer will assess value by comparing price and reliability with the desired outcome.
The service triangle (which associates the concepts of utility, warranty, and price to demonstrate value) shows the criteria that the customer will use to judge value and the service provider will use to deliver service. It is important that the service provider and the customer understand that the increase or decrease of any of these criteria will have an impact on the others. Delivering a lower-cost service will mean there is less capability for functionality and performance. The balance has to be achieved between the customer requirements and price, functionality, and performance. It is the responsibility of the service provider to capture the customer requirements while it determines the optimal approach for delivery. This includes the approach to risk and risk mitigation and the technology adopted to deliver the service.
In this way, the customer receives value, without the ownership of specific costs and risks.
Internal and External Customers
Services are delivered to both internal and external customers.
Internal services are delivered between departments or business units within the same organization, whereas external services are delivered to external customers.
To deliver value, the service provider must be able to differentiate between services that support an internal activity and those that achieve business outcomes, and understand the prioritization of each from the customer’s perspective. The activity to deliver the services may be similar, but internal services must be linked to external services before their contribution to business outcomes can be understood, measured, and prioritized. For example, email is important to an organization even though the organization manufactures cars as its main business. How well would the organization be able to function without this element of the desktop service? It may be the most important communication device for the entire organization and therefore should be prioritized accordingly.
The service provider can differentiate the types of service it delivers as described in the following sections.
Core Service
A core service is one that is fundamental to the delivery of a basic outcome required by a customer. It will deliver the value that the customer needs and is prepared to pay for. An example of this is the delivery of Internet banking functionality.
Enabling Service
An enabling service is a service that is needed in order for a core service to be delivered. Using the Internet banking example, an enabling service would be the network or the ISP provision. It is not normally something that an Internet banking user would consider or be aware of, but without it, the service could not be delivered.
Enhancing Service
An enhancing service is a service that is added to a core service to make it more exciting or enticing to the customer. Using the Internet banking example, this would be the provision of an additional feature such as the inclusion of a savings management program or the purchase of a financial savings package. It is not vital to the delivery of the core service, but it may make the service more attractive.
Value
Value can be expressed as the level to which a service will meet the customer’s expectations and is measured by how much the customer is willing to pay rather than the specific cost of the service.
The characteristics of value are that it is defined by the customer and delivers an affordable mix of features to meet the business requirements. It should enable the customer to meet its objectives and should be flexible to the changes that may take place within an organization over time. No organization will remain static in its requirements and objectives, and an IT service will cease to be perceived as valuable unless it can adapt to changing requirements.
In order to attribute value, the service provider needs to understand three specific inputs:
- What services were provided?
- What did the services achieve?
- What was their cost, or the price that was paid?
The answer to these questions will enable the service provider to demonstrate value to the customer. But the service provider will always be subject to the customer’s perception of value.
If we consider value from the perspective of the customer, then there are a number of factors that contribute to the understanding of value. This is shown in Figure 2.4.

Figure 2.4 How customers perceive value
Copyright © AXELOS Limited 2010. All rights reserved. Material is reproduced under license from AXELOS.
Calculating value can sometimes be a straightforward financial calculation: Does the service achieve what is required for an appropriate cost? If the cost does not impact profitability and the price remains competitive, then the service will be valuable.
As you can see, value is defined in terms of the business outcomes achieved and the customer preferences and perception of what was delivered.
Customers’ perceptions are influenced by the attributes of the service, their present or prior experiences, and the image or market position of the organization.
Preferences and perceptions are the basis for selecting one service provider over another, and often the more intangible the value, the more important the definitions and differentiation of value becomes.
Customers must have a value on which they will base their perception of value. This is known as the reference value. It is the perception mentioned previously, based on present or prior experience. The gains that are made from utilizing the service are perceived as a positive difference, an addition to the reference value. In an ideal situation, this would form the perception of value for the customer. But utilizing the service is not always perceived as a positive experience. An outage will create a negative difference, which detracts from the existing positive perception. This is shown as the net difference.
So in the final analysis, the perception of the economic value of a service will be the original reference value and the net difference. Any negative perception may have a significant impact on the overall perception of the service.
When developing the strategy for an IT service provider, it is useful to have a “marketing mind-set.” Marketing in this context refers not only to advertising services to influence customer perception, but also to understanding the customer’s context and requirements and ensuring that services are geared to meeting the outcomes that are important to the customer. Rather than focusing inward on the production of services, there is a need to look from the outside in, from the customer’s perspective.
A marketing mind-set begins with simple questions:
- What is our business?
- Who is our customer?
- What does the customer value?
- Who depends on our services?
- How do they use our services?
- Why are our services valuable to them?
To understand value chains and value realization, it is necessary to recognize that to be delivered, a service comprises multiple components. Each component is managed by a department within IT. Money is spent to procure, develop, and maintain each component, and each department manages their components to make sure they are operating correctly and therefore adding value to the service. Each piece of the jigsaw needs to make a positive contribution in terms of value added. The amount spent on the component should be less than the value it adds to the service.
Unfortunately, the true value can be calculated only after the value has been realized. This will only occur when the customer achieves its desired outcome.
If the value realized is not greater than the money spent, then the service provider has not added any value. It has spent money and in effect made a loss.
If IT wants to show it is adding value, it needs to link its activities to where the business realizes value. If it cannot do this, it will be perceived as a money spending organization. The IT money pit!
The only way to improve IT’s position is to reduce the amount of money thrown into the pit and cut costs! This will result in IT’s value reducing further.
The only way out of this destructive loop is to link services to business outcomes and show how each activity within IT helps to achieve each business outcome.
It is difficult to prove the value that has been added, particularly if there is no baseline or experience to benchmark against. Attempts can be made to explain what is being done to achieve the outcome, but a customer may simply view this as a way to drive up the price.
Ideally, the provider should focus on building a model where the contribution of each internal service can be measured and then link this to the achievement of the customer’s business outcome.
It is important that the IT provider understands the contribution provided by the internal service in terms of the utility or warranty it provides. This needs to be recognized in the context of the output the customer will receive and therefore the outcome they can achieve. Their perception of the value of the service will be positively influenced.
Capturing value will be the basis for effective communication of utility and warranty to improve customer perception of value and to provide a structure for the definition of service packages.
Utility and Warranty
Utility and warranty define services and work together to create value for the customer.
Utility
Utility affects the increase of possible gains from the performance of customer assets and the probability of achieving desirable business outcomes.
Figure 2.5 illustrates an example of an airline baggage handling service, which is able to load baggage onto an aircraft within 15 minutes 80 percent of the time. This is shown by the light-colored curve. With new security legislation, they will be required to perform additional security checks and to record the location of each bag in the aircraft hold. These additional activities require changes to the utility of the services.

Figure 2.5 Utility increases the performance average.
Copyright © AXELOS Limited 2010. All rights reserved. Material is reproduced under license from AXELOS.
In response to these new requirements, the airline changes the service to be able to do the additional work and is still able to load baggage onto the aircraft within 15 minutes 80 percent of the time. This new level of utility is shown by the dark-colored curve. The standard deviation remains the same since the warranty has not changed.
Warranty does not automatically stay the same when utility is increased. In fact, maintaining consistent levels of warranty when increasing utility usually requires good planning and increased investment. More investment is required for making changes to existing processes and tools, training, hiring additional employees to do the increased work, obtaining additional tools to perform newly automated activities, and so on.
Thus, the utility effect means that, although the customer assets perform better and the range of outcomes is increased, the probability of achieving those outcomes remains the same. This can be seen in the diagram; the shape of the graph and the space under the line remain the same.
Warranty
The effect of improving warranty of a service means that the service will continue to do the same things but more reliably. Therefore, there is a higher probability that the desired outcomes will be achieved, along with a decreased risk that the customer will suffer losses due to variations in service performance. Improved warranty also results in an increase in the number of times a task can be performed within an acceptable level of cost, time, and activity. Customers are interested in reliability and the impact of losses rather than the possible gains from receiving the promised utility.
Figure 2.6 shows how the standard deviation of the performance of a service changes when warranty is improved.

Figure 2.6 Warranty reduces the performance average.
Copyright © AXELOS Limited 2010. All rights reserved. Material is reproduced under license from AXELOS.
The lighter line shows that a significant percentage of service delivery is outside of the acceptable range. By making various improvements (e.g., training, process, and tool improvement; new tools or processes; automation), the service provider is able to increase the probability that the service will be performed within an acceptable range.
Using the airline baggage handling example, suppose that one year after adding the new utility, the airline would like to increase its “on-time departure” rate. Achieving this means that baggage handling needs to improve its performance. Without adding any new utility, the baggage handling service finds a better way of scanning and recording the location of bags. As a result, the baggage handling service is able to complete the loading of baggage onto the aircraft within 15 minutes 90 percent of the time—a significant improvement.
Combined Utility and Warranty
In Figure 2.7, you can see the impact of utility and warranty and how investment can be allocated according to the importance of the utility and warranty provided.

Figure 2.7 Combined effects of utility and warranty on customer assets
Copyright © AXELOS Limited 2010. All rights reserved. Material is reproduced under license from AXELOS.
In the bottom-left quadrant, you can see low business impact with variable utility and warranty bias:
- This is showing assets with little value even with utility and warranty.
- This shows that minimal investment in the asset and the utility and warranty is justified, or there is an option to retire the service.
In the top-left quadrant, the diagram shows low business impact with low utility and high warranty:
- This shows the asset deriving little value because service does not meet needs regardless of the high level of warranty.
- It shows that investment should be reallocated to improve utility.
In the bottom-right quadrant, the diagram shows high business impact with high utility and low warranty:
- Again, the value is low because the service does not perform well even with high utility.
- This time the investment needed will be to improve the warranty of service.
In the top-right quadrant, you can see high business impact with balanced utility and warranty:
- Any bias to utility or warranty will be highly visible because the outcomes are valuable to the business.
- This justifies optimum investment in the “zone of balance.”
Once we reach an appropriate balance between utility and warranty, customers will see a strong link between the utilization of a service and the positive effect on the performance of their own assets, leading to higher return on assets. This is shown in Figure 2.8.

Figure 2.8 Value of a service in terms of return on assets for the customer
Copyright © AXELOS Limited 2010. All rights reserved. Material is reproduced under license from AXELOS.
The arrow marked with a + (plus sign) in the diagram indicates a directly proportional relationship; here, the higher the utility, the higher the performance average. The arrow with a – (minus sign) indicates an inversely proportional relationship; here, the higher the level of warranty, the lower the performance variation.
In the diagram, services with a balance between utility and warranty increase the average performance of the customer assets. We could say that they will result in higher-value outcomes. This will also have the effect of reducing the performance variation, increasing the reliability of the service.
The combined effects of utility and warranty will enable the customer assets to achieve the customer’s business outcomes and result in a return on their assets. In other words, value is realized.
Communicating both utility and warranty is important for customers to be able to calculate the value of a service.
Communicating Utility
Communicating utility will enable the customer to determine the extent to which utility is matched to their functionality requirements.
Communicating utility in terms of ownership costs and risks avoided means that the service provider should be able to articulate the following points:
- That the service enables the business to achieve the desired outcomes more efficiently. This allows the business to reduce its costs (and in commercial organizations, to increase its profit margins).
- That the service improves the reliability of outcome achievement. In other words, the service mitigates the risk of the business not being able to achieve its outcomes.
Communicating Warranty
Warranty ensures that the utility of the service is available as needed with sufficient capacity, continuity, and security—at the agreed cost or price. Customers cannot realize the promised value of a service that is fit for purpose when it is not fit for use.
Warranty in general is part of the value proposition that influences customers to buy. For customers to realize the expected benefits of manufactured goods, utility is necessary but not sufficient. Defects either make a product unavailable for use or reduce its functional capacity. Warranties assure that the products will retain function for a specified period under certain conditions of use and maintenance. Warranties are void outside such conditions; normal wear and tear is not covered. Most important, customers are owners and operators of purchased goods.
Service providers communicate the value of warranty in terms of levels of assurance. Their ability to manage service assets instills confidence in the customer about the support for business outcomes. Warranty is stated in terms of the availability, capacity, continuity, and security of the utilization of services.
Usability refers to whether users can actually perform the required actions and access the information they need in order to be able to achieve the desired outcomes. For example, factors of usability may include readability of text, whether data entry is straightforward and logical, and so on.
The ability to deliver a certain level of warranty to customers by itself is a basis of competitive advantage for service providers. This is particularly true where services are commoditized or standardized. In such cases, it is hard to differentiate value largely in terms of utility for customers. When customers have a choice between service providers whose services provide more or less the same utility but different levels of warranty, they prefer the greater certainty in the support of business outcomes, provided it is offered at a competitive price and by a service provider with a reputation for being able to deliver what is promised.
One point to bear in mind when defining both utility and warranty is the affordability of the service. A service provider can build a perfect service, but the utility and warranty need to be balanced against what the customer can afford to pay. Affordability is a good way for customers to prioritize the elements of warranty and utility, given the outcomes they want to achieve.
Strategic Assets and Service Providers
We have explored the concept of value and begun to relate this to the customer, service, and assets. The following sections consider the way IT services are created and how value is delivered to the customers through the use of assets, resources, and capabilities.
How do the assets that make up an IT service relate to resources and capabilities, and what relevance does this have to the service management strategy?
Business Units and Service Providers
We will now examine the relationship between the assets used by business units and those used by service providers. Specifically, we are going to look at how these assets are related to services and the creation of value.
Business Unit
ITIL describes a business unit as an organizational entity, led by a manager, that performs a defined set of business activities that create value for customers in the form of goods and services.
The goods or services are produced and delivered using a set of assets, referred to as customer assets. Customers pay for the value they receive, which ensures that the business unit maintains an adequate return on assets. The relationship is good as long as the customer receives value and the business unit recovers costs and receives some form of compensation or profit.
It is the responsibility of the business unit to create value, which is determined in the context of the customer and the customer’s assets.
Service Provider
While some organizational units are business units, some are clearly service providers. A service provider is an organizational entity, led by a manager, that performs a defined set of activities to create and deliver services that support the activities of business units.
Service providers use service assets to deliver services to business units, and these service assets are used to enhance the performance of business assets to achieve business outcomes.
If there are constraints that affect the ability to deliver services, an investment in both resources and capabilities may be required to overcome them.
Suppliers may be included in this value chain, and they will need to invest in their own resources and capabilities to deliver according to the service provider’s requirements. But in service strategy, the focus for the service provider is the business outcome and how this can be established.
Service Asset
In Figure 2.9, you can see the representation of service assets driving services.

Figure 2.9 Service assets drive services to achieve business outcomes.
Copyright © AXELOS Limited 2010. All rights reserved. Material is reproduced under license from AXELOS.
Constraints will have an effect on the service that is delivered, either positive or negative, and this in turn will have an impact on customer assets and the ability to achieve business outcomes.
All organizations have some restrictions on the use of their assets. No organization has unlimited resource, and this will necessarily have an impact on the capability of delivery.
Other constraints may force the use of better-quality components—an example here would be security or regulatory requirements driving an improved capability in service.
IT Service Management
When we consider IT service management in the context of customer and service assets, it is the management of the service assets (resources and capabilities) used to deliver services that support the achievement of the customer’s business outcomes. Customers could be external or internal.
Service management enables the service assets to perform according to customer requirements while identifying and reducing the impact of constraints on the service assets. IT service management does this by managing IT’s capabilities and resources. This is done either internally or through the support of external service providers and technology vendors.
Achieving this is not straightforward and often takes several years of hard work and cultural change. Changes in the capability of staff and the resultant experience that they will gain takes time to develop.
Most IT service providers start out by organizing their departments according to technical specialization. This is an important principle because each type of technology is very specialized and requires people with specialized skills to manage it.
But this means that goals are accomplished and reporting is done in silos, and the selection of staff is based on expertise, not any strategic plans. Often functional managers compete with each other rather than act in partnership, and as a consequence, issues that affect the organization across the functions are not addressed.
Processes are used as a means for managing silos, to bridge the gaps between the departments. Processes can be self-contained or cross-functional, dependent on the outcome that is required. They should enable thinking of IT as a set of cohesive resources and capabilities, not just as a set of individual departments or specialisms.
It is important that the processes focus on outcomes, not just outputs. Otherwise, the individual departments will simply focus on their specific output and ignore the fact that the outputs produced by all are used to deliver the overall outcome required by the business.
To achieve this successfully, IT priorities must be aligned to the drivers of business value, otherwise the IT department will be entirely inwardly focused.
IT Service Provider
The logical conclusion of this engagement between business units, service management, processes, and IT departments is that the IT department models itself as a service provider, with the goal of meeting business outcomes.
As can be seen in Figure 2.10, the resources and capabilities of the service provider are utilized to support the service (in the context of utility and warranty), and these in turn support and enable the business unit. Use of customer assets in the form of resources and capabilities will deliver the business outcomes.

Figure 2.10 How a service provider enables a business unit’s outcomes
Copyright © AXELOS Limited 2010. All rights reserved. Material is reproduced under license from AXELOS.
This is a direct connection from the service provider on the right of the image to the business outcomes on the left. Management of service assets by the service provider is used to deliver the utility and warranty, with the positive and negative effects of risks and costs driving the use of assets, both for the service provider and the customer.
This is often viewed as an end-to-end approach for the delivery of service.
Working backwards from the service potential ensures that any strategic decisions are based on customer value.
Here are some key questions to ask to ensure that the service provider will deliver the business outcomes:
- Who are our customers?
- What do those customers want?
- Can we offer anything unique to those customers?
- Are the opportunities already saturated with good solutions?
- Do we have the right portfolio of services developed for given opportunities?
- Do we have the right catalog of services offered to a given customer?
- Is every service designed to support the required outcomes?
- Is every service operated to support the required outcomes?
- Do we have the right models and structures to be a service provider?
- What we are trying to achieve as a service provider? Are our customers happy?
- Do they view our services as strategic assets?
We know that assets are resources and capabilities that are used to deliver services. A strategic asset is any asset (customer or service) that provides the basis for core competence, distinctive performance, or sustainable competitive advantage or that qualifies a business unit to participate in business opportunities. It is an asset that makes a significant difference to the organization.
Strategic assets are dynamic in nature. They are expected to continue to perform well under changing business conditions and objectives of their organization. That requires strategic assets to have learning capabilities, and that means being able to learn from past experience.
Part of service strategy is to identify how IT and IT service management can be viewed as strategic assets rather than an internal administrative function. It is important that IT is able to link its services to business outcomes, which in turn will contribute to the organization’s competitive advantage and market differentiation.
We begin to grow service management into a strategic asset by building on our capabilities. This perception of IT as a valuable and trusted strategic part of the business does not happen overnight. It takes a concerted and formal effort in which IT demonstrates its contribution one area at a time.
Each new challenge that IT enables the business to overcome allows IT to develop additional credibility and enables the business to see IT as a strategic service provider. The more trusted IT becomes, the more services the business will ask it to provide, and at higher service levels. This increase in credibility and trust will justify more investment in the IT department, which in turn will allow for investment in greater capability.
Confidence and credibility in a provider have to be earned. Figure 2.11 represents cycles of earning trust. In practice there will be many more. It is of course possible for the cycle to run backwards if you fail to provide the service the business expects.

Figure 2.11 Growing service management into a trusted strategic asset
Copyright © AXELOS Limited 2010. All rights reserved. Material is reproduced under license from AXELOS.
The sequence of activity is as follows:
- Within an existing IT service provider, the cycle begins when the service provider and business have selected an opportunity—which could be an existing service or an initiative that has already been defined. The value of this opportunity is defined in terms of outcomes that need to be achieved and the investment required to meet them. The opportunity will also specify which customers and market spaces the opportunity addresses.
- The service provider ensures that the capabilities and resources are in place to deliver the service(s).
- When delivered at the agreed levels, these services enable the business to achieve its objectives or overcome the defined challenge. It is important that these achievements are documented and reported to the stakeholders.
- The customer recognizes the IT service provider’s contribution to their success (the value of the service).
- As a result, the customer is willing to entrust even more opportunities to the service provider.
Service management is viewed as a strategic asset (rather than a set of purely operational processes) when it can demonstrate how it enables the service provider to compete and differentiate itself effectively.
Service management does this by performing the following actions:
- Establishing a catalog of services that contribute to strategic business objectives and outcomes
- Identifying the market spaces in which IT enables the business to compete
- Defining how these services meet business challenges and then measuring them to ensure that this is achieved
- Building capabilities and resources to deliver these services and overcome identified challenges
- Communicating with the business about delivery achievements
Types of Service Providers
There are many options in the market place for the type of service provider an organization might use, and each has its own risks, costs, and benefits. This means that any choices made in sourcing IT from a service provider will need to align to the overall business strategy.
We will need to consider resources and capabilities and the overall outcomes that are required from the service provider, just as we do for a service that they deliver.
Type I Service Provider
The example in Figure 2.12 shows the Type I service provider. Type I providers are service providers that are dedicated to, and often embedded within, an individual business unit. The business units themselves are usually a part of an organization. They are funded by overheads and are required to operate strictly within the mandates of the business. Type I providers have the benefit of working closely with their customers, and are able to avoid certain costs and risks associated with conducting business with external providers. The control of all services remains within one organization.

Figure 2.12 Type I providers
Copyright © AXELOS Limited 2010. All rights reserved. Material is reproduced under license from AXELOS.
Because Type I service providers are dedicated to specific business units, they are required to have an in-depth knowledge of the business. They are usually highly specialized, often focusing on designing, customizing, and supporting specific applications or on supporting a specific type of business process.
The diagram shows three business units with Type I service providers. Each IT unit is dedicated to a single business unit and delivers specialized services to that business unit only. A disadvantage of this approach is that there may be duplication and waste when Type I providers are replicated within the organization.
Competition for Type I providers is from providers outside the business unit, such as corporate business functions, who may be able to utilize advantages such as scale, scope, and autonomy.
Type II Service Provider
Functions such as finance, IT, human resources, and logistics are not always at the core of an organization’s competitive advantage. Instead, the services of such shared functions are consolidated into an independent special unit called a shared services unit as shown in Figure 2.13. IT is shown as a single department with a service catalog that is available to multiple business units.

Figure 2.13 Common Type II providers
Copyright © AXELOS Limited 2010. All rights reserved. Material is reproduced under license from AXELOS.
Shared service units can create, grow, and sustain an internal market for their services and model themselves along the lines of service providers in the open market. Often they can leverage opportunities across the organization and spread their costs and risks across a wider base. They are subject to comparisons with external service providers whose performance they should match, if not exceed.
Type II providers can offer lower prices compared to external service providers by leveraging internal agreements and accounting policies. They can standardize their service offerings across business units and use techniques such as market-based pricing to influence demand patterns. Market-based pricing is the approach where the service provider compares itself to an external provider for its pricing model. This makes comparison easier for the customer and may highlight internal economies. A successful Type II service provider can find itself in a position where it is able to provide its services externally as well as internally.
It is possible to combine Type I and Type II within an organization where there is a mix of requirements for IT services—for example, some specialists and dedicated service provisions and some shared services.
Type III Service Provider
A Type III service provider is a service provider that provides IT services to external customers. In Figure 2.14, you can see an example of a Type III provider.

Figure 2.14 Type III providers
Copyright © AXELOS Limited 2010. All rights reserved. Material is reproduced under license from AXELOS.
The business strategies of customers sometimes require capabilities more readily available from a Type III provider. Type III providers assume additional risk because their core business is the delivery of service and they are competing against internal Type I and Type II providers. Type III providers can offer competitive prices and drive down unit costs by consolidating demand from a range of clients. They may have the economies of scale to be able to deliver against specialisms that are too expensive for an individual customer by offering the capability to a wider range of customers. A further aspect of Type III service providers is that they provide specific capabilities or activities that are used by a Type I or II service provider to support their services.
Although this is not shown in the diagram, it should be noted that organizations using Type III service providers will still need an internal IT function or functions to manage the specification of services, coordinate the contracts, and ensure that business outcomes are met.
Evaluation of Service Providers
An organization needs to understand the advantages and disadvantages of each provider type. The choice of provider will be influenced by a number of factors, including the cost per transaction with the service provider, the best practice in a particular industry sector, and any specific requirements that can be met by only a particular type.
Of course, a major consideration should be the core competencies that are delivered by the service provider. The decision will need to take into consideration the service provider’s risk management capabilities and the impact that the use of a specific provider type might have on the organization and the resultant risk. Another factor to consider is the economy of scale the service provider can deliver.
The tendency is for core services to be delivered by Type I or Type II providers (or indeed a mix of these), while enhancing services are often supplied through Type II or Type III providers (or a mix, as before).
It is important to remember that the organizational requirements may change over time, and this may have an impact on the sourcing model that is required. In Table 2.1, we have an organizational view of the movement from one service provider type to another. For example, changing from a Type I provider (left-hand column) to a Type III provider (right-hand column) would be classified as outsourcing.
Table 2.1 Customer decisions on service provider types
| From/to | Type I | Type II | Type III |
| Type I | Functional reorganization | Aggregation | Outsourcing |
| Type II | Disaggregation | Corporate reorganization | Outsourcing |
| Type III | Insourcing | Insourcing | Value net reconfiguration |
Evaluation of the service provider types depends on the nature of the provision, and whether customers keep a business activity in-house (aggregate), separate it out for dedicated management (disaggregate), or source it from outside (outsource) will depend on the answers to the following questions:
- Does the activity require assets that are highly specialized? Will those assets be idle or obsolete if that activity is no longer performed?
- If yes, then disaggregate and/or outsource.
- How frequently is the activity performed within a period or business cycle? Is it infrequent or sporadic?
- If yes, then outsource.
- Does the activity require knowledge specific to a particular business unit, even if the activity is infrequent and/or specialized?
- If yes, then disaggregate or insource.
- How complex is the activity? Is it simple and routine? Is it stable over time with few changes?
- If it’s stable over time, then outsource. If it is complex and volatile, it might need to be disaggregated.
- Is it hard to define good performance?
- If yes, then aggregate.
- Is it hard to measure good performance?
- If yes, then aggregate.
- Is it tightly coupled with other activities or assets in the business? Would separating it increase complexity and cause problems of coordination?
- If yes, then aggregate.
Organizations learn and improve over time during lasting relationships with customers. Fewer errors are made, investments are recovered, and the resulting cost advantage can be leveraged to increase the gap with competition. This is the same for the relationship between the service provider and their customers.
It is a fact that customers find it less attractive to turn away from well-performing incumbents, simply because of the costs relating to switching to a new provider. Experience can be used to improve assets over time and therefore improve the service delivery.
Service providers must therefore focus on providing the basis for a lasting relationship with customers. It is important for the service provider to carry out strategic planning and control to ensure that common objectives drive everything that is delivered. This requires knowledge to be shared effectively between units and the results of experience fed back into future plans and actions.
Defining Services
ITIL suggests eight steps that are needed for the service provider to be able to define a service. These steps outline how to identify customers and their requirements and whether there is an opportunity that a service provider can fulfil.
- Define the market and identify customers.
- Understand the customer.
- Quantify the outcomes.
- Classify and visualize the service.
- Understand the opportunities (market spaces).
- Define services based on outcomes.
- Service models.
- Define service units and packages.
Step 1: Define the Market and Identify Customers
When we talk about markets in this context, we mean the group of customers to whom the service provider is going to deliver services. So the first step has to be understanding the nature of the customer we are going to serve, as this will help us understand the options available.
For example, a Type I service provider will typically serve only one business unit. Their entire market consists of a single internal customer.
Markets can be defined by one or more criteria:
Industry Sector For example manufacturing, retail, financial services, healthcare, or transportation.
Geographically By a specific country or region. A service provider may provide a best-in-class service but decide to limit its availability to a single geographical region. A different service provider may provide a lower standard of service but deliver it consistently across multiple regions. This would make it easier for a customer to standardize its services across multiple regions.
Demographic The service provider may deliver a service geared toward a specific cultural group (e.g., television programming for a Spanish-speaking customer in the United States) or a group of customers with similar incomes (e.g., luxury or economy services).
Corporate Relationships Some service providers have specifically been set up to provide services to a group of companies with common shareholders and may not market those services to competitors of those companies.
Whatever the criteria, identifying the markets in which the service provider will operate is an important part of identifying which services the service provider will deliver and to which customers.
Step 2: Understand the Customer
For internal service providers, understanding the customer means understanding the overall business strategies and objectives of the organization and how each business unit meets them. It also means understanding the business outcomes that each business unit needs to achieve.
For an external service provider, understanding the customer means recognizing why they need the service they are purchasing. The service provider does not have to comprehend the detailed strategy, tactics, and operations of the customer, but they do need to understand the reasons the customer needs the service and what features are important.
Understanding customers involves understanding their desired business outcomes, their assets and constraints, and how they will perceive and measure value.
Desired Business Outcomes
The customers use their assets to achieve specific outcomes. Understanding what these outcomes are will help the service provider define the warranty and utility of the services and prioritize service needs.
Customer Assets
Services enable and support the performance of the assets the customer uses to achieve its business outcomes. Therefore, it is necessary when defining services to understand the linkage between the service and the customer assets.
Constraints
Customer assets will be limited by some form of constraint, such as lack of funding, lack of knowledge, regulations, and legislation. Understanding those constraints will enable the service provider to define boundaries for the service and also help the customer overcome, or work within, many of them.
How Value Will Be Perceived and Measured
Customers always measure performance, quality, and value. It is vital that the service provider understands how the customer measures the service—even if the service provider is not able to measure the service the same way.
The value of a service is best measured in terms of the improvement in business outcomes. These should be attributable to the impact of the service on the performance of business assets. Some services increase the performance of customer assets, some maintain performance, and others restore performance following an incident. A major aspect of providing value is preventing or reducing the variation in the performance of customer assets.
Step 3: Quantify the Outcomes
In this step, the service provider will work with the customer to identify its desired outcomes. These definitions need to be clear and measurable, and they need to be something that can be linked to the service.
Defining outcomes is an important part of defining services, but customers may take it for granted that everyone understands their particular outcomes because they are part of their normal routine. It is therefore important that the service provider work with the customer to quantify each outcome and document it.
Understanding how services impact outcomes, and therefore what type and level of service is needed, will require the service provider to map the services and outcomes. A good business relationship management process will help the service provider define and document the outcomes in terms that can be measured by the service provider. Mapping of outcomes to services and service assets can be accomplished as part of a configuration management system (CMS) and the service portfolio. Information on services is captured in the service portfolio, particularly the service catalog and service pipeline. Service level agreements also contain service information about how the service is linked to the business outcome.
Gaining insight into the customer’s business and having good knowledge of customer outcomes is essential to developing a strong business relationship with customers. This is a key activity within business relationship management.
An outcome-based definition of services ensures that managers plan and execute all aspects of service management entirely from the perspective of what is valuable to the customer. Such an approach ensures that services not only create value for customers but also capture value for the service provider.
Step 4: Classify and Visualize the Service
Every service is unique, but many have similar characteristics. If a new service shares common characteristics with an existing service, it will be easier to determine what it will take to deliver the new service. If it has no characteristics in common with existing services, it will need to be evaluated and designed from the beginning.
Creating a way to classify services and represent them visually can help in identifying whether a new service requirement fits within the current strategy or whether it will represent an expansion of that strategy. It might also assist the service provider in deciding not to make an investment in a service that moves it away from its strategy.
One way to carry out this classification of services is to use service archetypes, or basic building blocks for services.
Figure 2.15 visualizes the interaction of service archetypes and customer assets as they may be captured in the service catalog.

Figure 2.15 Classifying services using service archetypes and customer assets
Copyright © AXELOS Limited 2010. All rights reserved. Material is reproduced under license from AXELOS.
Services are based on service archetypes, such as lease, license, manage, operate, repair, audit, and design. In Figure 2.15, you can see these linked to the customer assets.
Mapping service archetypes and customer assets can also be useful to define strategies or to reveal patterns of demand or competence that have been built over time.
This is especially helpful for those service providers who were required to deliver whatever services the business demanded in the past without having a clear strategy. This is a common experience because organizations often grow organically rather than to a specific or strict strategy. This type of mapping will provide a baseline from which a service provider can identify future opportunities and services.
For example, the service provider may learn that many services are based on the same service archetype. They may learn that their resources and capabilities are mainly targeted at supporting business processes. This would be an asset-based service strategy—represented by the vertical arrow in Figure 2.16.

Figure 2.16 Asset-based and utility-based strategies
Copyright © AXELOS Limited 2010. All rights reserved. Material is reproduced under license from AXELOS.
Alternatively, the service provider may learn that what differentiates it is the ability to provide administrative services that support a wide range of customer assets. This is shown by the horizontal arrow in the diagram, which represents a utility-based strategy.
Most organizations have a combination of utility- and asset-based service patterns. Visualization of services helps them to understand where they are strongest and where they need to strengthen their portfolio, resources, or capabilities.
This combination of service archetypes and customer assets often results in a series of patterns that indicate the positions where the service provider is strong.
Services with closely matching patterns indicate that there is an opportunity for consolidation or perhaps packaging them as shared services.
If the applications asset type appears in many patterns, then service providers can focus more investments in capabilities and resources that support services related to applications. The same can be seen if many patterns include the support archetype. It can be taken as an indication that support has emerged as a core capability.
These are just simple examples of how the service catalog can be visualized as a collection of useful patterns. Service strategy can result in a particular collection of patterns, which is known as an intended strategy. A collection of patterns can make a particular service strategy attractive, and this is known as an emergent strategy.
Figure 2.17 shows examples of patterns of services as just described.

Figure 2.17 Visualization of services as value-creating patterns
Copyright © AXELOS Limited 2010. All rights reserved. Material is reproduced under license from AXELOS.
In this diagram, a single service may be constructed from one or more service archetypes and may support one or more customer assets, as follows:
- Service A is a utility-based communication service, which supports three types of customer assets: organization, processes, and knowledge.
- Service B is largely an asset-based process service, in which processes are supported by reporting, control, and support service archetypes. In this service, support services are also provided to support the organization asset.
- Service C is a support service archetype that supports financial assets, information, and applications.
- Service D is a range of service archetypes (administrative, reporting, control, and support) that support application assets. It also includes reporting support for infrastructure assets.
This visual method can be useful in communication and coordination between functions and processes of service management. The visualizations can be used as the basis of more formal definitions of services.
Proper matching of the value-creating context (customer assets) with the value-creating concept (service archetype) can avoid shortfalls in performance.
Questions of the following type can be useful:
- Do we have the capabilities to support workflow applications?
- What are the recurring patterns in processing application forms and requests?
- Do the patterns vary based on time of year or type of applicants or around specific events?
- Do we have adequate resources to support the patterns of business activity?
- Are there potential conflicts in fulfilling service level commitments? Are there opportunities for consolidation or shared resources?
- Are the applications and requests subject to regulatory compliance? Do we have knowledge and experience of regulatory compliance?
- Do we come in direct contact with the customers of the business? If yes, are there adequate controls to manage user interactions and information?
Step 5: Understand the Opportunities (Market Spaces)
Following the previous four steps, the service provider now has a good understanding of the customer and its assets. The service provider should now be able to map existing capabilities and resources to existing customer assets to understand what service it is able to provide.
Each customer has a number of requirements, and each service provider has a number of competencies. How does the service provider understand where its competencies will be able to meet the customer’s requirements? These interactions between the service provider’s competencies and the customer’s requirements are called market spaces. Market spaces identify the possible IT services that an IT service provider may wish to consider delivering.
In this way, a market space is defined by a set of business outcomes, which can be facilitated by a service. The opportunity to facilitate those outcomes defines a market space for a service provider.
The following are examples of business outcomes that can be the basis of one or more market spaces:
- Sales teams are productive with a sales management system on wireless computers.
- An e-commerce website is linked to the warehouse management system.
- Key business applications are monitored and secure.
Each of the outcomes is related to one or more categories of customer assets, such as people, infrastructure, information, accounts receivables, and purchase orders. These can then be linked to the services that make them possible. Each outcome can be met in multiple ways, but customers normally prefer those with lower costs and risks. Service providers need to use this information to ensure that they provide the services that are required by the customer and are profitable for themselves.
Step 6: Define Services Based on Outcomes
Defining services based on outcomes ensures that the customer’s requirements and value definitions drive the planning, delivery, and execution of the services. This means that not only does the customer receive the value it requires from the services, but that the service provider is able to capture value as well.
It is important to capture and understand value from the customer’s perspective. Customers may express dissatisfaction with a service provider even if the service targets are met if they do not fully understand the value the service is providing to their business outcomes. Defining a service based on customer outcomes ensures that this is less likely to happen.
Ensuring that the design is robust and that the operational requirements are delivered in the service will address both utility and warranty for the customer. This will allow the service provider to identify where improvements can be made.
Clarification of the service delivery will support the perception of the customer in determining the value of the service. It will also enable both the customer and service provider to more easily visualize any patterns to be found across service catalogs and portfolios. This will be useful in determining the coordination efforts required to deliver service. It will remove any ambiguity and avoids any misalignment with the customer requirements.
Figure 2.18 is one of two examples of outcome-based service definitions. The other is in Figure 2.19. In the diagrams, you can see that the service archetypes and specific customer assets from step 4 are used in these definitions.

Figure 2.18 Defining services with utility components
Copyright © AXELOS Limited 2010. All rights reserved. Material is reproduced under license from AXELOS.

Figure 2.19 Defining services with warranty components
Copyright © AXELOS Limited 2010. All rights reserved. Material is reproduced under license from AXELOS.
Figure 2.18 shows outcomes based on the utility of three different lines of service. In this case, the outcomes are expressed in terms of the outcomes achieved and the constraints removed (please note that utility can be achieved without having both outcomes achieved and constraints removed).
In the diagrams in Figures 2.18 and 2.19, you can see that the service archetypes and specific customer assets from step 4 are used in these definitions, which shows outcomes based on the warranty of the same three different lines of service.
Well-constructed definitions make it easier to visualize patterns across service catalogs and portfolios that earlier were hidden due to unstructured definitions. Patterns help to bring clarity to decisions across the service lifecycle.
Actionable service definitions are useful when they are broken down into discrete elements that can then be assigned to different groups. These groups will manage them in a coordinated manner to control and contribute to the overall effect of delivering value to customers.
Being able to define services in an actionable manner has advantages from a strategic perspective. It removes ambiguity from decision-making and avoids misalignment between what customers want and what service providers are capable of delivering. Without the context in which the customers use services, it is difficult to completely define value.
But it is possible to ask questions that assist with the definition of a service. Questions that can be helpful in defining the services in an actionable manner are listed in Table 2.2. These types of questions are crucial for an organization to consider in the implementation of a strategic approach to service management. They are applied by all types of service providers, internal and external.
Table 2.2 Defining actionable service components
| Service type | Utility (Part A and B) |
| What services do we provide? Who are our customers? |
What business outcomes do we support? How do they create value for the business’s customers? What constraints do our customers face? |
| Customer assets | Service assets |
| Which customer assets do we support? Who are the users of our services? |
What assets do we deploy to provide value? How do we deploy our assets? |
| Activity or task | Warranty |
| What type of activity do we support? How do we track performance? |
How do we create value for the business’s customers? What assurances do we provide? |
Step 7: Service Models
Service models can take many forms, from a simple logical chart showing the different components and their dependencies to a complex analytical model analyzing the dynamics of a service under different configurations and demand patterns.
Service models have a number of uses, especially in service portfolio management:
- Understanding what it will take to deliver a new service
- Identifying critical service components, customer assets, or service assets—and then ensuring that they are designed to cope with the required demand
- Illustrating how value is created
- Mapping the teams and assets that are involved in delivering a service, and ensuring that they understand their impact on the customer’s ability to achieve their business outcomes
- As a starting point for designing new services
- As an assessment tool for understanding the impact of changes to existing services
- As a means of identifying whether new services can be delivered using existing assets
- If not, then assessing what type of investment would be required to deliver the service
- Identifying the interface between technology, people, and processes required to develop and deliver the service.
Figure 2.20 provides an example of how the dynamics of a service can be represented in a service model.

Figure 2.20 Dynamics of a service model
Copyright © AXELOS Limited 2010. All rights reserved. Material is reproduced under license from AXELOS.
In this diagram, a retail service is illustrated. In this example, each component of the service is listed on a separate leg (or part), and the activities are numbered in the sequence in which the service is normally delivered.
Each component of the service is listed in relation to the other components, the dependencies identified, and the flows of communication and data indicated.
Step 8: Define Service Units and Packages
Services may be as simple as allowing a user to complete a single transaction, but most services are complex. They consist of a range of deliverables and functionality. If each individual aspect of these complex services were defined independently, the service provider would soon find it impossible to track and record all services.
Some services can be delivered on their own, but others require additional services to make them work. Consider buying a book. This is simple and straightforward, but if you purchase an e-book, then there are a number of supporting services and requirements, such as a reading device, an Internet connection, and licensing of the intellectual property.
A single service delivered to a customer is viewed by the service provider as a service. When two or more services are bundled and sold or delivered together, they are viewed by the service provider as a service package.
Service packages are created for two main reasons:
- If the core service requires enabling services to be present
- To create additional value for the customer, which equates to additional revenue and customer loyalty for the service provider
Packaging services requires an understanding of the different types of services. The service provider needs to understand how the services can be marketed and sold. The three basic types of services that can be delivered are core services, enabling services, and enhancing services.
Following on from our previous examples of service types, let us now consider them in terms of service packages. Customers buy the provision of satellite TV as a service package from a particular supplier. It consists of the core services, a decoder, satellite dish, cabling, and access to content. The enabling service is the installation, and the enhancing services are the capability for email and Internet access with online storage.
Services and Service Packages Can Include Options
Service providers need to differentiate between service packages to allow for different customers to receive their individual service requirements. Potentially, each type of consumer will require a different level of warranty and utility.
Where a service or service package needs to be differentiated for different types of customer, one or more components of the package can be changed, or offered at different levels of utility and warranty, to create service options. These different service options can then be offered to customers and are sometimes called service level packages.
For example, when considering a core service of satellite television channels:
- Option A includes 100 channels.
- Option B includes 200 channels.
- Option C includes only channels appropriate for families with young children.
- Option D includes 300 channels and 5 pay-per-view sporting events per month.
Each of these services has a defined level of utility and warranty.
Service packages may be created to offer a number of different options to the customer. Each of these options will be documented in the service catalog, allowing the customer to choose the option that best suits its requirements.
Cloud Computing
In the case of cloud computing, the customer is able to pick and choose combinations of services and service levels. The customer is choosing its own packages and options.
Segmentation
An organization may choose to categorize its customers. This enables them to package services targeted to the needs of the categories.
In its simplest form, this could, for example, be a golf club or leisure center offering different membership packages (e.g., individual, family, junior, senior), but it could be more sophisticated, such as the example of the media company offering entertainment and communication packages, mentioned previously.
Segmentation can be extremely valuable for targeting marketing and sales campaigns, for example, as well as for defining service packages aimed at different segments. IT providers can use the same technique to segment IT users.
This will allow service packages to be developed to meet the needs of each user type while giving the following advantages:
- Maximization of standardization
- Minimization of different and diverse services
- Easier distribution
- Simplification of support issue
Designing and Transitioning Service Packages
The design and transition of service packages follows exactly the same process as any other service. A suggestion or request for a new service package (or change to an existing service package) is submitted through service portfolio management. The service package is modeled and assessed, and a change proposal submitted. Once the change proposal is authorized, the required levels of utility and warranty for the service package and its options will be documented in the service charter and submitted to design coordination.
A service design package (SDP) will be created to support the design, transition, and operation of the service package throughout the service lifecycle. The service transition processes will build, test, and deploy the service packages, just as they would any individual service, using the service charter and SDP as a basis for this activity.
The service package and its options will be documented in the service catalog.
Strategies for Customer Satisfaction
Customer satisfaction is very important in a competitive environment. Meeting business outcomes may not be enough to differentiate a service provider. Customers need to feel confident in the ability of the service provider to continue providing that level of service—or even improving it over time.
Customer expectations keep shifting, and a service provider that does not track this will soon lose business.
Kano Model
The Kano evaluation model assists with the understanding of customer expectations and how a service provider can adapt its services to meet the changing customer environment.
Attributes of a service are the characteristics that provide form and function to the service from a utilization perspective. The attributes are traced from business outcomes to be supported by the service. Certain attributes must be present for value creation to begin. Others add value on a sliding scale determined by how customers evaluate increments in utility and warranty. Service level agreements commonly provide for differentiated levels of service quality for different sets of users.
Some attributes are more important to customers than others. They have a direct impact on the performance of customer assets and therefore the realization of basic outcomes. Table 2.3 provides descriptions of the attributes referred to in the Kano model.
Table 2.3 The Kano model and service attributes (Kano 1984)
| Type of attribute | Fulfilment and perceptions of utility (gain/loss) |
| Basic factors (B) (must-have, nonlinear) | Attributes of the service expected or taken for granted. Not fulfilling these will cause perceptions of utility loss. Fulfilling them results in utility gain, but only until the neutral zone, after which there is no gain. |
| Excitement factors (E) (attractive utility, nonlinear) | Attributes of the service that drive perceptions of utility gain but, when not fulfilled, do not cause perceptions of utility loss. |
| Performance factors (P) (attractive utility, linear) | Attributes of the service that result in perceptions of utility gain when fulfilled and utility loss when not fulfilled in an almost linear, one-dimensional pattern. |
| Indifferent attributes (I) | Cause neither gains nor losses in perceptions of utility regardless of whether they are fulfilled or not. |
| Reversed attributes (R) | Cause gains in perceptions of utility when not fulfilled and losses when fulfilled. Assumptions need to be reversed. |
| Questionable response (Q) | Responses are questionable possibly because questions were not clear or were misinterpreted. |
In the Kano model, as shown in Figure 2.21, you can see the three types of factors that are involved in customer satisfaction:
- Basic factors are expected or taken for granted.
- Performance factors enhance the offering. Customers will pay more for more of these (e.g., amount of storage).
- Excitement factors are those that customers do not expect, but they increase satisfaction.

Figure 2.21 Perceptions of utility and customer satisfaction
Copyright © AXELOS Limited 2010. All rights reserved. Material is reproduced under license from AXELOS.
Excitement factors and performance factors are the basis for segmentation and differentiated service levels. They are used to fulfil the needs of particular types of customers. These attributes are necessary for any strategy that involves segmenting of customers into groups and serving them with an appropriate utility package.
Basic factors are necessary for the service provider to enter the market space. Something innovative and new will become commonplace over time, so excitement factors will lose their ability to act as a differentiator. Competition, changes in customer perceptions, and innovations can cause excitement factors to drift toward becoming performance or basic factors.
A well-designed service provides a combination of basic, performance, and excitement attributes to deliver the appropriate level of utility for a customer.
Different customers will place different importance on the same combination of attributes. But even if a particular type of customer values a particular combination, the customer may not be able to justify the potential additional charges.
Service Economics
Service economics relate to the balance between the cost of providing services, the value of the outcomes achieved, and the returns that the services enable the service provider to achieve.
The dynamics of service economics for external service providers are different from those for internal service providers. This is because the returns of internal service providers are mainly measured by their internal customers and do not accrue directly to the service provider.
Service economics relies on four main areas:
- Service portfolio management is the process that defines the outcomes the business desires to achieve and the services that will be used to achieve them.
- Financial management for IT services is the process used to calculate, forecast, and track costs and income related to services.
- Return on investment (ROI) is the measurement of the expected or actual benefit of an investment.
- Business impact analysis (BIA) allows an organization to establish the relative priorities of service based on their effect on the business if it is not available for a period of time.
Figure 2.22 shows the service economic dynamics for external service providers.

Figure 2.22 Service economic dynamics for external service providers
Copyright © AXELOS Limited 2010. All rights reserved. Material is reproduced under license from AXELOS.
A Type III service provider delivers a service to an external customer for payment. The service provider calculates the total investment required to deliver that service and measures it against the total revenue obtained from delivering the service. The success of the service provider is measured by the return on its investment (ROI).
Figure 2.23 shows the service economic dynamics for internal service providers. It is significantly different than the previous diagram relating to external service providers.

Figure 2.23 Service economic dynamics for internal service providers
Copyright © AXELOS Limited 2010. All rights reserved. Material is reproduced under license from AXELOS.
Return on Investment
The return on investment cannot be measured by an internal service provider in isolation from its internal customers. In the diagram in Figure 2.23, the IT service provider delivers a service to another business unit, which covers the costs of the IT service.
The investment in the IT service is carried by the business unit and not the service provider. This means that the funding provided to the IT service provider cannot be viewed as a return on investment; the investment is being made by the business unit. The return has to be calculated based on the profitability generated by the business unit, and the ROI calculation is carried out by the business unit.
Return on investment (ROI) is a recognized concept for quantifying the value of an investment. The calculation is normally performed by financial management. The term is not always used consistently, sometimes being used to refer to business performance. In service management, ROI is used as a measure of the ability to use assets to generate additional value.
In the simplest sense, it is the increase in profit resulting from the service divided by the total investment in the service. This calculation is overly simplistic because there are a number of subjective factors to be considered in service management value for a customer.
To cover this subjectivity, ITIL covers three main areas in ROI:
- The business case, which is a means to identify business imperatives that depend on service management
- Pre-program ROI, which includes techniques for quantitatively analyzing an investment in service management
- Post-program ROI, which includes techniques for retroactively analyzing an investment in service management
Business Case
A business case is a decision support and planning tool that projects the likely consequences of a business action. The outcome may be assessed on both qualitative and quantitative criteria. A financial analysis is often central to a good business case.
Business objectives are an important part of the business case because they will be the justification for the request for funding. There is a difference between the business objectives of a profit organization and nonprofit organization. This must be part of the consideration for any service provider when constructing a business case.
Business impact is another essential part of the business case, but it is often only based on cost analysis. If there is a nonfinancial business impact, it should be linked to a business objective to provide a value.
A minimum sample business case structure includes an introduction, presenting the business objectives to be addressed, followed by the methods and assumptions that have been used. This defines the boundaries of the business case, such as the time period and how benefits and costs are being calculated.
The business impacts section of the business case covers the financial and nonfinancial results that are expected. This often includes expressing nonfinancial results in financial terms, such as translating staff improvements as a reduction in expenditure on training and hiring.
Risks and contingencies will be important for the decision-making process and must be included in the business case.
The final section should cover the recommendations and specific actions.
Pre-program ROI
The term capital budgeting is used to describe how managers plan significant outlays on projects that have long-term implications. A service management initiative may sometimes require capital budgeting to fund the project or service.
An additional factor to remember when performing pre-program ROI is the relative value of the investment over time. An investment typically occurs early, while returns do not occur until sometime later.
Capital budgeting falls into two broad categories:
- Screening decisions relate to whether a proposed service management initiative passes a predetermined requirement—for example, a minimum return. Screening decisions are usually made using a discounted cash flow method of net present value (NPV).
- Preference decisions relate to choosing from among several competing alternatives—for example, electing between an internal service improvement plan (SIP) and a service sourcing program. Preference decisions are usually made using a discounted cash flow method of internal rate of return (IRR).
In screening decisions (using net present value), the program’s cash inflows are compared to the cash outflows over time. The value of the money spent today will probably change over time due to inflation, currency fluctuations, and so on. This fluctuation in the value of income and expenditure over a period of time is called the discounted cash flow.
These discounted cash flows need to be taken in account when ROI calculations are used to calculate the return over a period of time. The difference, called net present value, determines whether or not the investment is suitable. If the NPV is positive, the return is greater than the minimal rate of term, and the program is considered acceptable. If the NPV is zero, this means that the return is equal to the minimal rate of return, which again, may be acceptable. Whenever the net present value is negative, the investment is unlikely to be suitable. This is shown in Table 2.4.
Table 2.4 NPV decisions
| If the NPV is: | Then the program is: |
| Positive | Acceptable. It promises a return greater than the required rate of return. |
| Zero | Acceptable. It promises a return equal to the required rate of return. |
| Negative | Unacceptable. It promises a return less than the required rate of return. |
Table 2.5 shows an example of the calculation of the net present value.
Table 2.5 Example of NPV
| Initial investment | $70,000 |
| Investment window | 5 years |
| Annual cost savings | $20,000 |
| Required rate of return (i) | 10% |
You can see the initial investment value, the time frame (5 years), and the annual cost savings being achieved, along with the required rate of return (10%).
In Table 2.6, you can see the application of the discounted cash flow to show the final total, which shows that the NPV is positive, producing a return of over five thousand dollars at the end of the five-year period.
Table 2.6 Example of NPV of a proposed service management program
| Years | Amount of cash flow ($) | Discount of 20% | Present value of cash flow (S) | |
| 1 to 5 | 16,500 | 2.991* | 49,352 | |
| Initial investment | Now | (50,000) | 1 | –50,000 |
| Net present value | –648 | |||
| Initial investment: $50,000; investment window: 5 years; annual cost savings: $16,500; salvage value: 0; required rate of return: 20% | ||||
*Present value of an annuity of $1 in 5 years’ arrears.
Preference Decisions (Using Internal Rate of Return)
While many opportunities pass the screening decision process, not all can be acted on. Financial or resource constraints may require comparison of alternatives. Preference decisions, sometimes called rationing or ranking decisions, must be made. The competing alternatives are ranked.
Simply calculating and comparing the NPV of one project with that of another does not compare the actual size of the investment and returns. As a result, the internal rate of return (IRR) is widely used for preference decisions. The higher the internal rate of return, the more desirable the initiative.
The IRR, sometimes called the yield, is the rate of return over the life of an initiative. IRR is computed by finding the discount rate that equates the present value of a project’s cash outflows with the present value of its inflows. That is, the IRR is the discount rate resulting when an NPV of zero is achieved (or the exact time when the project will break even and start producing a positive contribution).
In Table 2.7, the calculation of IRR is based on the previous example we used for NPV.
Table 2.7 Example of the IRR of a proposed service management program
| Years | Amount of cash flow ($) | Discount of 19–20% | Present value of cash flow (S) | |
| Annual cost savings | 1 to 5 | 16,500 | 3.0303 | 50,000 |
| Initial investment | Now | (50,000) | 1 | –50,000 |
| Net present value | 0 | |||
| Initial investment: $50,000; investment window: 5 years; annual cost savings: $16,500; salvage value: 0; required rate of return: 20% | ||||
Both of the project options have a positive NPV, but project 2 (Table 2.7) shows a greater internal rate of return than project 1 (Table 2.6). This conclusion is based only on financial return and does not include any nonfinancial returns that may be achieved from the projects.
Post-program ROI
Many companies successfully justify service management implementations through qualitative arguments, without a business case or plan, often ranking cost savings as a low business driver.
But without clearly defined financial objectives, companies cannot measure the added value brought about by service management, thereby introducing future risk in the form of strong opposition from business leaders.
Stakeholders may question the value of a service management program. Without proof of value, executives may cease further investments. Therefore, all significant projects should be subjected to a post-program ROI analysis. However, if service management is initiated without prior ROI analysis, it is even more important that an analysis be conducted at an appropriate time after (when the anticipated returns can reasonably be measured).
Figure 2.24 illustrates the model for a post-program ROI.
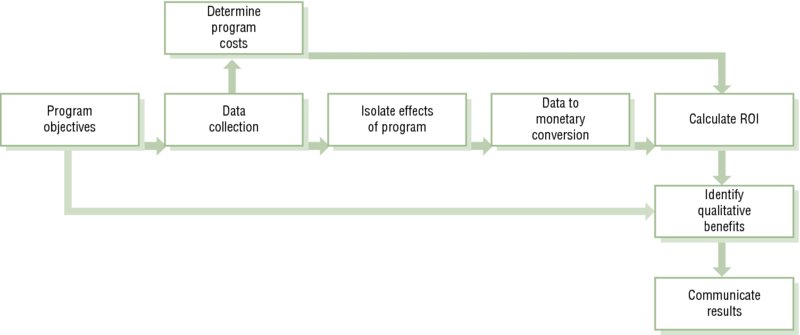
Figure 2.24 Post-program ROI approach
Copyright © AXELOS Limited 2010. All rights reserved. Material is reproduced under license from AXELOS.
Once the objectives of the program have been identified, data collection takes place to determine the program costs. Understanding the effects of the program, and how they will be expressed in a suitable monetary format, will lead to the calculation of the ROI based on the program costs and expected returns.
The forecast analysis (Figure 2.25) for the success of a program shows a trend-line analysis (or another forecasting model), which is used to project data points had the program not taken place.

Figure 2.25 Forecast analysis
Copyright © AXELOS Limited 2010. All rights reserved. Material is reproduced under license from AXELOS.
This kind of visual analysis is a very clear demonstration of the effect of an improvement program, as shown by the two different trend lines achieved by assessment of the different amounts of funding applied.
Business Impact Analysis
Business impact analysis (BIA) is a method used to evaluate the relative value of services and is often performed as part of service portfolio management.
Instead of analyzing the positive returns of the services, BIA examines what would happen if the service was not available, or only partially available, over different periods of time. The value of this method is that it is easy for the customer to express the value of the service in terms that are meaningful to it—both financial and nonfinancial.
An advantage of this approach for internal service providers is that it is an excellent communication tool, demonstrating to their customers that they have understood their priorities and how they have allocated their resources.
This focus on assessing the outages of services, combined with assessing the severity of the outage, makes it a useful method for IT service continuity management and other related service management processes and functions. It will help to answer useful questions about the organization and to support the choices that need to be made to support the required business outcomes.
The BIA high-level activities are as follows:
- Arrange resources from business and IT for the analysis.
- Prioritize candidate services.
- Identify core analysis points for risk and impact assessment.
- Weight the risk and impact elements from a business perspective.
- Score services against weighted risk elements.
- List services in order of risk profile.
- Agree on standard time period for comparing outage costs.
- Calculate the financial impact of each service.
- List services in order of financial impact.
- Generate charts showing company’s risk and financial impact for specific services.
Using the results of business impact analysis enables the business to decide on the priorities of service provision in a meaningful way—by comparing the investment in the service with the cost of not having it (or having access at a reduced level). This is an important aspect of strategy.
Sourcing Strategy
Sourcing is about analyzing how to most effectively source and deploy the resources and capabilities required to deliver outcomes to customers. The sourcing strategy should enable a decision about the best combination of supplier types to support the objectives of the organization and the effective and efficient delivery of services.
A service strategy should enhance an organization’s special strengths and core competencies. Each component should reinforce the other; change one and the whole model changes.
As organizations seek to improve their performance, they should consider which competencies are essential. Partnering in areas both inside and outside the organization will enhance these core competencies.
Outsourcing moves a value-creating activity from inside the organization to outside the organization, where it will be performed by another company. The decision to outsource is based on a comparison. Does the extra value generated from performing an activity inside the organization outweigh the costs of managing it internally? This decision can change over time.
IT services are increasingly delivered by service providers outside the enterprise. Making an informed service sourcing decision requires finding a balance between thorough qualitative and quantitative considerations. Deciding to outsource is about finding ways to improve the competitive differentiation of the organization by redeploying resources and capabilities outside of the organization.
Any capabilities and resources that are only marginally related to the organization’s core strategy and differentiation should be considered for outsourcing. Once potential candidates for sourcing are identified, the following questions can be used to clarify matters:
- Do the candidate services improve the business’s resources and capabilities?
- How closely are the candidate services connected to the business’s competitive and strategic resources and capabilities?
- Do the candidate services require extensive interactions between the service providers and the business’s competitive and strategic resources and capabilities?
If the responses reveal minimal dependencies and infrequent interactions between the sourced services and the business’s competitive and strategic positioning, then the candidates are strong contenders.
If candidates for sourcing are closely related to the business’s competitive or strategic positioning, then care must be taken. The sourcing risks must be considered:
Substitution “Why do I need the service provider when its supplier can offer the same services?” The sourced vendor develops competing capabilities and replaces the sourcing organization.
Disruption The sourced vendor has a direct impact on the quality or reputation of the sourcing organization.
Distinctiveness The sourced vendor is the source of distinctiveness for the sourcing organization. The sourcing organization then becomes particularly dependent on the continued development and success of the sourced organization.
Care should be taken to distinguish between distinctive activities and critical activities. Critical activities do not necessarily refer to activities that may be distinctive to the service provider. For example, although customer service is most likely critical, if it does not differentiate the provider from competing alternatives, then it is not distinctive, referred to here as context.
Regardless of where services, capabilities, or resources are sourced from, the organization retains accountability for their adequacy. Outsourcing does not mean that a service or its performance are no longer important. Outsourcing a capability, resource, or service does not mean outsourcing the governance of what that item does. The organization should adopt a formal governance approach to manage its outsourced services in addition to assuring the delivery of value.
Sourcing Structures
The following sections present an overview of the predominant sourcing structures. These sourcing structures also represent the strategy that the organization is using to deliver its services.
Insourcing
This approach relies on utilizing internal organizational resources in the design, development, transition, maintenance, operation, and/or support of new, changed, or revised services.
Outsourcing
This approach utilizes the resources of an external organization or organizations in a formal arrangement to provide a well-defined portion of a service’s design, development, maintenance, operations, and/or support. This includes the consumption of services from application service providers (ASPs), described later.
Co-sourcing or Multi-sourcing
Co-sourcing or multi-sourcing is often a combination of insourcing and outsourcing, using a number of organizations working together to co-source key elements within the lifecycle. This generally involves using a number of external organizations working together to design, develop, transition, maintain, operate, and/or support a portion of a service.
Partnership
A partnership is a formal arrangement between two or more organizations to work together to design, develop, transition, maintain, operate, and/or support IT service(s). The focus here tends to be on strategic partnerships that leverage critical expertise or market opportunities.
Business Process Outsourcing
Business process outsourcing (BPO) is an increasing trend of relocating entire business functions using formal arrangements between organizations. One organization provides and manages the other organization’s entire business process(es) or function(s) in a low-cost location. Common examples are accounting, payroll, and call center operations.
Application Service Provision
This involves formal arrangements with an application service provider (ASP) organization that will provide shared computer-based services to customer organizations over a network from the service provider’s premises. Applications offered in this way are also sometimes referred to as on-demand software/applications. Through ASPs, the complexities and costs of such shared software can be reduced and provided to organizations that could otherwise not justify the investment. For example, Google now provides Gmail and Google Docs as additional service functionality for users.
Knowledge Process Outsourcing
Knowledge process outsourcing (KPO) is a step ahead of BPO in one respect. KPO organizations provide domain-based processes and business expertise rather than just process expertise. In other words, the organization is required to not only execute a process, but also to make certain low-level decisions based on knowledge of local conditions or industry-specific information. For example, when credit risk assessment is outsourced, the outsourcing organization has historical information that it has analyzed to create knowledge, which in turn enables it to provide a service. Every credit card company collecting and analyzing this data for themselves would not be as cost effective as using KPO.
Cloud
Cloud service providers offer specific predefined services, usually on demand. Services are usually standard, but they can be customized to a specific organization if there is enough demand for the service. Cloud services can be offered internally but generally refer to outsourced service provision.
Multi-vendor Sourcing
This type of sourcing involves sourcing different services from different vendors, often representing different sourcing options from the options we have just explored.
Sourcing Responsibilities
The responsibilities associated with sourcing include monitoring both the performance of agreements and the relationship with service providers. It is still important to manage the sourcing agreements, whether they are in-house or outsourced. Provision of an escalation point for issues and problems is a key part of the management strategy, and it is necessary to ensure that providers understand the organization’s priorities.
There will be specific dependencies to achieve the outcomes that the customer requires. It is important to focus on what the service provider is expected to do, including the resource alignment and organizational structures. Understanding the dynamics of the services will affect the way the resources are distributed across the organization. It will drive the management and introduction of new skills, including business, technical, and behavioral requirements.
In this environment, sourcing services from multiple providers has become the norm rather than the exception. The organization maintains a strong relationship with each provider, spreading the risk and reducing costs. It should also be noted that providers may represent different types of sourcing options from the options we explored earlier.
Governing and managing multiple providers, who often have little to do with each other outside of the common customer, can be challenging. When sourcing multiple providers, the following issues should be carefully evaluated:
Technical Complexity Sourcing services from external service providers is useful for standardized service processes (although as customization increases, it is more difficult to achieve the desired efficiencies).
Organizational Interdependencies Contracts should be carefully structured to address the dynamics of multiple organizations, ensuring that all providers undergo consistent training in the customer organization’s processes. Also, contracts should include incentives designed to encourage consistency in contractual performance between providers.
Integration Planning The processes, data, and tools of each organization may be different or they may be duplicated. Either case will require the integration of certain processes, data, and tools. In addition, it is critical that the reporting of each organization is integrated, so that governance can be performed consistently across each organization.
Managed Sourcing This refers to the need for a single interface to the multiple vendors wherever appropriate. A sure recipe for failure in a multi-sourced environment that requires collaboration between service providers is to have each contract negotiated and managed by different groups within the organization.
There are multiple approaches and varying degrees in sourcing. How far up an organization is willing to go with sourcing depends on the business objectives to be achieved and constraints to overcome. Figure 2.26 illustrates the limitations (expressed as the capability and scale ceilings) experienced at each of three levels of sourcing and then indicates the additional benefits or features that can be gained by moving to the next level.

Figure 2.26 The service sourcing staircase
Copyright © AXELOS Limited 2010. All rights reserved. Material is reproduced under license from AXELOS.
It is important to note that this figure does not imply that any single form of sourcing is better than another, merely that there are different potential benefits as the organization moves up the staircase. Whether or not these benefits can be achieved by each organization for each service will need to be assessed.
In the figure, an organization with limitations in internal capability might move to an outsourcing model where a single outsourcing organization is used to augment current capabilities through economies of scale (for example, specialized, expensive capabilities can be shared across more than one customer, making them available at a lower overall cost to all customers).
A single-vendor outsourcing contract will eventually be limited in what it can provide to a large, complex customer base, requiring customers to source services from multiple providers.
Regardless of the sourcing approach, senior executives must carefully evaluate provider attributes. The following is a useful checklist:
Demonstrated Competencies In terms of staff, use of technologies, innovation, industry experience, and certifications (for example, ISO/IEC 20000)
Past Achievements In terms of service quality attained, financial value created, and demonstrated commitment to continual improvement
Relationship Dynamics In terms of vision and strategy, the cultural fit, relative size of contract in their portfolio, and quality of relationship management
Quality of Solutions Relevance of services to your requirements, risk management, and performance benchmarks
Overall Capabilities In terms of financial strength, resources, management systems, and scope and range of services
Commitment to Transferred Personnel In terms of their longer-term retention, personal development, and career opportunities
In a complex multi-vendor environment, there needs to be good relationships between the various service providers. Guidelines and reference points are needed to refer to technology, procedures, or organization structures. One method of formalizing these reference points is through the use of service provider interfaces (SPIs).
A service provider interface is a formally defined reference point that identifies some interaction between a service provider and a user, customer, process, or one or more suppliers. SPIs are generally used to ensure that multiple parties in a business relationship have the same points of reference for defining, delivering, and reporting services. They also help to coordinate end-to-end management of critical services.
The service catalog drives the service specifications, which are part of standard process definitions. Responsibilities and service levels are negotiated at the time the sourcing relationship is established and include the following:
- Identification of integration points between various management processes of the client and service provider
- Identification of specific roles and responsibilities for managing the ongoing systems management relationship with both parties
- Identification of relevant systems management information that needs to be communicated to the customer on an ongoing basis
The SPIs also have to consider more than live services. There is a need for management, strategy, and transition activities as well as live services. This is especially true if the outsourced service provider is seen as a strategic partner in transforming the client’s business or business model.
In Figure 2.27, you can see how SPIs can be used.

Figure 2.27 Using service provider interfaces
Copyright © AXELOS Limited 2010. All rights reserved. Material is reproduced under license from AXELOS.
Process SPI definitions consist of the following elements:
- Technology prerequisites (e.g., management tool standards or prescribed protocols)
- Data requirements (e.g., specific events or records), formats (i.e., data layouts), interfaces (e.g., APIs, firewall ports), and protocols (e.g., SNMP, XML)
- Nonnegotiable requirements (e.g., practices, activities, operating procedures)
- Required roles/responsibilities within the service provider and customer organizations
- Response times and escalations
SPIs are defined, maintained, and owned by process owners. Others involved in the definition are as follows:
- Business representatives, who negotiate the SPI requirements and are responsible for managing the strategic relationships with and between service providers
- Service provider process coordinator(s), who take operational responsibility for ensuring that operational processes are synchronized
Governance
Sourcing governance is a complex area. There is a frequent misunderstanding of the definition of governance, particularly in the context of sourcing. Companies have used the word interchangeably with vendor management, supplier management, and sourcing management organization. Governance is none of these.
Governance refers to the rules, policies, processes (and in some cases, laws) by which businesses are operated, regulated, and controlled. These are often defined by the board or shareholders or by the constitution of the organization, but they can also be defined by legislation, regulation, or consumer groups.
Management and governance are different disciplines. Management deals with making decisions and executing processes. Governance is the framework of decision rights that encourage desired behaviors in the sourcing and the sourced organization.
Governance is a major factor in a sourcing strategy. It should include the following components:
A Governance Body With a manageably sized governance body with a clear understanding of the service sourcing strategy, decisions can be made without escalating to the highest levels of senior management. When representation from each service provider is included, stronger decisions can be made.
Governance Domains Domains can cover decision-making for a specific area of the service sourcing strategy. Domains can cover, for example, service delivery, communication, sourcing strategy, or contract management. A governance domain does not include the responsibility for its execution, only its strategic decision-making.
Creation of a Decision-Rights Matrix This ties all three recommendations together. RACI charts are common forms of a decision-rights matrix.
Supplier Management This ensures that contracts and external service providers are managed according to the organization’s governance policies, standards, and controls.
It is important to understand the costs and risks associated with changing from one sourcing model to another. The costs of change can sometimes overshadow any benefit, and the additional management of an outsourced contract can eat into expected savings.
In addition, the risk of moving critical operational activities from one entity to another can be disruptive, and can be irrevocably damaging if this disruption is felt over an extended time. It is important to consider the following critical success factors when making the decision to ensure a successful sourcing strategy:
- Desired outcomes, such as cost reduction, improved service quality, and diminished business risk
- The optimal model for delivering the service
- The best location to deliver the service, such as local, onshore, nearshore, or offshore
The recommended approach to deciding on a strategy includes these three points:
- Ensuring that there is analysis of the organization’s internal service management competencies
- Comparison of those findings with industry benchmarks
- Assessment of the organization’s ability to deliver strategic value
When the results of the strategic assessment are considered, the sourcing strategy will depend on the levels of competence of service management within the organization.
If the organization’s internal service management competence is high and also provides strategic value, then an internal or shared services strategy is the most likely option. The organization should continue to invest internally, leveraging high-value expert providers to refine and enhance the service management competencies.
If the organization’s internal service management competence is low but provides strategic value, then outsourcing is an option, provided services can be maintained or improved through the use of high-value providers.
If the organization’s internal service management competence is high but does not provide strategic value, then there are multiple options. The business may want to invest in its service capabilities so that they do provide strategic value, or it may sell off these service capabilities because they may be of greater value to a third party.
If the organization’s internal service management competence and strategic value are low, then they should be considered candidates for outsourcing.
Prior to any implementation, an organization should establish and maintain a baseline of its performance metrics. Without such metrics, it will be difficult to assess the true impact and trends of a service sourcing implementation.
Measurements can take on two forms:
Business Metrics Financial savings, service level improvements, business process efficiency
Customer Metrics Availability and consistency of services, increased offerings, quality of service
Service Strategy Inputs and Outputs
The main outputs from service strategy are the vision and mission, strategies and strategic plans, the service portfolio, change proposals, patterns of business activity, and financial information.
Table 2.8 looks at the major service strategy inputs and outputs by lifecycle stage. Spend some time reviewing these inputs and outputs because they provide important information about the interaction of service strategy across the service lifecycle.
Table 2.8 Service strategy inputs and outputs by lifecycle stage
| Lifecycle stage | Service strategy inputs (from the lifecycle stages in the first column) | Service strategy outputs (to the lifecycle stages in the first column) |
| Service design | Input to business cases and the service portfolio Service design packages Updated service models Service portfolio updates, including the service catalog Financial estimates and reports Design-related knowledge and information in the service knowledge management system (SKMS) Designs for service strategy processes and procedures | Vision and mission Service portfolio Policies Strategies and strategic plans Priorities Service charters, including service packages and details of utility and warranty Financial information and budgets Documented patterns of business activity and user profiles Service models |
| Service transition | Transitioned services Information and feedback for business cases and the service portfolio Response to change proposals Service portfolio updates Change schedule Feedback on strategies and policies Financial information for input to budgets Financial reports Knowledge and information in the SKMS | Vision and mission Service portfolio Policies Strategies and strategic plans Priorities Change proposals, including utility and warranty requirements and expected timescales Financial information and budgets Input to change evaluation and change advisory board (CAB) meetings |
| Service operation | Operating risks Operating cost information for total cost of ownership (TCO) calculations Actual performance data | Vision and mission Service portfolio Policies Strategies and strategic plans Priorities Financial information and budgets Demand forecasts and strategies Strategic risks |
| Continual service improvement | Results of customer and user satisfaction surveys Input to business cases and the service portfolio Feedback on strategies and policies Financial information regarding improvement initiatives for input to budgets Data required for metrics, key performance indicators (KPIs), and critical success factors (CSFs) Service reports Requests for change (RFCs) for implementing improvements | Vision and mission Service portfolio Policies Strategies and strategic plans Priorities Financial information and budgets Patterns of business activity Achievements against metrics, KPIs, and CSFs Improvement opportunities logged in the CSI register |
As part of the interaction with service design, there are inputs from service design to service strategy, with examples such as information for business cases, the service design package, and information in the service knowledge management system (SKMS).
Example outputs from service strategy to service design include the vision and mission, the service portfolio, policies and priorities, and financial information.
Example inputs from service transition include transitioned services, response to change proposals, change schedule, and knowledge and information in the SKMS.
Example outputs from service strategy include the service portfolio, policies, priorities, and financial information and budgets.
Input examples from service operation include operating risks, cost information, total cost of ownership, and actual performance data.
Output examples from service strategy service operation include the vision and mission, service portfolio, priorities, and strategic risks.
All lifecycle stages are subject to and interact with continual service improvement, and strategy is no different. Examples here include inputs of the results from customer satisfaction survey, financial information on improvement initiatives, and service reports. Output examples include the vision and mission, service portfolio, priorities, and patterns of business activity.
Summary
This chapter covered the elements of service strategy that are necessary to understand, use, and apply the processes within service strategy to create business value. We discussed the use of the knowledge, interpretation, and analysis of service strategy principles, techniques, and relationships and the application for creation of effective service strategies.
We explored the basics of service strategy, including how to decide on a strategy, and the impact the strategy may have, such as being able to outperform competitors. We reviewed the four Ps of service strategy and then went on to describe the terms and concepts for service value, including utility and warranty.
We considered the concepts relating to service assets and service providers, including the steps to define a service. We reviewed the Kano model, used to ensure customer satisfaction, and service economics, to understand the importance of return on investment and business impact analysis on service strategy.
Finally, we looked at the sourcing strategy and how service strategy relates to the rest of the service lifecycle.
Exam Essentials
Understand the importance of a service strategy. Without a specific strategy to guide the approach to IT, there is a serious risk of mismanagement or not providing what the customer requires.
Know the basic approaches to choosing a strategy. Understand the organizational requirements and constraints that are present when choosing a strategy.
Understand and expand on the features of opposing dynamics. Be able to explain the concept of opposing dynamics—future versus present requirements, and operational effectiveness versus improvements.
Explain the four Ps of service strategy. The four Ps of service strategy are perspective and vision of the customer, position relating to other providers, plans to meet business requirements, and patterns of business.
Understand and explain service value in the context of the organization. Explain the use of the terms utility and warranty in the development of service value, when agreeing on a strategy.
Understand the use of assets and service providers. Be able to explain how assets are allocated and used as part of the service strategy. Understand the types of service providers and how to select the most appropriate for the strategy.
Be able to explain the eight steps of defining a service. Understand and explain the use of the eight steps in defining a service, from step 1, “Define the market and identify customers,” through step 8, “Define service units and packages.”
Understand and explain the Kano model. The Kano evaluation model assists with the understanding of customer expectations and how a service provider can adapt its services to meet the changing customer environment.
Understand the use of service economics. Understand the use of financial management and the approach to service economics as defined in the service lifecycle. It will not be necessary to be able to calculate return on investment as part of the examination.
Explain and justify the use of sourcing strategies. Be able to explain and rationalize the use of the various sourcing strategies in given circumstances.
Recognize and explain the inputs and outputs of service strategy. Be able to explain the position of the service strategy in relation to the other service lifecycle stages.
You can find the answers to the review questions in the appendix. Which of these options represents the correct connection of concepts in the opposing dynamics of service strategy? What is the definition of a business outcome? Which of these is the correct set of service types as described in service strategy? On what elements do customers calculate the economic value of a service? True or False? Utility means fit for purpose, and warranty means fit for use. Which is the correct combination of concepts for the Type I service provider ? (Choose all that apply.) Put these steps in the correct order to successfully define a service: Define services based on outcomes. Quantify the outcomes. Understand the opportunities. Agree service models. Understand the customer. Define the market and identify customers. Define service units and packages. Classify and visualize the service. ROI is composed of three activities in ITIL. Which activity is performed during post-program ROI? Which of these elements comprise the minimum requirements in a business case? (Choose all that apply.) Which of these are valid sourcing structures described in ITIL? (Choose all that apply.)Review Questions