
3
Active Power, Reactive Power and Power Factor
In this chapter we will consider the concept of electrical power as it applies to AC circuits. We shall see that unlike DC circuits, where the power dissipated can be found from the product of the voltage and current, in the AC case there are two forms of power to be considered, active power and reactive power, each of which must be generated somewhere within the AC network.
But before we begin, it is necessary to clearly distinguish between the concepts of power and energy. Energy (E) is added to a system the result of performing work on it; the unit of energy is the joule. For example, the energy stored within a capacitor is proportional to the square of its terminal voltage. To increase this energy, additional charge must be accumulated, and thus work must be done to increase the stored charge, against the force of the existing electric field.
Power is defined as the rate of delivery of energy, or the rate of doing work, and is therefore measured in joules per second, or watts. We can summarise this in the following simple equation:

Power is positive when work is done on a system and therefore its energy content increases, (e.g. increasing the charge on our capacitor) and negative when work is done by the system, which is accompanied by a loss of system energy (discharging our capacitor into a resistor).
Suppose a room is warmed by adding heat at a rate of 1000 watts (1 kW) for one hour, as evidenced by a rise in its temperature. This is equivalent to adding 3,600,000 joules over this period, or in electrical terms, by adding the energy equivalent of one kilowatt‐hour (kWh). Electrical energy is traditionally sold in kilowatt hours, whereas the energy stored in LP gas is sold in either in megajoules (MJ) or gigajoules (GJ).
3.1 Single‐Phase AC Power
The power in an AC circuit can be evaluated by considering the average of the product of the applied AC voltage and the resulting current. However, because of the sinusoidal nature of both these quantities, the AC analysis is considerably more complex than the DC one. We will initially consider this product in the case of a single‐phase circuit, and then we will generalise our analysis to include the three‐phase case.
Consider the product of a sinusoidal voltage and current, delivered to a single‐phase load and displaced from one another by a phase angle ϕ.
Thus if
we can write
where ω is the angular frequency (2πf ), ![]() and î are the peak values of the voltage and current respectively, and ϕ is the angle by which the current lags the voltage.
and î are the peak values of the voltage and current respectively, and ϕ is the angle by which the current lags the voltage.
The product of the voltage and current can be written:

3.2 Active Power
The first term in Equation (3.1) varies at twice the system frequency, as shown in Figure 3.1, since whenever either the voltage or the current pass through zero, the power waveform changes sign.

Figure 3.1 Active power waveform:  . (VRMS = 230 V, IRMS = 1 A and ϕ = 60°).
The average value of the V(t)I(t) waveform can be expressed in terms of the RMS voltage and current as VRMSIRMS cos(ϕ), and is called the active power, for which we use the symbol P. It represents the average rate at which energy is flowing from the voltage source to the load and is expressed in joules per second or more usually in watts.
The V(t)I(t) product in Figure 3.2 is negative whenever either the voltage or the current waveforms (but not both) are negative; at all other times this product is positive. Its average value depends on the angle between the voltage and the current, usually called the phase angle, ϕ. In this example, the voltage has a magnitude of 230 VRMS and the current 1 ARMS. In addition the current lags the voltage by 60° – it goes through its positive going zero crossing 60° after the voltage does. So the active power flow P, is equal to 230 Cos(60) = 115 W; equal to the average value of the trace in Figure 3.1.

Figure 3.2 Instantaneous V(t)I(t) product (bottom trace). (VRMS = 230 V, IRMS = 1 A, ϕ = 60° lagging).
3.3 Reactive Power
During the negative portion of the power waveform in Figure 3.2, energy is being returned to the supply. This suggests that the current flowing in the circuit is actually larger than would be required to deliver 115 W to the load if the phase angle were able to be made equal to zero. A little reflection will show that this is indeed the case; with zero phase angle a current of only ½ ARMS is required for the same power transfer.
The second term in Equation (3.1), VRMSIRMS sin(ϕ)sin(2ωt), reflects this effect. This also varies sinusoidally at twice the system frequency, as shown in Figure 3.3; however, this waveform has a zero average – there is no net power flow. We call the magnitude of this sinusoid the reactive power, for which we use the symbol Q. Reactive power has the dimension volt‐amps, but to highlight its reactive nature we define the units of Q as volt‐amps reactive, or VArs. Reactive power reflects the fact that with either lagging or leading phase angles there is a continuous and lossless exchange of energy between the source and the load, in addition to the active power flowing. As a result a larger current is required than would be needed to support the active power flow alone.

Figure 3.3 Reactive power waveform: VRMSIRMS sin(ϕ)sin(2ωt). (VRMS = 230 V, IRMS = 1 A and ϕ = 60°).
We can therefore write:
Since the VAr flow in Figure 3.3 averages zero there is no net energy associated with it; however, this does not mean it can be ignored. Both P and Q must be generated somewhere in the electrical system. The active power must be produced by a generator, which requires an external energy source. On the other hand, the generation of reactive power does not require a supply of energy; it will usually be generated within the electrical network itself, partially by the distributed capacitances within the system, but more so by the action of grid connected capacitors that are switched into the network as the need for reactive power arises. Finally, some of the required reactive power required will be produced by generators, although this will generally be at the expense of the production of active power. As we shall see in Chapter 6, the provision of sufficient reactive power is essential for maintaining the voltage level throughout the AC network.
There are two cases where reactive power occurs without any the need for active power to be generated. The first case relates to the current drawn by a pure inductance. As we saw in Chapter 2, an inductor’s current lags the applied voltage by 90°, (ϕ = − 90) and therefore according to Equations (3.2) and (3.3) the active power transferred will be zero, while the reactive power is equal to the product of the bus voltage and the inductor current, VRMSIRMS, as shown in Figure 3.4.
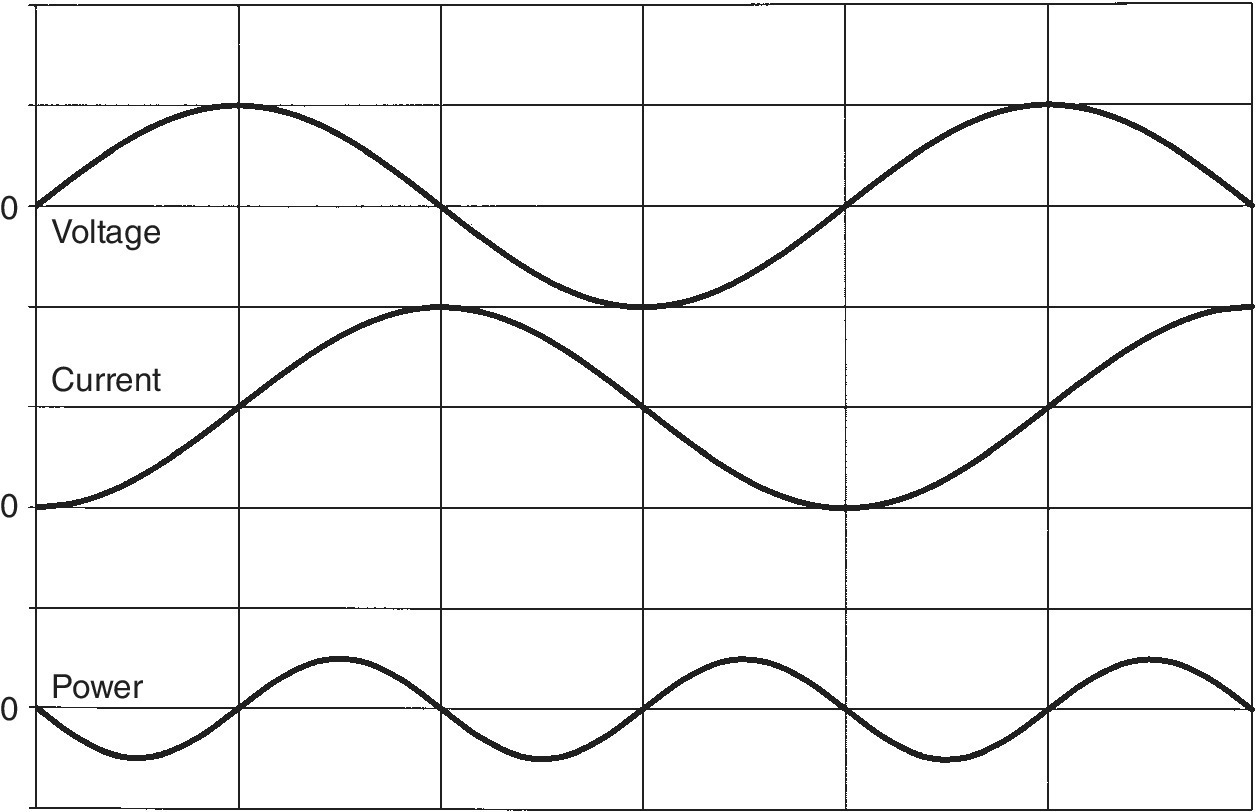
Figure 3.4 Inductive voltage, current and power waveforms.
The second case, although similar to the first, relates to the current drawn by a capacitor which leads the voltage by 90°, (ϕ = + 90). According to Equations (3.2) and (3.3) the active power will equal zero, while the reactive power will equal VRMSIRMS, as shown in Figure 3.5.

Figure 3.5 Capacitive voltage, current and power waveforms.
There is one vital difference between these cases, however, which relates to the relative direction of these power flows. According to Equation (3.3) the reactive power demanded by the inductor has the opposite sign to that required by the capacitor, since the phase angles are of opposite sign. Therefore the reactive power consumed by an inductor can be generated by a capacitor. This can be readily demonstrated by connecting a capacitor and an inductor in parallel across an AC source. If XC = XL at the system frequency, then the capacitor will exactly generate the reactive power required by the inductor and, as a result, there will be a lossless exchange of reactive power between the two, while virtually no current is drawn from the source. (This is precisely the operation of a parallel resonant circuit.)
Finally, in a purely resistive circuit, the voltage and current lie in phase and ϕ = 0. Figure 3.6 shows the associated current and voltage waveforms as well as the power waveform. Here the amplitude of the power waveform is ![]() or 460 W, while the average power flowing is half this figure, or
or 460 W, while the average power flowing is half this figure, or ![]() . The lack of reactive power means that, from the network perspective, this represents the most efficient way of delivering power to a load.
. The lack of reactive power means that, from the network perspective, this represents the most efficient way of delivering power to a load.

Figure 3.6 Resistive voltage, current and power waveforms.
3.4 Apparent Power or the volt‐amp Product, S
Most loads on the electrical system draw currents that lag the supply voltage. This is due to the inductive nature of electromagnetic devices such as motors and transformers. Figure 3.7 illustrates that a lagging current can be resolved into two components: one in phase with the voltage, the other in quadrature with it, (i.e. 90° out of phase). The in‐phase component, equal to I cos(ϕ), is associated with the active power P, while the quadrature component, equal to I sin(ϕ), is associated with the reactive power Q demanded by the load.

Figure 3.7 In‐phase and quadrature current components.
Figure 3.7 suggests that P and Q are also in quadrature, and therefore their sum, called the complex power, can be written as:.

Thus the apparent power S is simply the VI product, thus ![]() . It has the unit volt‐amps expressed as VA, and it therefore follows that:
. It has the unit volt‐amps expressed as VA, and it therefore follows that:
We summarise this relationship in the form of the power triangle shown in Figure 3.8.
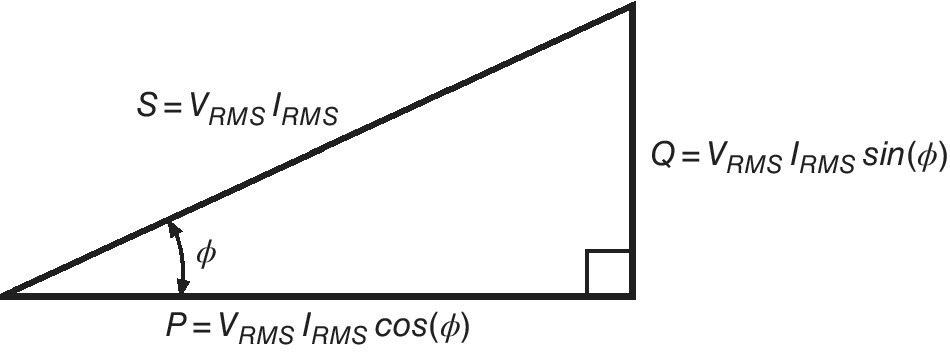
Figure 3.8 Power triangle.
3.5 Three‐Phase Power
Let us re‐evaluate the VI product, this time in the case of a three‐phase supply delivering balanced currents, perhaps to a synchronous motor or an induction motor. In this case, there will be three independent phase voltages each delivering a component of power to the load. As we will see, because of the 120° phase shift between these, the total power flowing to the load is now constant.
The overall V(t)I(t) product, includes a component from each phase. We assume that all voltages and currents are expressed as RMS quantities, and so we will henceforth drop this suffix; therefore ![]() . The three‐phase V(t)I(t) product may be written in the form:
. The three‐phase V(t)I(t) product may be written in the form:

This leads to:

The first term in Equation (3.5) is the active power P, comprising an identical component from each phase. It is important to note that in this balanced three‐phase case, P is constant; it does not oscillate about its mean at twice the system frequency, as it does in the single‐phase case.
Important examples of balanced loads are three‐phase induction or synchronous motors. Since the torque produced by these machines is equal to the output power divided by the shaft speed in radians per second, then if the power delivered to the machine is constant, so will be the torque it produces. This is an important advantage over a single‐phase motor, where, as we have seen, both the power and the torque vary sinusoidally about the mean. Therefore we may write:
The remaining VI product terms in Equation (3.5) relate to the reactive power required by the load. From these we can see that there is a reactive current flowing in each phase at twice the system frequency, just as in the single‐phase case. The amplitude of each of these currents is I sin(ϕ), and while collectively they sum to zero, each one constitutes a component of phase current that must be generated and supplied to the load. These reactive currents when multiplied by the phase voltage V, constitute the three‐phase reactive power, given by:
Equations (3.6) and (3.7) have exactly the same form in the three‐phase case as they do in the single‐phase, and therefore in any circuit where the phase angle is non‐zero, reactive power will exist in addition to any active power flow.
When the load is unbalanced, the contributions to both P and Q will be different in each phase, in which case P and Q can be expressed as:

Here |Vi| and |Ii| represent the magnitude of the phase i voltage and current, in volts and amps RMS. This notation is used to distinguish between the magnitude of these quantities and their phasor representations Vi and Ii.
The power triangle concept is still useful in the case of an unbalanced load; however, in this case we must define S according to ![]() . Similarly, the effective phase angle ϕ is also useful in the unbalanced case, and is defined by Equation (3.9), as explained below.
. Similarly, the effective phase angle ϕ is also useful in the unbalanced case, and is defined by Equation (3.9), as explained below.
3.6 Power Factor
As we have seen, active power is generated by the in‐phase component of load current, I cos(ϕ), and therefore cos(ϕ) is an important quantity. When it approaches unity (i.e. ![]() ) the load current is largely associated with the active power flow, since very little reactive power is demanded. In such cases, the network supplying the load is being used most efficiently, and the magnitude of the load current is close to the minimum value required for the active power transferred.
) the load current is largely associated with the active power flow, since very little reactive power is demanded. In such cases, the network supplying the load is being used most efficiently, and the magnitude of the load current is close to the minimum value required for the active power transferred.
On the other hand, when the phase angle is particularly large ![]() much of the supply current is associated with a reactive power flow, and its magnitude is considerably larger than would be required by a purely resistive load consuming the same active power.
much of the supply current is associated with a reactive power flow, and its magnitude is considerably larger than would be required by a purely resistive load consuming the same active power.
We define the circuit’s power factor as the ratio of the active power (P) to the apparent power, (S).

When the circuit voltages and currents are purely sinusoidal (i.e. no harmonics exist), and the currents are balanced, the power factor becomes equal to the cosine of the angle ϕ.

Loads that are not well balanced may have a different angle associated with each phase, and the effective power factor, averaged over a period of time, can be defined in terms of the active and reactive energies summed over all three‐phases, as follows:

In Equation (3.8) both the total VAr‐hours and the total watt‐hours are measured over the same time interval, which may be as short as a metering interval (typically 15 or 30 minutes), or as long as a billing period, which may be between 1 and 3 months. In the former case, Equation (3.8) provides a dynamic measure of a load’s power factor. This parameter is frequently defined in the network connection agreements and, for reasons that will soon become apparent, usually must not fall below a prescribed limit.
We can also use Equation (3.8) to define an effective phase angle in unbalanced three‐phase circuits:
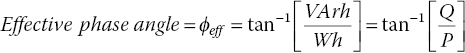
The effective phase angle is the angle between S and P in the power triangle of an unbalanced circuit, where P and Q each represent the summation of the watt and VAr contributions from each phase.
Typical power factors associated with industrial loads lie in a range 0.75 to 1.0. Loads that operate at low power factors (<0.85) impose unreasonable burdens on the power system, since the volt‐amps they demand is large in comparison to the active power delivered, as can be seen from the power triangle in Figure 3.8.
The reactive current consumed by such loads creates additional losses within the distribution network when compared to those of a purely resistive load, and therefore the network’s current capacity must be increased if it is to accommodate heavily reactive loads. By way of illustration, a load with a power factor of 0.5 will generate four times the system losses of one operating at unity power factor for the same power transfer! Supply authorities therefore discourage heavily inductive loads by imposing penalties on customers whose loads have poor power factors. This is often achieved either directly, through a contract limit on the load power factor, or via either a maximum demand charge, (often levied on the maximum kVA consumed)2, or a reactive demand charge. The latter may be levied on the reactive energy consumed, should this exceed a prescribed limit.
3.7 Power Factor Correction
We saw in Chapter 2 that a capacitor, when connected to an AC bus, can generate some or all of the reactive power required by an inductive load. This is the principle of power factor correction (PFC), and it is applied to inductive loads with inherently poor power factors. Capacitors are connected in parallel with an offending load and supply most of the reactive power demanded, leaving a largely flat power triangle, where Q lies close to zero. Therefore the total load has a power factor considerably nearer unity.
The circuit of Figure 3.9 depicts a three‐phase lagging load, in this case one represented by a parallel connected inductance and resistance, to which has been added a power factor correction capacitance. We repeat the analysis presented in Chapter 2, in this case modelling the load with a parallel connected circuit, as shown in the phasor diagram in Figure 3.10.

Figure 3.9 Inductive load with power factor correction.

Figure 3.10 Phasor diagram.
The total current flowing into the combination comprises three components, one flowing in the resistor (generating the active power delivered to the load), one flowing in the inductance (generating the reactive power consumed by the load) and finally the compensation current flowing in the PFC capacitance. Since the bus voltage V is common to all circuit elements it will be used as the reference phasor. The load current lags the applied voltage by an angle ϕload, while the capacitive current leads the voltage by 90°, as shown in Figure 3.10. The total current can be found by vector addition of these phasors. The resultant current Itot can be seen to lag the voltage by a smaller angle ϕ and thus we observe that the power factor has been increased, i.e. it has been improved. As a consequence, we also note that the magnitude of the customer’s load current has been reduced by the inclusion of the power factor correction equipment. This means that the network losses incurred by this customer will be reduced accordingly.
If the capacitor is chosen so that the current it consumes is equal in magnitude to the inductive current IL, then the total current will lie exactly in phase with the bus voltage V, and the resulting PF will equal unity. Should an over‐large capacitor be chosen, then the circuit will be over‐compensated and the total current will lead the bus voltage; the load is then said to have a leading power factor. For reasons that will be explained in the next section, supply authorities generally discourage leading power factors.
3.7.1 Capacitive Voltage Rise
Sometimes it is possible that excess power factor correction may be inadvertently applied, usually as a result of the load falling in the presence of fixed capacitive compensation. Under these conditions, the power factor will become leading and a small rise in the local bus voltage will also occur.
It should be noted that any time a capacitor is connected to a bus the voltage will rise slightly. However, if the entire current delivered by the bus is permitted to become leading, then it is possible that the associated rise may cause the bus voltage to exceed its normal limits. Should this occur on an LV bus, where on‐load tap‐changing facilities are not available, then the network operator has no easy means of correcting the problem. Supply authorities therefore generally discourage leading loads to avoid the danger that over‐voltage poses to all the equipment connected, not only that of the customer concerned but of others as well.
3.7.2 Power Factor Correction Equipment
Large LV customers such as supermarkets, shopping centres and industrial sites frequently install power factor correction (PFC) equipment of the kind pictured in Figure 3.11 to overcome the reactive effects of air conditioning, refrigeration equipment and fluorescent lighting. Usually the capital cost of this equipment and its installation, can be repaid within a short time from savings in the maximum demand charge levied by the retailer or the network owner.


Figure 3.11 (a) PFC control relay (b) Low voltage PFC cabinet.
Low voltage PFC installations generally consist of delta connected capacitors, since the reactive energy provided is proportional to the square of the applied voltage and there is no difficulty or excessive cost in building LV capacitors capable of supporting voltages up to 500 VRMS. On the other hand, voltage support capacitors used in MV and HV networks are generally wye (star) connected, since these usually have a limited withstand voltage capability, and therefore a phase potential is more convenient. In both cases, however, each capacitor is connected in series with a de‐tuning inductance, to ensure that there is no adverse harmonic resonance created between the capacitors themselves and the local network’s inductive source impedance.
Power factor correction equipment often contains two or more sets of capacitors which can be switched onto the local bus incrementally so that capacitive VArs can be progressively added, so as to offset any increase in the inductive VAr demand. The capacitor switching is controlled by a reactive power control relay, like the one shown in Figure 3.11a. This device assumes a balanced load, and monitors the line current and voltage on one phase, via a dedicated current transformer, and computes the power factor of the load concerned. As the reactive demand increases, the controller switches in more capacitive compensation, thereby maintaining a nearly constant power factor. Figure 3.11b shows a PFC cabinet containing five identical stages. Sometimes ‘n’ capacitive stages are provided and arranged in a binary sequence, so that 2n increments can be generated thereby enabling the inductive demand of the load to be accurately compensated.
Capacitors are switched either with metallic contacts, or where bus disturbances must be avoided, with the use of thyristors, which can be fired at voltage zero crossings, thereby minimising the disturbing effects of capacitive inrush currents.
The effectiveness of PFC can be seen in Figure 3.12, where the load profile of an LV load is shown; the lower traces represent the active power and the kVA demanded. The consumption cycles on a daily basis, and on one Monday afternoon a new power factor correction panel is switched into service for the first time, as evidenced by a jump in the load power factor, (top trace). Simultaneously the VA demand falls to a value just a little above the active power consumed. As a result the power triangle of Figure 3.8 has now become quite flat, since the reactive power Q supplied by the bus, is now approximately zero. Consequently, cos(ϕ) rises to about 0.97 from its previous value of around 0.78.

Figure 3.12 LV customer load profile and power factor.
3.7.3 Sizing of Power Factor Equipment
It is generally unnecessary to fully correct the reactive demand to zero when applying power factor correction. There are two reasons for this. Firstly, it makes the possibility of a leading power factor more likely, and secondly there is a diminishing return between with money spent on PFC equipment and achieving a particularly high power factor.
We can demonstrate this effect using the following analysis. We begin by expressing the PF in terms of the load’s active and reactive power:

With power factor correction applied, the reactive load remaining Q can be written:
where QL is the maximum value of the load’s reactive demand, and QC is the maximum value of the capacitive correction to be applied. Thus we can write:

Here we write ![]() , where k is the fraction of the load’s reactive demand to be corrected. Thus if k = 1 then the load will be fully corrected and the final PF will equal unity; if k = 0 then there will be no improvement in the load’s PF.
, where k is the fraction of the load’s reactive demand to be corrected. Thus if k = 1 then the load will be fully corrected and the final PF will equal unity; if k = 0 then there will be no improvement in the load’s PF.
If we plot the corrected PF as a function of k we obtain the set of curves shown in Figure 3.13, where we see that as the initial (uncorrected) PF becomes worse, (i.e. lower) we need to correct a progressively larger percentage of the reactive demand in order to achieve an acceptable final PF. Note that all these curves flatten as k tends towards 100%, suggesting that in order to achieve very high power final factors, a disproportionately high degree of PF correction will be required.

Figure 3.13 Final PF versus the percentage of the original reactive load corrected.
For example, if the load’s initial PF is 0.6 and we aim for a final power factor of 0.95, then from Figure 3.13, we will require a capacitive correction equal to about 75% of the load’s maximum reactive demand. However, if we were to aim for a final PF of unity, 100% correction will be required. Thus the required PFC capacity must be increased by 25% in order to raise the PF from 0.95 to unity. This is both expensive and unnecessary; a power factor of 0.93 or 0.95 is generally quite sufficient to provide the customer with substantial saving in demand charges, while satisfying the requirements of most supply contracts.
The step size of the capacitive compensation to be provided is also worth mentioning. If the PFC manufacturer offers a choice in this, it is wise to choose a step size a little smaller than the load’s minimum reactive demand so that at minimum load the capacitive correction can still be applied. However, this choice is not critical and will not affect the MD charges levied. In LV applications the increment size usually lies in the range 25–50 kVAr, and most controllers will not allow the final PF to become leading.
3.8 Typical Industrial Load Profiles
3.8.1 Small Industrial Loads
An actual load profile of a small food processing plant, supplied from a 22 kV distribution feeder under a kVA based maximum demand (MD) tariff, appears in Figure 3.14. The load profile reveals several interesting things about the business. Firstly, it obviously only operates during normal working hours, as evidenced by the cyclic daily demand. During the evenings and at weekends the site load falls to a low level, probably due to background refrigeration and water heating loads.

Figure 3.14 Small low voltage industrial customer’s load profile.
Secondly, both the active and reactive power demands occur in approximately the same ratio. This means that the site’s power factor lies in a relatively restricted range, in this case from about 0.65 to 0.8, with PF values at the peak of the site’s demand close to 0.78. This suggests that the management probably does not understand the concept of a kVA based maximum demand tariff, otherwise power factor correction equipment might have been installed and a considerably lower demand charge would have been achieved.
Under this particular kVA maximum demand tariff, the customer pays the network owner an amount based on the maximum kVA demand measured in any metering interval (usually 15 or 30 minutes), during the previous calendar year. This is to cover the cost of the network and the connection assets provided on the customer’s behalf. In this way, the network owner achieves a return on the assets provided for this particular customer. By basing the MD tariff on the maximum kVA consumed by the load, rather than the maximum kW demand, the network owner is subtly enticing customers to operate their equipment at as high a power factor as economically feasible.
Unfortunately, relatively few small industrial customers understand the concepts of power factor and kVA demand, and even fewer know what steps to take in order to minimise their maximum demand charges, which can amount to more than half of their total electrical expenditure. Further, some electricity retailers are not forthcoming with the information necessary for customers to make informed decisions, as it is seldom in their interest to do so.
For example, in the case of this particular business if we assume that its maximum demand for the year was 250 kVA (as suggested in Figure 3.14) then it would pay an MD charge based on this, despite the fact that the peak power demand on most days is only about 130–140 kW. Effectively the business is hiring assets capable of delivering 250 kVA, when its daily maximum is much less that this. This does not represent good value for the customer.
There are two areas in which the demand charge can usually be reduced without impinging on production. Firstly, where this charge relates to the kVA demand (rather than the kW demand), installing power factor correction equipment will see the site’s demand fall to a level very close to its kW demand, thereby potentially achieving a considerable saving in maximum demand charges. In the case of this business, the application of power factor correction will result in a reduction in MD from 250 kVA to around 170 kVA.
Secondly, by installing a dynamic load controller and flattening the load profile, the business can reduce its MD charges even further. A dynamic load controller automatically reduces those sacrificial components of a load (such as water heating, air‐conditioning and possibly some refrigeration), as the critical process load increases, and restores them as the critical loads diminish, thereby flattening the load profile and reducing the site’s MD, without significantly reducing production. In the example above, on most days the business’s maximum power demand is less than 140 kW, but occasionally it rises to around 170 kW. If this business can operate with an MD of 140 kW during most weeks, then it should be possible to manage its load so that this occurs every week. This is the function of a dynamic load controller, and by installing one a further MD charge saving may well be possible.
3.8.2 Large Industrial Loads
Large industries such as aluminium, zinc and nickel refineries, as well as paper and automotive manufacturers, all operate continuously and consume very large quantities of electricity. They form part of a power system’s base load and are usually connected directly to the transmission network and are therefore supplied at either HV or EHV potentials. They also generally have very specific connection agreements with the transmission company, including agreed maximum demand limits on the active and reactive power that they can consume. These figures are instrumental in determining the VA capacity of the connection assets that must be provided by the transmission company, and it is therefore important that this capacity should not be exceeded, lest this equipment becomes overloaded. As a deterrent, the connection agreement usually includes steep financial penalties if either of these limits is violated.
Large industries like these adopt an entirely different approach to their electricity management: they have access to significant engineering expertise and well understand the supply contract requirements. Electrical demand is usually tightly controlled, and unless site requirements prevent it, the load imposed on the network usually lies just below the agreed maximum demand. In this way, the money spent on MD charges is best utilised.
The load profile shown in Figure 3.15 is typical of a large industrial plant operating continuously, in this case one with a 100 MVA maximum demand. The plant’s MVA demand is generally carefully managed so that for most of the time it lies just below the contract MD. It may occasionally fall for process reasons, but it will be restored as quickly as possible in order to maintain production. The power factor of such loads tends to remain largely constant and close to unity, in this case 0.95.

Figure 3.15 Typical large industrial load profile.
In the case of customers like these the concept of a load factor is useful and is frequently measured. It is a way of quantifying the ‘peakiness’ of a customer’s load, or alternatively it may be considered a measure of the degree to which a plant is operated at full capacity. It is defined as follows:

Thus if a load profile is constant throughout the billing period, and equal to the contract MD then the load factor will equal 1.0. This is the ideal situation but it rarely occurs in practice. On the other hand, if the load profile varies considerably below the contract MD then the load factor will be much less than one, and the customer would potentially be paying the network provider for supply capacity that isn’t being used effectively. Looked at from another perspective, since the MD is usually chosen to be equal to or just a little above a plant’s electrical rating, operating at load factors significantly below unity means that the site is not operating at its full capacity. Most large industrial customers therefore strive to achieve a load factor as close to unity as possible.
In addition to MD limits, connection agreements often specify other parameters which define the quality of the connected load, such as its harmonic content and the permitted unbalance between phase currents.
3.9 Directional Power Flows
The directions in which P and Q flow are controlled by the phase angle between the voltage and current, ϕ. We know that for a balanced three‐phase load ![]() and
and ![]() , therefore the sign of these quantities determines their direction. The direction of the active power flow changes sign with cos(ϕ), while that of the reactive power flow changes with sin(ϕ).
, therefore the sign of these quantities determines their direction. The direction of the active power flow changes sign with cos(ϕ), while that of the reactive power flow changes with sin(ϕ).
As discussed previously, most customer load involves lagging phase currents, and therefore if we take the A phase voltage as a reference phasor, the A phase current will lie in the fourth quadrant, as shown in Figure 3.16. Currents in the fourth quadrant correspond to loads which import both active and reactive power from the bus. If we consider the power flow from the perspective of the load, then we can define both these quantities as positive in this quadrant.
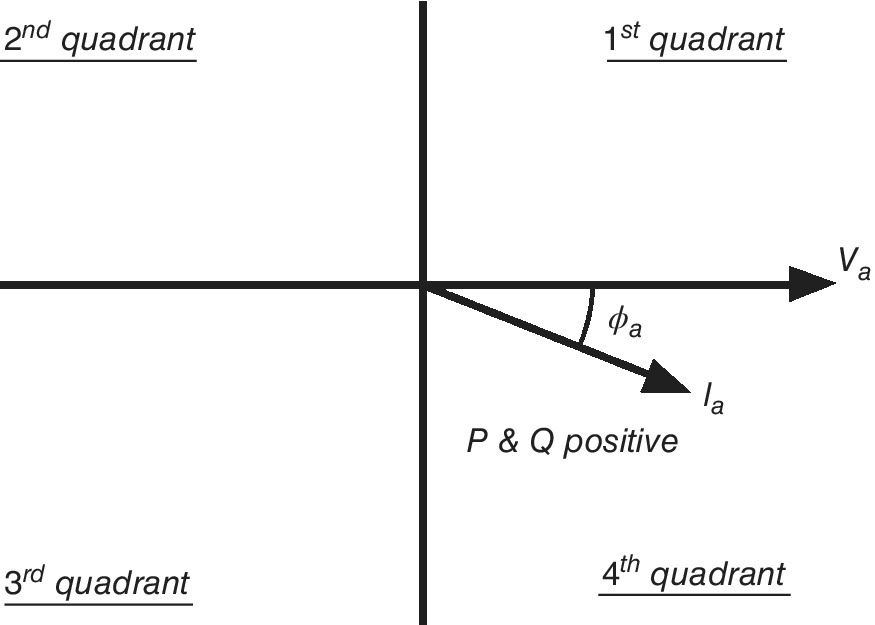
Figure 3.16 Power flows in the 4th quadrant are defined as positive.
We considered the case where excessive capacitive compensation results in a leading current, which lies in the first quadrant. In this situation, the load is exporting reactive power to the bus, and we define this VAr flow as negative; however, the active power flow remains unchanged. Therefore reactive power is considered positive when ϕ lies between 0 and −180°, i.e. in quadrants 3 and 4 and negative when ϕ lies between 0 and +180°, i.e. in quadrants 1 and 2.
Similarly, we find that the active power flow is positive when ϕ lies between −90 and +90°, i.e. in quadrants 1 and 4, where the load imports power from the bus. It is negative in quadrants 2 and 3 when ϕ is greater than +90 and less than −90°, where the load exports active power to the bus. It should be noted that in order to export power, the load must have some generating capacity. These power flow directions are summarised in Figure 3.17, where it is evident that it is quite possible to have active and reactive power flows occurring simultaneously in opposite directions.

Figure 3.17 Power flow definitions from the perspective of the load.
The terms import and export used above relate the perspective of the load. Sometimes the power flow directions are described from the perspective of the bus, and then the terms import and export take reciprocal meanings. It is therefore important to clearly understand the context in which these terms are used.
3.10 Energy Retailing
In this section we will consider some of the different charges that commercial and industrial electricity users must pay for their electricity. From an engineering point of view we will not consider residential customers, although they do generally have much simpler bundled price structures than do commercial customers.
There are many different charging schemes in use throughout the world, each slightly different, often depending on regional requirements. The following discussion should therefore be seen only as a general approach to electricity pricing, and the charges outlined here may not necessarily be indicative of all countries.
3.10.1 Energy Charges
All commercial and industrial customers will pay for the energy they use. This will be recorded in kWh for each metering interval throughout the billing period. The energy meter will aggregate the energy metered in each interval throughout the billing period, providing the energy retailer with the total number of kWh used by the customer. Energy may be charged at a flat rate, or its price may vary with the time of use. Time of use tariffs seek to modify customer behaviour by moving consumption away from peak periods (where energy is expensive), to off peak periods where it is considerably cheaper.
The energy meter usually also records the reactive energy demand of commercial and industrial customers, in kVArh. This is generally to ensure that the customer is satisfying any reactive demand requirements of their contract. There is usually no requirement to pay for the reactive energy provided, although some jurisdictions do impose financial penalties if the customer’s power factor becomes too small.
3.10.2 Transmission and Distribution Loss Factors
Both the transmission and distribution networks incur losses as a result of the transmission of energy. These losses must be paid for, since they consume a small portion of the energy that has been dispatched by generators into the power system. Electricity market operators usually prepare distribution and transmission loss factors (DLFs and TLFs) for each region and for each potential in their electricity network. These loss factors are applied to the energy measured by each customer’s energy meter, inflating the kWh count typically by between 5 and 15%. Thus each customer pays not only for the energy seen by their electricity meter, but also for the associated losses incurred in the transmission and distribution networks on their behalf as well.
The magnitude of these loss factors depends upon where a particular customer is located in the network, and the potential at the connection point. For example, a customer residing a considerable distance from generation assets will have a higher transmission loss factor than those situated close by. Similarly, customers connected to the distribution network at say 22 kV will generally have a smaller distribution loss factor than those connected at 230/400 volts, simply because they use less of the network.
3.10.3 Network Charges
Network charges are levied on all customers to cover the network cost of transporting the energy from the electricity generators. Residential customers will generally have these costs bundled together with the energy cost into a single kWh charge. For commercial and industrial customers network charges can amount to more than half the total electricity expenditure. In the case of smaller businesses, these charges are often not well understood, and neither are the steps that can be taken in order to reduce them.
Network charges generally contain three components:
- A daily charge, sometimes called an access charge or a standing charge. This component usually represents a minor component of the total network charge.
- An energy component; this is a charge per kWh levied for the customer’s for use of the network, and as such it is in direct proportion to the customer’s load. Sometimes this component is split into separate transmission and distribution components, but both are aggregated as part of the network charge, and collectively relate to the energy provided to the customer. This energy component can also sometimes depend upon the time of use (ToU), rising during times of peak demand.
- A maximum demand component; this relates to the maximum demand (MD), that a customer imposes on the network. The maximum demand is defined as the maximum power (either P or S) consumed during any metering interval in the billing period. The maximum demand charge relates to the size of the connection assets that must be provided by the local network owner, in order to safely deliver energy to the customer.
3.11 Problems
- Power Factor Correction
A small industrial electricity site has a typical daily consumption profile shown in Figure 3.18. The owner is keen to reduce the local network supply charge by reducing the maximum demand. The site’s highest daily demand over the billing interval is shown in Figures 3.18 and 3.19.

Figure 3.18 Highest daily consumption profile.

Figure 3.19 Highest weekly consumption profile.
- What options are available to the owner?
- Estimate the maximum capacity of the power factor correction equipment required to increase the worst case power factor to 0.95.
(Answer: ≈100 kVAr)
- If the owner pays $0.5 per kVA per day in maximum demand charges, and the PFC equipment can be installed for $12,000, what will be the payback period on the purchase of this asset?
(Answer: ≈ 1.5 years.)
- Estimate the current weekday load factor. How would this change following the improvement in power factor?
(Answer: ≈ 50% in each case.)
- In what other ways might the MD charge be further reduced? What additional annual savings might be possible?
(Answer: ≈ $10,000 per year)
- A small industrial three‐phase 60 Hz load is supplied from a transformer with an inductive impedance of 0.1 ohms. At full load it consumes 400 kVA with a power factor of 0.75 and sees a phase voltage of 375 V.
- Calculate the open circuit winding voltage assuming that the source impedance on the MV side of the transformer is negligible.
(Answer: 398 Vphase or 690 Vline)
- Find the size of the power factor capacitance required in parallel with each phase to restore the full load power factor to 0.95. Assume that the load impedance is invariant with voltage changes.
(Answer: 1260 μF)
- Calculate the full load voltage seen at the load in the presence of this capacitance.
(Answer: 389 V)
- If at low load the load admittance falls to 20% of its full load value, while maintaining a 0.75 power factor, calculate the phase voltage in the presence of this fixed PFC capacitance.
(Answer: 409 V)
- Calculate the open circuit winding voltage assuming that the source impedance on the MV side of the transformer is negligible.
- An unbalanced three‐phase load exhibits the phasor diagram shown in Figure 3.20.

Figure 3.20 Unbalanced three‐phase load.
- Calculate the load’s effective power factor. Compare your result with that obtained from the average of the three‐phase angles.
(Answer: 0.985, 0.802)
- Demonstrate that when the phase currents all have the same magnitude, the effective phase angle for the total load equals the average of the individual phase angles, despite the remaining phase unbalance.
- Calculate the load’s effective power factor. Compare your result with that obtained from the average of the three‐phase angles.
- Estimate the load factor for the load profiles in Figures 3.14 and 3.15.
- Use Figure 3.13 to estimate the size of the PFC unit required in Figure 3.13.
(Answer: Approximately 120kVAr)