
Chapter 5
Building Reliable MapReduce Apps
WHAT’S IN THIS CHAPTER?
- Unit testing of MapReduce applications using MRUnit
- Local testing of MapReduce applications
- Understanding MapReduce support for debugging
- Utilizing defensive MapReduce programming
WROX.COM CODE DOWNLOADS FOR THIS CHAPTER
The wrox.com code downloads for this chapter are found at www.wiley.com/go/prohadoopsolutions on the Download Code tab. The code is in the Chapter 5 download and individually named according to the names throughout the chapter.
By now, you should be familiar with MapReduce architecture, application design, and customizing MapReduce execution. This chapter discusses how to build reliable MapReduce code by leveraging unit testing and Hadoop-provided facilities for testing applications. You also learn about different approaches to defensive programming that allow your code to cope with partially corrupted data.
UNIT TESTING MAPREDUCE APPLICATIONS
Bugs in code are a fact of life — the more code you write, the more bugs you create. Even the greatest programmers rarely write bug-free code. That’s why code testing is becoming an integral part of code development, and programmers are moving more and more toward test-driven development (TDD).
One of the cornerstones of TDD is unit testing. Although by using enough mock classes, it is technically possible to test the majority of MapReduce implementations using the JUnit framework, there is an alternative approach that can offer an additional level of coverage. MRUnit is a unit testing framework designed specifically for Hadoop. It began as an open source offering included in Cloudera’s distribution for Hadoop, and is now an Apache Incubator project. MRUnit is based on JUnit, and allows for the unit testing of mappers, reducers, and some limited integration testing of the mapper-reducer interaction, along with combiners, custom counters, and partitioners.
As explained in Chapter 3, Eclipse provides a very good development platform for MapReduce applications. During that discussion, you learned how to create a pom.xml file containing all of the dependences required for MapReduce applications. Eclipse also provides a good platform for MRUnit-based unit testing.
To use MRUnit, you must extend the standard MapReduce Maven pom file presented in Chapter 3 by adding MRUnit dependency, as shown in Listing 5-1.
LISTING 5-1: MRUnit dependency for Maven pom file
<project xmlns="http://maven.apache.org/POM/4.0.0"
          xmlns:xsi="http://www.w3.org/2001/XMLSchema-instance"
     xsi:schemaLocation="http://maven.apache.org/POM/4.0.0
          http://maven.apache.org/xsd/maven-4.0.0.xsd">
     <modelVersion>4.0.0</modelVersion>
     <groupId>com.nokia.lib</groupId>
     <artifactId>nokia-cgnr-sparse</artifactId>
     <version>0.0.1-SNAPSHOT</version>
     <name>cgnr-sparse</name>
     <properties>
          <hadoop.version>2.0.0-mr1-cdh4.1.0</hadoop.version>
          <hadoop.common.version>2.0.0-cdh4.1.0</hadoop.common.version>
          <hbase.version>0.92.1-cdh4.1.0</hbase.version>
     </properties>
     <repositories>
          <repository>
               <id>CDH Releases and RCs Repositories</id>
               <url>https://repository.cloudera.com/content/groups/cdh-
                    releases-rcs</url>
          </repository>
     </repositories>
     <build>
          <plugins>
               <plugin>
                    <groupId>org.apache.maven.plugins</groupId>
                    <artifactId>maven-compiler-plugin</artifactId>
                    <version>2.3.2</version>
                    <configuration>
                         <source>1.6</source>
                         <target>1.6</target>
                    </configuration>
               </plugin>
          </plugins>
     </build>
     <dependencies>
          <dependency>
               <groupId>org.apache.hadoop</groupId>
               <artifactId>hadoop-core</artifactId>
               <version>${hadoop.version}</version>
               <scope>provided</scope>
          </dependency>
          <dependency>
               <groupId>org.apache.hbase</groupId>
               <artifactId>hbase</artifactId>
               <version>${hbase.version}</version>
               <scope>provided</scope>
          </dependency>
          <dependency>
               <groupId>org.apache.hadoop</groupId>
               <artifactId>hadoop-common</artifactId>
               <version>${hadoop.common.version}</version>
               <scope>provided</scope>
          </dependency>
          <dependency>
               <groupId>junit</groupId>
               <artifactId>junit</artifactId>
               <version>4.10</version>
          </dependency>
        <dependency>
            <groupId>org.apache.mrunit</groupId>
            <artifactId>mrunit</artifactId>
            <version>0.9.0-incubating</version>
            <classifier>hadoop2</classifier>
          </dependency>
     </dependencies>
</project>With this in place, you can implement unit tests for main elements of MapReduce applications. The word count example from Chapter 3 is used for testing examples here. This means that the mapper and reducer from this example are passed as parameters for testing.
Testing Mappers
The use of MRUnit for testing mappers is very straightforward, and is best explained by looking at the actual code shown in Listing 5-2.
LISTING 5-2: Testing Mapper
     @Test
     public void testMapper() throws Exception{
          new MapDriver<LongWritable, Text, Text, IntWritable>()
               .withMapper(new WordCount.Map())
               .withConfiguration(new Configuration())
               .withInput(new LongWritable(1), new Text("cat cat dog"))
               .withOutput(new Text("cat"), new IntWritable(1))
               .withOutput(new Text("cat"), new IntWritable(1))
               .withOutput(new Text("dog"), new IntWritable(1))
               .runTest();
}Writing an MRUnit-based unit test for the mapper is quite simple. This simplicity is significantly enhanced by the fluent API style. To write your test, you would do the following:
The limitation of the MapDriver class is that you end up with a single input and output per test. You can call withInput and withOutput multiple times if you want, but the MapDriver implementation will overwrite the existing values with the new ones, so you will only ever be testing with one input/output at any time. To specify multiple inputs, you must use the MapReduceDriver object (covered later in this chapter).
Testing Reducers
Testing the reducer follows the same pattern as the mapper test. Again, look at a code example shown in Listing 5-3.
LISTING 5-3: Testing the reducer
    @Test
    public void testReducer() throws Exception {
        List<IntWritable> values = new ArrayList<IntWritable>();
        values.add(new IntWritable(1));
        values.add(new IntWritable(1));
        new ReduceDriver<Text, IntWritable, Text, IntWritable>()
             .withReducer(new WordCount.Reduce())
             .withConfiguration(new Configuration())
             .withInput(new Text("cat"), values)
             .withOutput(new Text("cat"), new IntWritable(2))
             .runTest();
    }
Following is a breakdown of what is happening in this code:
The ReducerDriver has the same limitation as the MapperDriver of not accepting more than one input/output pair.
So far, this chapter has shown you how to test the mapper and reducer in isolation, but it may also be necessary to test them together in an integration test. You can do this by using the MapReduceDriver class. The MapReduceDriver class is also the class to use for testing the use of combiners.
Integration Testing
MRUnit provides the MapReduceDriver class that enables you to test how a mapper and reducer are working together. The MapReduceDriver class is parameterized differently than MapperDriver and ReducerDriver.
First, you parameterize the input and output types of the mapper, and the input and output types of the reducer. Because the mapper output types always match the reducer input types, you end up with three pairs of parameterized types. Additionally, you can provide multiple inputs and specify multiple expected outputs. Listing 5-4 shows some sample code.
LISTING 5-4: Testing mapper and reducer together
    @Test
    public void testMapReduce() throws Exception {
        new MapReduceDriver<LongWritable, Text, Text, IntWritable, Text,
               IntWritable>()
             .withMapper(new WordCount.Map())
             .withReducer(new WordCount.Reduce())
              .withConfiguration(new Configuration())
              .withInput(new LongWritable(1), new Text("dog cat dog"))
              .withInput(new LongWritable(2), new Text("cat mouse"))
             .withOutput(new Text("cat"), new IntWritable(2))
             .withOutput(new Text("dog"), new IntWritable(2))
             .withOutput(new Text("mouse"), new IntWritable(1))
             .runTest();
       }
As you can see from this code, the setup is similar to the one used by MapDriver/ReduceDriver classes. You pass in instances of the mapper and reducer. (The mapper and reducer from the word count example described in Chapter 3 are used here.) Optionally, you can use withConfiguration and withCombiner to test configuration and a combiner if required.
The MapReduceDriver class enables you to pass in multiple inputs that have different keys. Here, you are passing in two records — first with a LongWritable with an arbitrary value and a Text object that contains a line "dog cat dog", and second with a LongWritable with an arbitrary value and a Text object that contains the line "cat mouse".
You also specify the expected output from a reducer using the withOutput method. Here, you specify three keys — "cat", "dog", and "mouse" — with the corresponding counters of 2, 2, and 1. Finally, if mapper/reducer is incrementing a counter, an optional .withCounter(group, name, expectedValue) (not shown in Listing 5-4) enables you to specify the expected value of the counter.
If a test fails, the output of MRUnit produces an output similar to Listing 5-5 that explicitly tells what the error is.
LISTING 5-5: Result of unsuccessful MRUnit execution
13/01/05 09:56:30 ERROR mrunit.TestDriver: Missing expected output (mouse, 2)
     at position 2.
13/01/05 09:56:30 ERROR mrunit.TestDriver: Received unexpected output (mouse,
     1) at position 2.
If the test is successful, you gain a little more confidence that the mapper and reducer are correctly working together.
Although MRUnit makes unit testing easy for mapper and reducer code, the mapper and reducer examples presented here are fairly simple. If your map and/or reduce code starts to become more complex, it is a good design practice to decouple business (that is, application-specific) processing from the Hadoop framework support, and test business logic on its own. Also, as useful as the MapReduceDriver class is for integration testing, it’s very easy to get to a point where you are no longer testing your code, but rather the Hadoop framework itself, which has already been done.
The unit testing described here typically does a fairly good job of detecting bugs early, but these tests will not really test your complete MapReduce jobs with Hadoop. The local job runner, described in the next section, enables you to run Hadoop on a local machine, in one JVM, making MapReduce jobs a little easier to debug if a job fails.
LOCAL APPLICATION TESTING WITH ECLIPSE
Using Eclipse for Hadoop development provides the capability to run the complete MapReduce application locally — in a “single instance” mode. The Hadoop distribution (Hadoop-core) comes with the local job runner that lets you run Hadoop on a local machine, in a single JVM. In this case, you can set breakpoints inside the map or reduce methods, using the Eclipse debugger, and “step through” the code to examine programming errors.
Running MapReduce in a local mode in Eclipse does not require any special configuration or setup. Just right-click the main class and choose Run As (or Debug As) ⇒ Java Application, as shown in Figure 5-1.
FIGURE 5-1: Running MapReduce applications locally from Eclipse
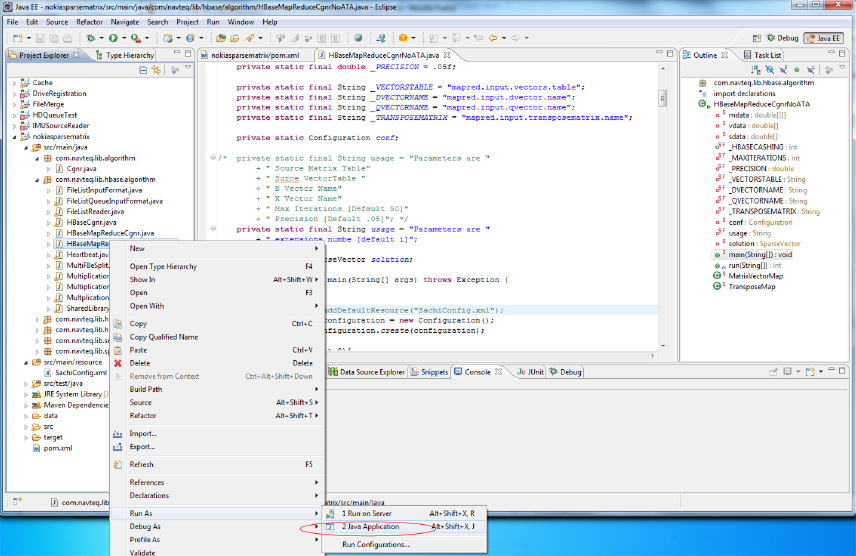
An Eclipse-based “local” execution works on both Linux and Windows. (If you run MapReduce on Windows, you must install Cygwin.) By default, a local job runner uses the local filesystem to read/write data.
Keep in mind that, by default, local Hadoop execution uses the local filesystem. (As described in Chapter 2, HDFS implementation provides support for local data system.) This means that all the data necessary for job testing must be copied locally, and execution results are produced locally.
If this is not an option, you can configure a local job runner to operate on a cluster’s data (including HBase). To access an Hadoop cluster during local execution, you must use a configuration file, such as the one shown in Listing 5-6.
LISTING 5-6: Hadoop configuration for accessing cluster data
<?xml version="1.0" encoding="UTF-8"?>
<configuration>
     <!-- hbase access -->
     <property>
          <name>hbase.zookeeper.quorum</name>
          <value>Comma separated list of zookeeper nodes</value>
     </property>
     <property>
          <name>hbase.zookeeper.property.clientPort</name>
          <value>zookeeper port</value>
     </property>
     <!-- hdfs -->
     <property>
          <name>fs.default.name</name>
          <value>hdfs://<url>/</value>
     </property>
     <!-- impersonation -->
     <property>
          <name>hadoop.job.ugi</name>
          <value>hadoop, hadoop</value>
     </property>
</configuration>
This configuration defines three major components — HBase access (defined by referring to the Zookeeper quorum), HDFS access (defined by an HDFS URL), and security impersonation (this is required if your development machine and Hadoop cluster belong to different security domains, or you are using different login names on your local machine and Hadoop cluster). Adding this configuration to the execution is fairly straightforward, as shown in Listing 5-7.
LISTING 5-7: Adding cluster information to configuration
Configuration.addDefaultResource("Hadoop properiies");
Configuration conf = new Configuration();
Although using the local job runner provides much more thorough testing compared to the unit testing, one important thing that you must remember when testing Hadoop applications is that size matters. No matter how many times you run an Hadoop job using a local runner, until the code is tested on the realistic data sample, you can never be sure that it will work correctly.
In fact, a lot of things cannot be verified without testing at scale, including the following:
- How many mappers are going to be created during an application run, and how well is data going to be split between them?
- What is a realistic timing for shuffle and sort? Is it necessary to implement a combiner? Will an in-memory combiner be a better option?
- What kind of hardware/software/network load does an application create? Is it necessary to do additional application/cluster parameter tuning?
This means that to ensure that the application is working correctly, testing with the local job runner must be followed by testing on the real Hadoop cluster with realistic data.
The highly distributed nature of MapReduce execution and its dependency on a huge amount of data makes debugging MapReduce code a challenging job. In the next section, you learn how to use Hadoop’s logging to enhance the debugging of Hadoop execution.
USING LOGGING FOR HADOOP TESTING
Logging is widely used in a majority of software projects, and serves many important purposes, including the following:
- Creation of an execution audit trail that can be used, for example, for execution analysis, or to identify potential improvements
- Collection of execution metrics that can be used for both real-time and postmortem analysis and test automation, error identification, and so on
MapReduce itself keeps logs of all important events during program execution. The location of these files is controlled by Hadoop configuration files. By default, they are stored in the logs subdirectory of the Hadoop version directory. The most important logs for debugging individual applications are the TaskTracker logs. Any exceptions thrown by a MapReduce job are recorded in those logs.
The log directory also has a subdirectory called userlogs, which contains a separate subdirectory for every task run. Each task records its stdout and stderr information to two files in this directory. Any application-specific logging information included in the user’s code is stored in these files. On a multi-node Hadoop cluster, these logs are not centrally aggregated — you must check each task node’s logs/userlogs/ directory for their content.
A convenient way of viewing all the logs related to the same task together is by using a JobTracker’s web pages, as shown in Figure 5-2. This enables you to display logs for all mappers and reducers produced by this job.
FIGURE 5-2: Job page
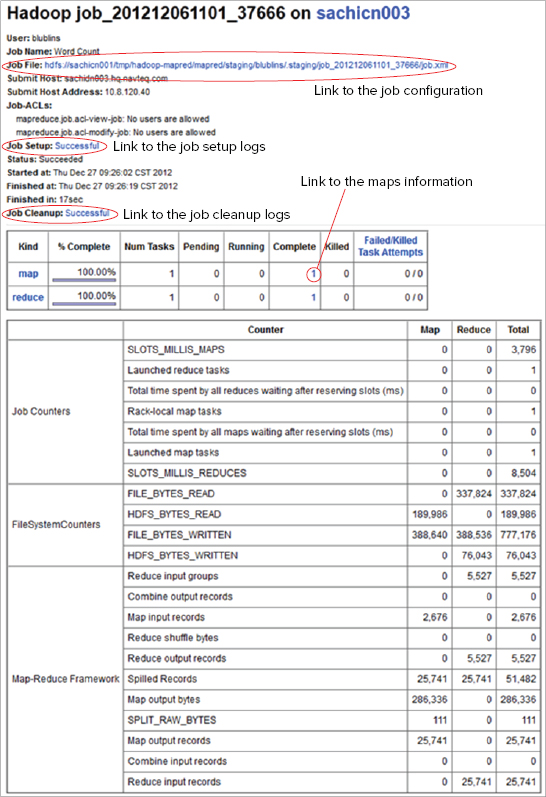
All of the job’s logging information can be accessed from the TaskTracker’s job page (job setup and cleanup logs, as well as mappers’ and reducers’ pages linked to the corresponding log pages). From this page you can navigate to a job configuration page, as shown in Figure 5-3.
FIGURE 5-3: Job configuration page
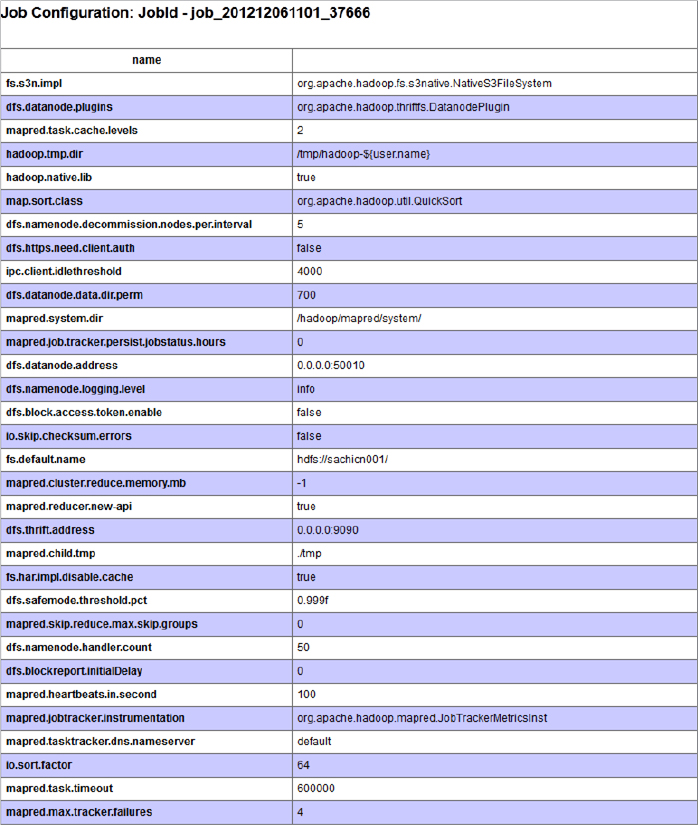
The job configuration page contains the content of a configuration object. It is especially important for you to examine this page if you are using a lot of custom configuration (for example, when you pass parameters from your driver to mappers and reducers). This page enables you to confirm that they have the desired values.
Additionally, job setup and cleanup logs, as well as mappers’ and reducers’ pages, are linked to the corresponding log pages. As shown in Figure 5-4, log pages contain stdout, stderr, and syslog logs.
FIGURE 5-4: Map’s log
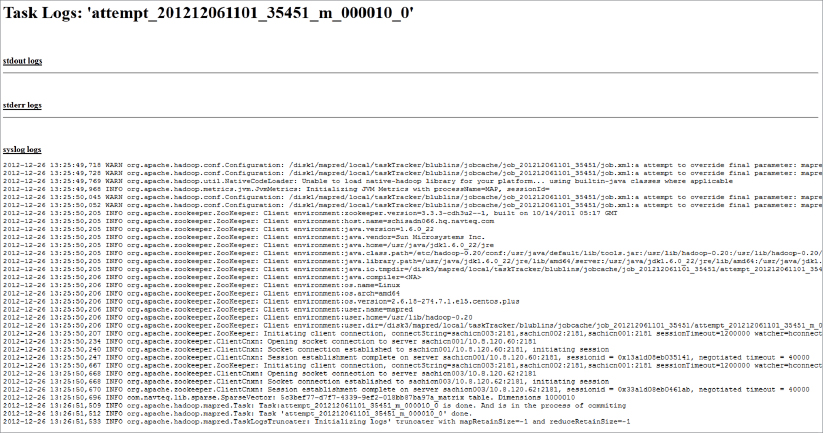
Any application-specific logging should be present in these logs. Because this page can be refreshed in real time, it can be effectively used for watching the progress of an individual execution (assuming that your application is logging appropriate information).
Log processing can be made even more powerful by using a MapReduce framework facility to run user-provided scripts for debugging. These user-defined scripts process output logs to distill information that is most important for an understanding of the problem at hand. The script is allowed to mine data from a task’s outputs (stdout and stderr), syslog, and jobconf. The outputs from the debug script’s stdout and stderr are available through the job user interface.
You can provide separate scripts for map and reduce task failure. You submit the debug scripts by setting values for the properties mapred.map.task.debug.script (for debugging map tasks) and mapred.reduce.task.debug.script (for debugging reduce tasks). You can also set these properties by using APIs. The arguments to the script are the task’s stdout, stderr, syslog, and jobconf files.
When deciding what exactly to log in your MapReduce job, make your decisions in a well-targeted fashion. Here are some recommendations for designing useful logging:
- Exception/error handling code should always log exception information.
- Any unexpected variable’s values (for example, nulls) should be logged during execution.
- Detection of unexpected execution paths should be logged.
- If execution performance is of a concern, execution timing of the main code blocks should be logged.
- Logging too much makes logging useless. It makes it impossible to find relevant information within a log.
Although the use of a JobTracker can be a convenient option for viewing logs for a specific job, it is not suited for automatic log processing and mining. The following section looks at some of the approaches for automated log processing.
Processing Applications Logs
You can use a wide range of solutions for logging, starting from specialized software (for example, the Splunk App for HadoopOps) and up to a custom log-processing application. To implement custom log processing, all of the log data from all mappers and reducers must be brought together in a single file. You can achieve this by using a simple screen scraper as shown in Listing 5-8 (code file:class HadoopJobLogScraper), which enables you to bring together all of the logs related to a particular job, and store them in a single file for subsequent processing.
LISTING 5-8: Simple log screen scraper
public class HadoopJobLogScraper{
     private String _trackerURL = null;
     public static void main(String[] args) throws IOException{
          if (args.length != 2){
               System.err.println("usage: <JobTracker URL>, <job id>");
          }
          String jobId = args[1];
          String trackerURL = args[0];

          HadoopJobLogScraper scraper = new HadoopJobLogScraper(trackerURL);
          scraper.scrape(jobId, JobType.MAP);
          scraper.scrape(jobId, JobType.REDUCE);
          System.out.println("done");
     }

     public enum JobType{
          MAP("map"), REDUCE("reduce");
          private String urlName;
          private JobType(String urlName){
               this.urlName = urlName;
          }

          public String getUrlName(){
               return urlName;
          }
     }

     private Pattern taskDetailsUrlPattern = Pattern.compile("<a
          href="(taskdetails.jsp.*?)">(.*?)</a>");
     private Pattern logUrlPattern = Pattern.compile("<a
          href="([^"]*)">All</a>");

     public HadoopJobLogScraper (String trackerURL){
          _trackerURL = trackerURL;
     }

     public void scrape(String jobId, JobType type) throws IOException{
          System.out.println("scraping " + jobId + " - " + type);

String jobTasksUrl = _trackerURL  + "/jobtasks.jsp?jobid=" + jobId +
    "&type=" + type.getUrlName() + "&pagenum=1";
          String jobTasksHtml = IOUtils.toString(new
               URL(jobTasksUrl).openStream());
          Matcher taskDetailsUrlMatcher =
               taskDetailsUrlPattern.matcher(jobTasksHtml);

          File dir = new File(jobId);
          if (!dir.exists()){
               dir.mkdir();
          }

          File outFile = new File(dir, type.getUrlName());
          BufferedWriter out = new BufferedWriter(new FileWriter(outFile));

          while (taskDetailsUrlMatcher.find()){
               out.write(taskDetailsUrlMatcher.group(2) + ":
");
               String taskDetailsUrl = new String(_trackerURL  + "/" +
                    taskDetailsUrlMatcher.group(1));
               String taskDetailsHtml = IOUtils.toString(new
                    URL(taskDetailsUrl).openStream());
               Matcher logUrlMatcher = logUrlPattern.matcher(taskDetailsHtml);
               while (logUrlMatcher.find()){
                    String logUrl = logUrlMatcher.group(1) +
                         "&plaintext=true&filter=stdout";
                    out.write(IOUtils.toString(new URL(logUrl).openStream()));
               }
          }

          out.flush();
          out.close();
     }
}The main method builds a screen scraper for this job from a JobTracker URL and job ID. It then uses this screen scraper to scrape the log information for both mapper and reducer. The scraper method uses regular expressions to locate all mapper/reducer pages, reads the pages, and prints out their content.
Logging is not the only way of getting information about MapReduce execution. Next you look at another option of obtaining an execution’s insights — job counters.
REPORTING METRICS WITH JOB COUNTERS
Another Hadoop-specific approach to debugging and testing is the use of a custom metric — job counters. As explained in Chapter 3, counters are lightweight objects in Hadoop that enable you to keep track of events of interest in both the map and reduce stages of processing.
MapReduce itself records a set of metric counters for each job that it runs, including the number of input records consumed by mappers and reducers, the number of bytes it reads from or writes to HDFS, and so on. Because the job page (Figure 5-1) updates automatically (by default, every 30 seconds), these counters can be used to track the progress of the execution. These counters can be also used, for example, to verify that all the input records were actually read and processed.
Table 5-1 shows the group names and counter names within those individual groups currently supported by Hadoop.
TABLE 5-1: Hadoop’s Built-in Counters
| GROUP NAME | COUNTER NAME |
| org.apache.hadoop.mapred.Task$Counter | MAP_INPUT_RECORDS |
| org.apache.hadoop.mapred.Task$Counter | MAP_OUTPUT_RECORDS |
| org.apache.hadoop.mapred.Task$Counter | MAP_SKIPPED_RECORDS |
| org.apache.hadoop.mapred.Task$Counter | MAP_INPUT_BYTES |
| org.apache.hadoop.mapred.Task$Counter | MAP_OUTPUT_BYTES |
| org.apache.hadoop.mapred.Task$Counter | COMBINE_INPUT_RECORDS |
| org.apache.hadoop.mapred.Task$Counter | COMBINE_OUTPUT_RECORDS |
| org.apache.hadoop.mapred.Task$Counter | REDUCE_INPUT_GROUPS |
| org.apache.hadoop.mapred.Task$Counter | REDUCE_SHUFFLE_BYTES |
| org.apache.hadoop.mapred.Task$Counter | REDUCE_INPUT_RECORDS |
| org.apache.hadoop.mapred.Task$Counter | REDUCE_OUTPUT_RECORDS |
| org.apache.hadoop.mapred.Task$Counter | REDUCE_SKIPPED_GROUPS |
| org.apache.hadoop.mapred.Task$Counter | REDUCE_SKIPPED_RECORDS |
| org.apache.hadoop.mapred.JobInProgress$Counter | TOTAL_LAUNCHED_MAPS |
| org.apache.hadoop.mapred.JobInProgress$Counter | RACK_LOCAL_MAPS |
| org.apache.hadoop.mapred.JobInProgress$Counter | DATA_LOCAL_MAPS |
| org.apache.hadoop.mapred.JobInProgress$Counter | TOTAL_LAUNCHED_REDUCES |
| FileSystemCounters | FILE_BYTES_READ |
| FileSystemCounters | HDFS_BYTES_READ |
| FileSystemCounters | FILE_BYTES_WRITTEN |
| FileSystemCounters | HDFS_BYTES_WRITTEN |
You can use these counters to get more information about actual task execution — for example, the number of mapper input/output records (MAP_INPUT_RECORDS/ MAP_OUTPUT_RECORDS), HDFS bytes read and written (HDFS_BYTES_READ/ HDFS_BYTES_WRITTEN), and so on. Additionally, you can add custom counters for application-specific values — for example, the number of intermediate calculations, or an amount of code branching (which can further aid in application testing and debugging).
The context object passed in to mapper and reducer classes can be used to update counters. The same set of counter variables (based on name) is used by all mapper and reducer instances, and is aggregated by the master node of the cluster, so they are “thread-safe” in this manner. Listing 5-9 shows a simple code snippet that demonstrates how to create and use custom counters.
LISTING 5-9: Updating counters
.......................................................................................
private static String COUNTERGROUP = "debugGroup";
private static String DEBUG1 = "debug1";
........................................................................
context.getCounter(COUNTERGROUP, DEBUG1).increment(1);
In Listing 5-9, if this is a first usage of the counter, the appropriate counter object will be created with the initial value of 0.
/** limit on the size of the name of the group **/
private static final int GROUP_NAME_LIMIT = 128;
/** limit on the size of the counter name **/
private static final int COUNTER_NAME_LIMIT = 64;

private static final JobConf conf = new JobConf();
/** limit on counters **/
public static int MAX_COUNTER_LIMIT =
conf.getInt("mapreduce.job.counters.limit", 120);

/** the max groups allowed **/
static final int MAX_GROUP_LIMIT = 50;public static final String COUNTERS_MAX_KEY =
"mapreduce.job.counters.max";
public static final int COUNTERS_MAX_DEFAULT = 120;
public static final String COUNTER_GROUP_NAME_MAX_KEY =
"mapreduce.job.counters.group.name.max";
public static final int COUNTER_GROUP_NAME_MAX_DEFAULT = 128;
public static final String COUNTER_NAME_MAX_KEY =
"mapreduce.job.counters.counter.name.max";
public static final int COUNTER_NAME_MAX_DEFAULT = 64;
public static final String COUNTER_GROUPS_MAX_KEY =
"mapreduce.job.counters.groups.max";
public static final int COUNTER_GROUPS_MAX_DEFAULT = 50;org.apache.hadoop.mapred.Counters$CountersExceededException: Error:
Exceeded limits on number of counters - Counters=xxx Limit=xxxCustom counters are available both programmatically and on JobTracker pages related to a specific job (Figure 5-2). Listing 5-10 shows a simple code snippet that demonstrates how to print out the content of the counters of either a completed or running job.
LISTING 5-10: Printing Job’s counters
     // Now lets get the counters put them in order by job_id and then print
     // them out.
     Counters c = job.getCounters();
     // now walk through counters adding them to a sorted list.
     Iterator<CounterGroup> i = c.iterator();
     while (i.hasNext()){
          CounterGroup cg = i.next();
          System.out.println("Counter Group =:"+cg.getName());
          Iterator<Counter> j = cg.iterator();
          while (j.hasNext()){
               Counter cnt = j.next();
               System.out.println("	Counter: "+cnt.getName()+
                    "=:"+cnt.getValue());
          }
     }
Both logs and counters described in this chapter provide ways to get insight into a job’s execution. They are useful tools that help you to understand what is going wrong. They help to test and debug execution of the user code. Unfortunately, even an absolutely correct Hadoop implementation can fail because of corrupted data. Defensive programming helps to produce implementations that can cope with partially corrupted code.
DEFENSIVE PROGRAMMING IN MAPREDUCE
Because Hadoop runs on a vast number of input records (some of which can be corrupted), it is often counterproductive to kill a job every time a mapper cannot process an input record either because a record itself is corrupted, or because of bugs in the map function (for example, in third-party libraries, for which the source code is not available). In this case, a “standard” Hadoop retrying mechanism will do you no good. No matter how many times you try to read a “bad” record, the end result is going to be the same — map execution will fail.
If an application can tolerate skipping some of the input data, correctly processing situations like this makes the overall application much more reliable and easier to maintain. Unfortunately, such an implementation is nontrivial. An exception, in this case, can occur either in the reader that is responsible for reading data, or a mapper that is processing this data. Correctly processing these situations requires the following:
- Careful error handling in the reader, so that all read errors are correctly processed, and the file pointer is moved to the next record
- A mechanism for communicating with the mapper to report reader errors so that the mapper can correctly output information about them
- Careful error handling in the mapper, so that all the errors are correctly processed
- A custom OutputFormat (similar to the one described in the Chapter 4) that writes error data in a dedicated error output directory
Fortunately, Hadoop enables you to avoid such a tedious implementation by providing a feature for skipping over records that it believes to be crashing a task. If this skipping feature is turned on, a task enters into skipping mode after it has been retried several times. Once in skipping mode, the TaskTracker determines which record range is causing the failure. The TaskTracker then restarts the task, but skips over the bad record range.
Applications can control this feature through the SkipBadRecords class, which provides several static methods. The job driver must call one or both of the following methods to turn on record skipping for map tasks and reduce tasks:
setMapperMaxSkipRecords(Configuration conf,long maxSkipRecs)
setReducerMaxSkipGroups(Configuration conf,long maxSkipGrps)
If the maximum skip range size is set to 0 (the default), record skipping is disabled.
The number of records skipped depends on the frequency with which the record counter is incremented by the application. You should increment the counter after every record is processed. If this is not possible (some applications might batch their processing), the framework may skip additional records surrounding the bad one.
Hadoop finds the skip range using a divide-and-conquer approach. It executes the task with the skip range divided by two each time, and determines the half containing the bad record(s). The process iterates until the skip range is within the acceptable size. This is a rather expensive operation, especially if the maximum skip range size is small. It might be necessary to increase the maximum number of task attempts in Hadoop’s normal task recovery mechanism to accommodate the extra attempts.
If skipping is enabled, tasks report the records being processed back to the TaskTracker. When the task fails, the TaskTracker retries the task, skipping the records that caused the failure. Because of the extra network traffic and bookkeeping to maintain the failed record ranges, skipping mode is turned on for a task only after it has failed twice.
For a task that consistently fails on a bad record, the TaskTracker runs several task attempts with the following outcomes:
- Failed attempt with no special actions (twice)
- Failed attempt with failed record is stored by the TaskTracker
- New attempt skipping the bad record that has failed in the previous attempt
You can modify the number of task failures needed to trigger skipping mode by using the setAttemptsToStartSkipping(int attempts) method on the SkipBadRecords class.
Hadoop will log skipped records to HDFS for later analysis. They’re written as sequence files in the _log/skip directory.
SUMMARY
This chapter discussed options for building reliable MapReduce applications. You have learned how to unit test MapReduce application components by leveraging MRUnit, and how to debug and test complete applications using Hadoop’s local job runner. You have also learned how to leverage logging and job counters to get insights into MapReduce execution. Finally, you learned how to use defensive programming to deal with the corrupted data.
Now that you know how to design, implement, and debug MapReduce, Chapter 6 discusses how to orchestrate MapReduce applications using Apache Oozie.