
Chapter 3
Synchronous Machines
3.1. Introduction
The industrial value of synchronous machines is considerable: first, used as generators (called “AC generators”), they provide almost all the production of electric energy.
In addition, associated with static converters (inverters or cycloconverters) functioning on variable frequencies, synchronous motors have become essential during recent decades in a number of industrial areas: rail traction, naval propulsion, manufacturing industry, iron and steel industry, oil exploitation, machine-tools, etc.
In this chapter, we shall mainly consider cylindrical machines, however we will address salient pole machines at the end of the chapter.
3.2. Introduction and equations of the cylindrical synchronous machine
3.2.1. General description
We shall consider a machine with cylindrical field spools, each one having 2p poles at the stator as well as at the rotor. In most cases the field system is at the rotor. It is supplied with DC current or provided with permanent magnets. The field current is usually injected in the rotor via slip rings and brushes. The armature (Figure 3.1), which usually is 3-phase, is at the stator and makes exchanges with a source (network or static converter) or with a voltage and current charge assumed to be sinusoidal a priori. Depending on the kind of power exchanged by the machine with its environment, we shall either talk about an AC generator or about a synchronous motor.
We shall usually assume the machines to be “well built”, that is to say with a sinusoidal repartition of the ampere-turns, enabling us to overlook the space harmonics.
3.2.1.1. Main notations
– f: stator currents frequency.
– ij: instantaneous value of the current in phase j.
– Ij: rms value of current ij.
– J: moment of inertia.
– Ls: self inductance of a stator phase.
– LR: self inductance of a rotor coil.
– MS: mutual inductance between two stator phases.
– M: maximum value of the rotor–stator mutual inductance.
– L = LS – MS: synchronous inductance.
– p: number of pole pairs.
– P: active power.
– Q: reactive power.
– S: apparent power.
– V: rms value of the voltage per phase.
– ![]() : complex stator impedance.
: complex stator impedance.
– ω: stator currents angular frequency.
– Θ: stator/rotor mechanical angle.
– θ: electrical angle (Ǝ = pθ).
– Ω speed of rotation.
– φ: voltage/current phase shift.
– ψj: total flux in phase j.
– Γi: instantaneous value of the torque.
– γ: load angle.
– δ: power angle.
– μ: ampere–turns equivalence factor.
–λ = lω: leakage reactance.
Figure 3.1. Synchronous machine stator (photo source: Converteam)

3.2.1.2. Conventional representation
We shall describe the machine in the form of three coils A, B and C, representing the stator phases, and representing the rotor field system of a coil R (Figure 3.2).
Figure 3.2. Conventional representation of the synchronous machine

Conventionally, we will choose the axis of phase A as the origin of the angles which will be counted positively in the trigonometric direction. Phases B and C are then shifted in space respectively by 2π/3 and 4π/3 electric in relation to the origin, and the field system is shifted by an electric angle θ.
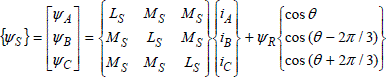
3.2.1.3. Inductances and coupling matrixes
Let us introduce the stator coupling matrix LS, the rotor coupling matrix LR and the stator-rotor coupling matrixes LSR and LRS:

3.2.2. Why synchronous?
In order to justify the name given to this machine, we shall make two calculations: one for a functioning as a generator, and the other, as a motor. Let us assume first that the machine is driven at an angular speed Ω and that only the field system is supplied by a DC current IR. The stator phases not being supplied, their flux are exclusively caused by the excitatation current IR.
Since θ = θ0 + ωt = θ0 + pΩ t, it can be written that:

Those flux being variable in terms of time, electromotive forces appear in the stator. They are given by:

which establishes that this machine enables the production of a 3-phase sinusoidal voltage system, for which frequency is proportional to the speed of rotation:
![]()
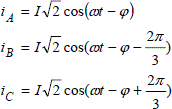
Let us now assume that the stator of this machine is supplied with a balanced 3-phase sinusoidal current system as follows:

As the rotor is still supplied by a DC current IR, we shall assume that it turns at the angular speed Ω'= ω'/p, so that θ = θ0 + Ω't.
In using the general expression giving the instantaneous torque of a cylindrical machine:
[1.8a] ![]()
with:

We obtain:
![]()
and finally:
![]()
This expression shows that, if and only if ω' = ω, torque Γi will have a mean value different from zero. In that case Γi will be constant and equal to:
[3.1] ![]()
In the following, it will be set down:
![]()
γ is called the load angle.
It is now clearly illustrated that it is necessary for the speed of rotation to be proportional to the frequency of the armature currents for a synchronous machine to make a continuous energy conversion:
[3.2] ![]()
Also let us now assume that this machine is supplied by non-sinusoidal stator currents as follows:

In transferring those expressions to [1.8a], we obtain, after a few calculations:
![]()
This expression clearly shows that only one of the current harmonics (usually, the fundamental) gives a continuous energy conversion; the others generate some torques of zero mean value, which cause vibrations and losses.
This shows the relevance of the reduction of current harmonic factor when synchronous motors are supplied by power electronics converters.
3.2.3. Rotation speeds at constant frequency
When a synchronous machine is connected to a fixed frequency network (50 Hz in Europe, 60 Hz on the American continent, for example), its rotation speed expressed in revolutions per minute (rpm) is:
![]()
Thus, if f = 50 Hz, ![]() rpm. The possible speeds for synchronous machines (usually AC generators) connected to a 50 Hz network are therefore sub-multiples of 3,000 rpm.
rpm. The possible speeds for synchronous machines (usually AC generators) connected to a 50 Hz network are therefore sub-multiples of 3,000 rpm.
3.2.4. Equations of the cylindrical machine
3.2.4.1. Assumptions and sign covenant
We shall consider machines with a constant air-gap in electrical and mechanical stationary states. We neglect the magnetic saturation and hysteresis phenomena. The stator currents are assumed to be sinusoidal, and the rotor current is constant. The only losses taken into account are those due to the Joule effect.
We choose sign covenants relative to a “motor” working, that is to say that the mechanical power is counted positively if it is furnished to a load, and the active and reactive electrical powers are counted positively when they are absorbed by the machine.
3.2.4.2. Calculation of the flux in a phase
Let us consider Figure 3.2, which represents the stator and rotor phases of the machine with their respective voltages and currents. We can express the various flux in the machine as follows:
![]()
with:
![]()
and:
![]()
hence the total flux in a stator phase:
![]()
which, when it is developed, gives:
[3.3] 
assuming that:
If the first row of [3.3] is developed in order to calculate the flux in phase A:
![]()
hence:

likewise:

In order to determine the rotor flux ψR, a similar calculation leads to:
![]()
These expressions of the instantaneous flux within the different coils of the machine lead to the following comments:
– the rotor flux ΨR does not depend on time, therefore there is no e.m.f. induced in the field winding;
– the total flux per stator phase is the sum of two sinusoidal terms with the same angular frequency ω it thus has an angular frequency ω itself. This will enable us to use complex notations.
If the complex number ![]() associated with the current iA is introduced and if
associated with the current iA is introduced and if ![]() A is similarly associated with flux ΨA, we can write:
A is similarly associated with flux ΨA, we can write:
![]()
For phases B and C, similar expressions would be ob tained, and it is therefore possible, in removing the suffixes, to unify the general expression of the total flux per stator phase:
![]()
If the complex representation of the voltage per stator phase is ![]() , and the stator phase resistance is R, we can write:
, and the stator phase resistance is R, we can write:
that is to say:
[3.4] ![]()
with L = (LS – MS): synchronous inductance.
3.2.4.3. Electrical equation of the cylindrical synchronous machine
![]()
or also:
[3.5] ![]()
with:
![]()
![]() is the complex representation of the electromotive force per phase of the machine and Lω, the synchronous reactance. If
is the complex representation of the electromotive force per phase of the machine and Lω, the synchronous reactance. If
[3.6] 
δis the power angle of the machine.
This expression emphasizes that the amplitude of the electromotive force E is proportional to the field system current IR, and also to ω, and thus to the rotation speed Ω Note the synchronous impedance:
![]()
The electrical equation becomes:
![]()
3.2.4.4. Equivalent diagram
Equation [3.5] represents the equivalent per phase diagram of Figure 3.3, which is a diagram of an active dipole.
Figure 3.3. Per phase equivalent circuit of the cylindrical synchronous machine

3.3. Analysis of the synchronous machine connected to an infinite power network
We shall now consider that the synchronous machine (motor or AC generator) has its armature winding connected to a network. The power of this network is far superior to the power of the machine. Through a misuse of language, it is then called a network of “infinite power”.
Assuming this, it is admitted that the network fixes the voltage at the terminals of the machine, as well as the stator angular frequency ε. It is then convenient to consider the voltage as the phase origin. The electrical equation per phase is written:
![]()
where V is a real number.
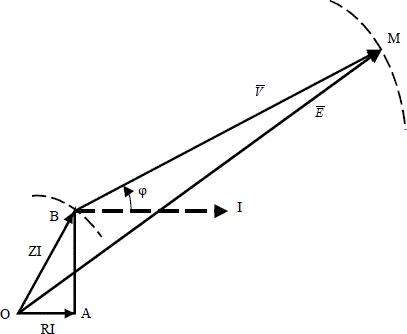
3.3.1. Phasor diagram
The previous electrical equation can be illustrated by a vector diagram in the “voltages plane” (Figure 3.4), called a “voltage diagram”.
Figure 3.4. Phasor diagram

It can be noted that since V is assumed to be constant, points O and A are fixed and point M is representative of the “operating point” of the machine: active and reactive powers exchanged with the network, torque, mechanical power exchanged on the shaft, etc. We shall see in the following of this paragraph how it is possible to deduce those quantities from the position of point M.
3.3.2. Active (P) and reactive (Q) graduation of the voltage diagram
In order to deduce the powers exchanged with the network from the previous diagram, we shall graduate it in active power P and reactive power Q. We shall therefore determine the axes and the corresponding scale. First let us consider the complex apparent power:
![]()
We have:
![]()
that is to say:
![]()
The location of points M causing ![]() to have positive real values provides the axis of the active power and its orientation. The previous expression shows that we must have:
to have positive real values provides the axis of the active power and its orientation. The previous expression shows that we must have:
![]()
In the same way, ![]() will be a negative imaginary number (and therefore S will be a positive imaginary number) if:
will be a negative imaginary number (and therefore S will be a positive imaginary number) if:
![]()
which defines the axis of the reactive powers. We can therefore complete the diagram in making the axes of absorbed active and reactive powers appear (Figure 3.5). As the plane is initially graduated in voltages, the power scale will be obtained in multiplying the scale of the voltages by ![]() .
.
If the projections of point M on the axes are considered: q on the reactive powers axis and p on the active powers axis, qM will measure power P, and pM, power Q absorbed in the network. This graduation will enable us to characterize the operating modes of the synchronous machine:
– if P < 0: generator mode (AC generator);
– if P > 0: receiver mode;
– if Q < 0: so–called “capacitive” state, through an analogy with capacitors which supply reactive power;
– if Q > 0: “inductive” state, in comparison to the inductances which absorb reactive power.
This enables us to characterize the four quadrants of the plane delimited by axes P and Q (Figure 3.5).
Figure 3.5. Active (P) and reactive (Q) graduation of the phasor diagram

3.3.3. “Internal” powers
In section 3.3.2, we emphasized a half-plane in which the machine absorbs active power. This can encourage us to consider that the machine works as a motor but, in order to establish it we have to calculate the mechanical power. With this end in view let us consider the expression of the torque P given by equation [3.1]:
![]()
Let us introduce the “internal apparent power” given by:
![]()
that is to say:
![]()
hence the “internal active power”:
![]()
In bringing together this equation and the expression of the torque [3.7], we obtain:
![]()
which shows that, considering the hypotheses made (neglected mechanical losses), the internal active power P' represents the mechanical power produced by the synchronous machine. In order to ensure that the machine operates as a motor, P' will have to be positive.
We shall now look for the locus of the points corresponding to P' > 0 in the plane previously introduced [Figures 3.4 and 3.5]. Let us consider the axis [Ax, Ay] in Figure 3.6 in which x and y are the coordinates of the point M:
![]()
Calling (– a) the abscissa of point O in this coordinate system, leads to:
![]()
The expression of S' being:
![]()
with:

we get:
hence:
![]()
The locus of the points corresponding to a constant mechanical power is therefore defined by:
![]()
expression which can be written as follows:
![]()
which shows that the locus of points corresponding to P' = constant are circles centered on the point Ω1 with coordinates:

It can be noted that Ω1 is at the intersection of axis P with the median of segment OA. In the special case when P' = 0, circle (C0) has the radius ![]() and goes through points O and A (Figure 3.6). The motor operating points (P' > 0) are therefore inside (C0). It is then possible to distinguish the different operating modes of the synchronous machine in Figure 3.6.
and goes through points O and A (Figure 3.6). The motor operating points (P' > 0) are therefore inside (C0). It is then possible to distinguish the different operating modes of the synchronous machine in Figure 3.6.
Figure 3.6. Delimitation of the different operating modes on the phasor diagram

A specific mode corresponds to the semicircle (C0) located in the quadrant (P > 0, Q < 0): the machine works on a no-load motor (zero mechanical power) connected to a network from which it absorbs a little active power corresponding to the losses and to which is provides reactive power. This “synchronous compensator” state is commonly used to supply energy transport networks with the reactive power they need.
3.3.4. Stability of the synchronous machine
We have seen that the position of point M provides some information: active and reactive powers exchanged with the network, mechanical power (and therefore torque, too) on the shaft, etc. We are now going to see that all the operating points of this plane are not feasible.
Let us first remind ourselves that, in order to avoid excessive overheating, the field system current IR and the rms value I of the stator current have to be lower than their nominal values, respectively called IRN and In. Point M will therefore have to be inside two circles, the first centered in O and with a radius of ![]() , and the second centered in A and with a radius of ZIn.
, and the second centered in A and with a radius of ZIn.
Another limitation to the positioning of M within the plane exists: the stability of the machine. Indeed, at the beginning of this chapter we saw that the synchronous machine has a non-zero average torque only when it runs at the synchronous speed. If, for any reason (for example, a torque variation), this speed happens to be modified, it shall then be necessary for the machine to recover it.
In order to carry out this stability study, we shall start with the equation of the dynamic applied to rotating solids, or “mechanical equation” of the rotating machines:
[1.15] ![]()
where J is the moment of inertia of all the rotating parts (rotor of the synchronous machine and associated “mechanical charge”), Γ the torque of the synchronous machine, and ΓC, the torque of the associated machine (mechanical charge for a motor working or driving device for an AC generator working). And yet:
![]()
with:
![]()
Therefore:
![]()
Let us now assume that for a machine initially functioning in steady state (Ω constant, and therefore Γ = Γ0 = Γc), with a voltage V and with a field current IR both constant (and therefore with an electromotive force E constant in magnitude), an instantaneous variation of torque ΔΓ(or of power exchanged with the network) occurs. In Figure 3.7, it is expressed by a variation Δδ of the power angles δ.
Figure 3.7. Torque and power angle variation

By calling δ0 the initial value of this angle, we get:
![]()
hence:
![]()
and:
![]()
With the machine working initially in steady state, it is possible to write:
![]()
If only small variations about the starting point are taken into consideration, the torque characteristic in terms of δ can be assimilated to its tangent at the point under consideration. Therefore we can write:
![]()
hence:
[3.8] ![]()
This is a differential equation of the second order of variable Δδ. If ![]() , Δδ has an exponential growth characterising an unstable functioning of the machine. The result is that a necessary condition of stability is:
, Δδ has an exponential growth characterising an unstable functioning of the machine. The result is that a necessary condition of stability is:
![]()
In order to be able to discuss this condition, a torque expression in which δ is the only variable has to be established. Let us look at the expression of apparent intern power ![]() ' again:
' again:

that is to say:
![]()
hence:
![]()
and therefore:
[3.9] ![]()
The necessary condition for stability established above becomes:
![]()
At starting point δ0, we shall therefore have:
![]()
The necessary condition for stability is therefore written:
[3.10] ![]()
We can deduce that the straight line OD (Figure 3.6) is the stability limit.
The previous condition does not constitute a necessary and sufficient condition for stability, because the solution of the differential equation [3.8] is then as follows:
![]()
with:
![]()
Δδmax is the maximum value of Δδ. It is a sinusoidal variation of δ around initial value δ0. In order for Δδ to tend toward zero, and therefore for the stability condition to become necessary and sufficient the differential equation [3.8] has to contain a damping term in ![]() .
.
This can be obtained by providing the rotor of the machine with “damping windings”; this is usually a winding made of bars longitudinally inserted in the rotor and short-circuited at their two extremities in the same way as the cage of an induction motor. When the synchronous machine is in a steady state, this “damping cage” does not play any part because there is no current in it. On the other hand, as soon as the machine does not work at a strict synchronism, the damping cage is subjected to a flux varying at a frequency proportional to the relative speed difference of the rotor and of the air-gap field or “slip” (see Chapter 4, “Induction Machines”). If this slip is called g, it can be shown that the “asynchronous torque” which then appears can be written (if g is small):
Γa ≈ Kg (see section 4.5.3 and equation [4.19])
where K is a constant, and:

In transferring this result into the mechanical equation:
[3.11] ![]()
If – ξ < δ0 < π – ξ, this equation has a damped sinusoidal solution which brings Δδ back to zero after a few oscillations. The synchronous machine is therefore stable in this part of the plane.
3.3.5. V-curves called “Mordey curves”
These are the characteristics of the variations of armature current I in terms of the field system current LR for a load operating point at a constant internal power P' (that is to say at a constant torque Γ). Since the electromotive force is proportional to LR we can indiscriminately draw I = f(IR) or I = f(E).
For this operating state, the machine can be considered as a system with one “input” IR and two “outputs”: the armature current I and its phase shift φ in relation to voltage V. Torque Γ;(equal, in a steady state, to charge torque Γc) is considered as a “perturbation” (Figure 3.8).
Figure 3.8. “System” representation of the synchronous motor operating with constant P'

In order to determine those curves, we shall refer to Figure 3.6. For a given power P', point M draws a semicircle bordered by the stability limit line. The corresponding Mordey curve is therefore the transform of this semicircle into the plane I(E). This curve does not usually have any simple analytical expression, we shall first attempt to establish the transforms, in the “Mordey plane”, of particular curves of the voltages plane.
3.3.5.1. Mordey curve for P'= 0
Let us first assume that operating point M draws an arc AD corresponding to Q < 0. The following relationship can then be written:
![]()
that is to say:
![]()
a relationship which defines an elliptic arc limited at both points:

If Q > 0, point M follows the arc AO, which leads to the relationship:
![]()
that is to say:
![]()
It is once again an elliptic arc limited at both points:

3.3.5.2. Stability limit curve
If an operating point is located on segment OD of the stability limit, it can be written:
![]()
This is a hyperbola arc limited by the two points:

3.3.5.3. Locus of the armature currents minima
When point M draws a semi-circle at constant P', the armature current is minimal when the absorbed reactive power Q is equal to zero. This corresponds to the operating point located on the intersection of axis P with the considered semi-circle.
The locus of currents minima is therefore the transform of straight line segment AΩ1 for which the relationship linking I to E can be written:
![]()
it is therefore a hyperbola arc limited by points:

3.3.5.4. General case, P'≠0
The previous curves enable us to be more specific about the appearance of characteristic I(E) for a particular value of P' (Figure 3.9): it begins on a point P5 homologue to point M5 (see Figure 3.6) of intersection of circle P' = constant with the stability limit line, goes through a minimum of current in P6 and ends in P7, transform in Mordey plane of M7, second intersection of the circle with the stability limit.
The general appearance of this characteristic justifies the name of “v-curve” which it is often called. It is interesting as it enables a choice, for a given mechanical power (or, likewise, a fixed torque), of the value of the excitation current: which is usually sought to be located around point P6, in order to minimize the Joule losses.
A position slightly beyond this point enables us to provide the electrical network with reactive power without any major modification of current I, because of the relatively flat shape of the curve when nearing the current minimum.
Figure 3.9. Mordey curves. Machine 220 V, Z = 10Ω, ζ= 67.5°

3.3.6. Case when resistance R is negligible
If stator resistance R is neglected, which generally is acceptable for high power machines, the synchronous inductance becomes equal to the synchronous reactance, and we have ξ = π/2.
The axis of the active powers becomes vertical and the axis of reactive powers becomes horizontal. Furthermore, as P' is now equal to P, the locuses of the points with constant mechanical power become horizontal straight lines, and the stability limit, a vertical straight line.
Figure 3.6 therefore transforms into Figure 3.10, and the two ellipse arcs P1P2 and P1P3 (Figure 3.9) then become straight line segments. The electromagnetic torque is written:
![]()
Figure 3.10. Phasor diagram with R = 0

3.4. Considerations about the salient pole synchronous machine
We have, from the beginning of this chapter, studied the behavior of cylindrical synchronous machines. However it has to be remembered that for many applications (low or medium speed motors and slow AC generators in hydraulic power stations, in particular), the rotor has salient poles.
These machines have a single-phase field system winding made of coils wound around ferromagnetic poles and connected in series in order to ensure an alternation of the poles. Action is taken on the shape of the polar shoe in order to obtain a repartition, close to a sinusoid, of the flux density within the air-gap. This structure is thus characterized by the simplicity of its making and of its maintenance.
Alternatively, for mechanical reasons, it is usually used for applications where speed does not exceed 1,000 rpm.
The major difficulty for the study of those machines is due to the geometric anisotropy (variable air-gap), and therefore magnetic anisotropy of the rotor, which leads to a dependence of the different mutuals and of most inductances, in position θ of the rotor, upon the stator. The armature reaction then varies according to the load state of the machine.
We shall, in this section, present a model of these machines overlooking the space harmonics (approximation at the first harmonic) and based on fields and corresponding flux density variations in the air-gap. These results are obtained using finite element computation.
3.4.1. Torque and inductance matrix
We consider a machine having a non-salient stator bearing a 3–phase armature winding and a salient pole rotor with the field system winding. Rotor and stator each have 2p poles.
This machine can be represented, as for the cylindrical machine, with three coils A, B and C representing the stator phases and with a coil R representing the rotor field system (Figure 3.2). The damping circuits (which are not in use in a steady state of the machine) are not taken into account. In what follows, magnetic saturation phenomena shall be neglected. The global expression of the flux is written:
[3.12] 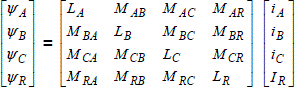
which can also be written:

The stator is considered to be non-salient, the reluctance met by the field system flux is independent from the position of the rotor. We deduce that Lr is independent from θ. The rotor reluctance being variable, the stator inductances depend on position θ. In limiting the study to the fundamental we get:
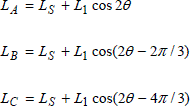
this is the same for the mutuals between the stator phases:
Note that L1 = 0 for a cylindrical rotor.
3.4.2. Calculation of the flux
We consider that the field system winding is supplied by a DC current IR and that the three stator phases are supplied by a 3-phase current system:

Flux at the rotor given by:
![]()
has an expression identical to expression obtained for a cylindrical machine. Flux in phase A is given by:

where ψ AR is the flux generated by the rotor excitation current. This is expressed in the same way as for a cylindrical machine. Flux ψ AS is the armature reaction flux, it corresponds to the flux generated by the stator currents:
![]()
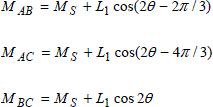
Contrary to the cylindrical machine, this flux depends on the position of the rotor in relation to the stator. This is illustrated by Figures 3.11 to 3.13, which present the air-gap radial flux density BN(θ) variation as well as the armature reaction field lines, for three positions of the rotor in relation to the stator electromotive force εs.
These figures correspond to a bipolar salient pole rotor machine with a 24 slot stator. Each stator phase therefore takes 4 “outward” slots and 4 “return” slots. We also assumed that this stator is supplied by a balanced 3-phase current system, considered at the one particular instant when iA = –iB and iC = 0. The “outward” conductors are drawn in a shade darker than the “return” conductors.
On these figures, two axes are introduced: direct axis d, merged with the axis of the rotor, and axis q in quadrature. We can observe that, when mmf εs is colinear with axis d (Figure 3.11), the reluctance met with the flux is small. The corresponding inductance is then maximum; this is written Ld or direct axis synchronous inductance. Along the air-gap, the appearance of normal flux density Bn is almost sinusoidal, disturbed by the stator slots. The origin of the angles is the horizontal axis, Bn is at its maximum for θ= π/2, that is to say along axis d.
Figure 3.11. No-load armature reaction field (load angle γ= π) : a) field lines; b) normal flux density in the air-gap
When εs is aligned with axis q (Figure 3.12), the reluctance is important and the corresponding inductance is minimal. This inductance is written Lq or “synchronous inductance in quadrature”. In accordance with the field lines, the normal induction in the air-gap decreases in the neighborhood of axis q. When εs is shifted by a load angle γ in terms of axis d (Figure 3.13), the normal flux density in the air-gap presents a complex appearance depending on γ.
Figure 3.12. Armature reaction field for a load angle γ= π/2: a) field lines; b) normal flux density in the air-gap

Figure 3.13. Armature reaction field for a load angle γ a) field lines; b) normal flux density in the air-gap

If the magnetic saturation is neglected, the principle of superposition can be used to determine the armature reaction magnetic flux for any position γ in relation to the flux corresponding to the positions d (γ = 0 or π) and q (γ = ± π/2).
εs is then decomposed into two mmf: one, εsd, in the direction of axis d, and the other, εsq, in quadrature (Figure 3.14).

Figure 3.14. Magnetomotive force following axes d and q

Flux ψd corresponding to εsd is a direct axis flux; it is proportional to inductance Ld and is written:
![]()
Flux ψq relative to εsq is the in-quadrature flux; it is proportional to Lq, with:
![]()
id and iq are then the components of current iA following respectively axes d and q:
![]()
The armature reaction flux and the flux in phase A are therefore written:

3.4.3. Electrical equation and phasor diagram
In adopting the sign covenants relative to a load operating mode, the electrical equation for phase A, with resistance R, is written:
![]()
The total flux in phase A is the sum of the sinusoidal terms of similar angular frequencies ε. The complex notation can then be used. In phases B and C, similar expressions would be obtained, and it is therefore possible, by removing the indexes, to write the phase electrical equation as follows:
[3.13] ![]()
where ![]() is the complex representation of the no-load emf. This is in back quadrature with current
is the complex representation of the no-load emf. This is in back quadrature with current ![]() is the complex representation of the phase current. Xd = Ldω is the direct reactance. Xq = Lqω is the reactance in quadrature.
is the complex representation of the phase current. Xd = Ldω is the direct reactance. Xq = Lqω is the reactance in quadrature.
Regarding only the fundamental, it can be shown that:

By introducing the emf of “salience” ![]() s and the “resulting” emf
s and the “resulting” emf ![]() t
t

equation [3.13] becomes:
[3.14] ![]()
An expression similar to this can be obtained for the cylindrical machine. This equation can be illustrated by the phasor diagram shown in Figure 3.15.
Figure 3.15. Phasor diagram of the salient pole machine

3.4.4. Calculation of the torque and stability analysis
Remember the general expression giving the instantaneous torque value of a rotating machine:
![]()
matrix L is defined in equation [3.12].
It is considered that the three stator phases are supplied by a 3-phase current system, and it is stated that the machine rotates at speed Ω so that:
![]()
It can then be shown that the average torque is different from zero only at the synchronism speed:
![]()
At this speed, it is equal to the instantaneous torque, and it is given by:
[3.15] ![]()
The load angle is equal to γ = θo + φ.
The first term of this expression, ΓL, is identical in form to that of a cylindrical machine. This term corresponds to the interaction of the stator and rotor currents. The second term, ΓS, is a salience torque (or reluctance torque) which depends on the square value of I; it is linked to the rotor geometry.
If the stator resistance is overlooked (case of high power machines), and we introduce internal angle δ given by:
![]()
the torque can be written:
[3.16] ![]()
In considering only the small variations in comparison with the initial equilibrium point, it can be shown that a condition necessary to the machine stability is written:
![]()
Figure 3.16 shows the variation of the average torque given by [3.16] in terms of δ. In this example, the maximum value of the reluctance torque equals 30% of this, corresponding to the action of stator currents on the rotor current (cylindrical machine).
At a given stator voltage, when the internal angle increases, that is to say when the load increases, we can observe that the salience effect leads to a maximum torque Γmax greater than this Γ1 of an equivalent cylindrical machine. It is also observed that the stability limit is obtained for an absolute value of angle δ lower than π/2. This diagram shows the interest of salient poles synchronous motors.
Figure 3.16. Torques of a salient pole machine

3.5. Consideration about permanent magnet machines
Several structures of permanent magnets synchronous machines can be encountered. We shall restrict ourselves to a non-exhaustive presentation of those with a cylindrical 3-phase stator similar to the machines studied in the previous sections.
The magnets are set in the rotor in order to generate the field necessary for the machine magnetization. Their magnetization can be radial (Figure 3.17), tangential (Figure 3.18), or mixed (Figure 3.19).
As in standard machines, we can distinguish:
– “sinusoidal distribution of ampere-turns machines” particularly appropriate to the continuous energy conversion when the stator currents are sinusoidal;
– “trapezoidal” emf machines or “DC brushless”, whose conductors are usually concentrated in one slot per pole and per phase, and are usually supplied by current commutators.
Figure 3.17. Bipolar SPM synchronous machines: radial magnetization
In the following we shall propose a classification of these structures according to the arrangement of the magnets. It is possible to distinguish machines with SPM (surface permanent magnets), INSET and IPM (intern permanent magnets).
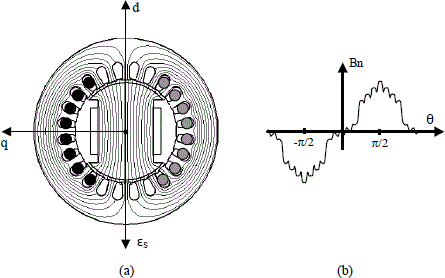
3.5.1. Surface permanent magnets machines
The magnets are set on the surface of the rotor (Figures 3.17 and 3.19). This structure is largely used because of its simple manufacturing. In order to ensure their mechanical resistance to centrifugal forces, the magnets are often bound by amagnetic binding bands. This causes an additional cost and also an increase of the air-gap.
It can be noted that the “magnetic” air-gap, that is to say the air-gap seen through the field generated by stator currents, is almost constant, and its value em is important because the magnets have a magnetic permeability close to that of air. We have:
![]()
where ha is the magnets thickness (Figure 3.25), e is the “mechanical” air-gap, and ef is the binding band thickness.
These machines are therefore cylindrical, characterized by relatively small stator inductances and mutuals because of the magnetic air-gap thickness. The armature reaction is therefore much smaller than the reaction of standard excitation machines.
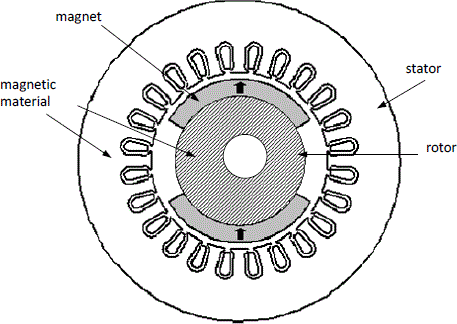
3.5.2. Machines with inserted magnets
The magnets are set between magnetic parts as drawn in Figure 3.20. This figure introduces the direct axis d, joined to the axis of the excitation field, and the axis q in quadrature. Note that these are salient pole machines because the magnetic air-gap varies between a minimal value equal to e in the direction of the axis q and a maximum value equal to (e + h) in the direction of the axis d.
This variation of the air-gap leads to a so-called “inverted” structure because the reactance in quadrature is bigger than the direct reactance.
3.5.3. Machines with embedded magnets
The magnets are set inside the rotor (Figures 3.18 and 3.21), which protects them from mechanical stress and allows considerable rotation speeds. This arrangement leads to salient pole machines because the magnetic air-gap is not constant.
This structure enables us to channel the flux generated by the magnets in order to get the desired levels and variations of the flux density in the air-gap. The configuration given by Figure 3.18 is called “with flux concentration” configuration because the air-gap magnetic flux is almost equal to the sum of the flux generated by two successive magnets (Figure 3.22). Sufficient flux density values, around 0.7 T, can be obtained in the air-gap, by using, for example, ferrites, which are cheap magnets but in which the remanence flux density is quite small.
Figure 3.18. Rotor of a 12-pole IPM synchronous machine with flux concentration: tangential magnetization
Figure 3.19. Rotor of a 4-pole SPM synchronous machine: combined magnetization
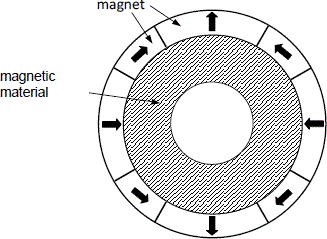
Figure 3.20. Rotor of a 2-pole INSET synchronous machine: radial magnetization
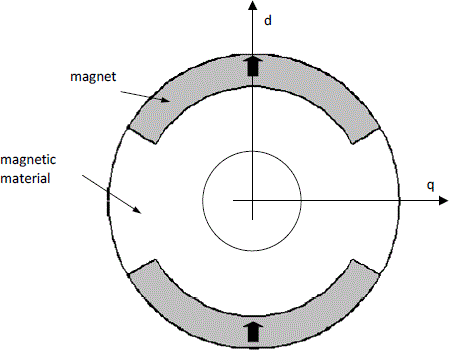
Figure 3.21. Rotor of a 4-pole IPM synchronous machine: radial magnetization
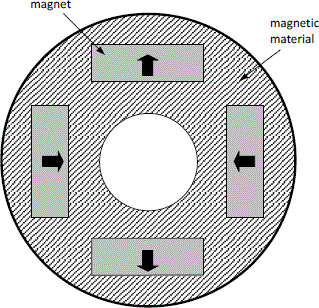
Figure 3.22. Field lines due to the magnets in no-load operation of a 12-pole IPM synchronous machine with flux concentration:tangential magnetization

3.5.4. Modeling of permanent magnet machines
A machine with a non-salient stator bearing the 3-phase armature winding and a salient rotor with permanent magnets is considered. The stator and the rotor each have 2p poles. This machine can be represented, as for the wound rotor machine, in the form of three coils A, B and C representing the stator phases of a magnet generating the rotor flux on the axis R (Figure 3.23).
Figure 3.23. Conventional representation of the permanent magnets synchronous machine

The total flux in a stator phase can be written:

which can also be written as follows:
![]()
The co-energy of the system is then written:
![]()
![]() em0 is the co-energy of the system when all the currents are zero. It can be shown that:
em0 is the co-energy of the system when all the currents are zero. It can be shown that:
![]()
Wem0 is the electromagnetic energy stored in the machine when all the currents are zero.
The instantaneous torque is then obtained by differentiating, with constant currents, the co-energy. We have:
[3.17] 
The first term of expression [3.17] is the reluctance torque (or salience torque); it is linked to the rotor geometry. The last term is the cogging torque due to the interaction of the magnets with the stator slots. The second term of the expression is the “hybrid” torque; it corresponds to the interaction of the stator currents with the rotor flux. This is the main torque.
3.5.5. Cylindrical machine modeling
In the following, a symmetrical 3-phase machine with p pair of non-salient poles is considered (Figure 3.24). The inductances and the stator mutual inductances are therefore constant.
The magnetic saturation phenomena are neglected, as well as the space harmonics in restricting the study to the fundamental. The influence of stator slots is also neglected; the cogging torque is then considered to be zero.
Figure 3.24. Cylindrical synchronous machine and closed circuit of integration (c)

Figure 3.25 shows the thickness ha and the opening angle β of the magnets. θS and θR are the angles locating the position of a point P of the air-gap in relation to the stator axis S and the rotor axis R.
Figure 3.25. Cylindrical rotor of SPM synchronous machine

3.5.5.1. Electrical equation of the synchronous machine
Considering the adopted hypotheses, the flux caused by the magnets can be approximated by:
[3.18] 
The total flux in a stator phase can be written:
Assuming that stator currents are as follows:

we obtain, for phase A:
![]()
thus, in introducing the synchronous inductance L = (LS – MS):
![]()
The machine is considered to have the rotation speed:
![]()
The position of the rotor in relation to the stator is θ = ωt + θ0 We have:
![]()
For phases B and C, we get:

The total flux per stator phase with the angular frequency ε and complex numbers ![]() , with current iA, and
, with current iA, and ![]() A, associated with flux ΨA are introduced. This can be written:
A, associated with flux ΨA are introduced. This can be written:
![]()
For phases B and C similar expressions would be obtained, and therefore it is possible, by removing the indexes, to unify the general expression of the total flux per stator phase:
![]()
If the complex representation of the voltage per stator phase is called ![]() and the resistance of the stator phase is called R, we can write:
and the resistance of the stator phase is called R, we can write:
![]()
that is to say:
![]()
with:
[3.19] ![]()
where ![]() the complex representation of the electromotive force per phase of the machine Lω, the synchronous reactance, and
the complex representation of the electromotive force per phase of the machine Lω, the synchronous reactance, and ![]() is the power angle of the machine. This expression emphasizes the fact that the amplitude of the electromotive force E is proportional to flux ψR due to the magnets and to the rotation speed Ω.
is the power angle of the machine. This expression emphasizes the fact that the amplitude of the electromotive force E is proportional to flux ψR due to the magnets and to the rotation speed Ω.
In introducing the synchronous impedance ![]() , like the wound rotor cylindrical machine, we obtain the equation:
, like the wound rotor cylindrical machine, we obtain the equation:
![]()
which can also be represented by the equivalent diagram per phase of Figure 3.3.
3.5.5.2. Determination of the flux generated by permanent magnets
The influence of the stator slots being neglected, it can be admitted that in the air-gap, the flux density is constant and equal to Be for the whole width ß of the magnet. The variation, along the air-gap, of this normal flux density is then given by Figure 3.26.
Figure 3.26. Approximate form of the normal induction in the air-gap

If this is restricted to the fundamental of its Fourier series, we get:
![]()
![]()
Ampere's theorem, applied to the closed circuit (c), (Figure 3.24) is written:
![]()
If the magnetic field is neglected in the iron, and if it is admitted that fields He in the air-gap and Ha in the magnets are constant, we can write:
[3.20] ![]()
where ha and e are respectively the thicknesses of the magnets and of the air-gap. When the magnets are held by a binding band, e has to be increased by the thickness ef of the binding band.
Flux densities Ba in the magnet and Be in the air-gap are linked to the fields by:
[3.21] 
BR and µa are respectively the remanence flux density and the magnet permeability. In the following we shall state that µa = µ0 . In neglecting the leakage flux, we can state that Ba and Be are equal. Equations [3.20] and [3.21] then lead to:
[3.22] 
Flux ψRA generated by the magnets and crossing phase A with Ns turns is then given by:
![]()
with:
![]()
Ri is the internal radius of the stator, and Lu is the useful length of the machine. This can be written:
![]()
The maximum value is therefore equal to:
![]()
Using equation [3.19], the rms value of the phase emf becomes:
![]()
3.5.5.3. Determination of the electromagnetic torque
The electromagnetic torque can be obtained from expression [3.17] where, considering the adopted hypotheses, only the hybrid torque plays a part. We have:

Using expression [3.18], a torque independent from time is obtained:
![]()
γ = (θ0 + φ) is the load angle.
3.6. Inverted AC generators
The excitation of large synchronous machines is often carried out by smaller AC generators with inverted structures (rotor armature and stator field system) fixed on the same shaft as the main AC generator. It is then possible to connect the armature winding of the secondary AC generator to the field winding of the main AC generator through a static rectifier, often called “rotating diodes” (Figure 3.27). This prevents the field current from flowing through slippery contacts (slip ring-brushes) which are not very convenient, particularly when the field current is important.
Figure 3.27. Rotor of a “rotating diode” exciter, 155 kVA, 74 V, 3,000 rpm. On the right hand side of the photograph the semi-conductor components are distinctly visible enabling the armature currents of the inverted AC generator (ECA EN document) to be rectified

3.7. Implementation of synchronous machines
The implementation of synchronous machines is very different depending on whether it is a motor or an AC generator; the analysis difficulties are also different.
AC generators usually work at a constant speed and supply networks with fixed voltages and frequencies. The problem to be solved is then to determine how to supply the network with the desired active and reactive powers using the adjustment parameters available: the field system current Ir and the drive turbine torque. In such conditions, the machine operates in sinusoidal state, but the difficulty of the study consists of the magnetic saturation phenomena.
Concerning the motor mode, the machine is usually a constituent of variable speed drives. In such conditions, it is essential to take into account the working of the static converters which generally supply the motor with non-sinusoidal currents. On the contrary, it is possible in an initial analysis to overlook the magnetic saturation phenomena.
Another working mode called “synchronous compensator” is also considered, for which the machine operates as a no-load motor (no mechanical charge) and supplies the network with reactive power only (Figure 3.6).
3.7.1. Implementation of synchronous motors
3.7.1.1. Synchronous motor supplied by a current commutator
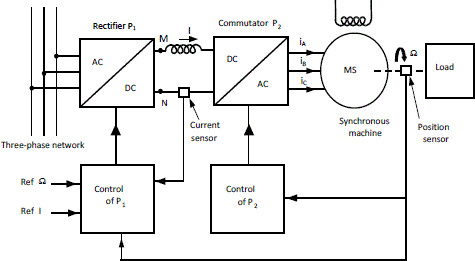
Historically, the first item designed with that aim was the association of two thyristor bridges. One of them, P1, supplied by the network, works as a rectifier and supplies the second one, P2. The latter works as an inverter and supplies the stator of the machine (Figure 3.28).
An inductance L inserted between P1 and P2 enables the reduction of the harmonics of rectified current I, which is assumed to be constant. It can therefore be stated in an initial analysis that according to the state of conduction of the P2 thyristors, the phases of the motor are supplied with currents of the values I, -I or zero. P2 is thus called the “current inverter”. The whole drive (thyristors bridges-synchronous motor) is often called a “self-synchronous controlled synchronous motor”.
In fact, this drive usually uses salient pole motors; however, we shall make an analytical study assuming that it is a cylindrical machine in account of the simplicity of the equations. Furthermore, the qualitative conclusions remain valid whichever type of machine is under consideration.
Figure 3.28. Self-synchronous controlled synchronous motor

3.7.1.1.1. Calculation of the instantaneous torque
The instantaneous torque of the synchronous machine is written as follows:
![]()
with:

Considering the machine supply mode (phase stator current equal to I, –I or 0), six different expressions for the instantaneous torque can be distinguished: ΓAB, ΓAC, ΓBC, ΓBA, ΓCA, and ΓCB, expressions in which, as a covenant, the first index indicates the phase where the current is worth +I, and the second index where the current is worth –I. Let us calculate, for example, ΓAC:

that is to say:
![]()
The other expressions of the instantaneous torque would be obtained in the same way:

Note that those elementary torques each have a sinusoidal expression in terms of θ, their average value is therefore zero (Figure 3.29).
Figure 3.29. Step by step operating

3.7.1.1.2. Step by step operating
Let us consider the six instantaneous torque sinusoids again. Let us assume for example that the machine has phases A and B supplied with IA = –I and IB = I, and that it is connected to a mechanical charge with a resistant torque ΓC (Figure 3.29). The rotor of the motor shall therefore position itself at position θ0 so that ΓBA = ΓC. If current I is commuted from phase B to phase C (to make the reasoning more convenient we shall assume an instantaneous commutation), the torque of the motor will become ΓCA. Since, in θ0, torque ΓCA is greater than ΓC, the motor will move until it reaches value θ1 for which ΓCA = ΓC, position where it shall stabilize again (after some oscillations). For each commutation, the machine makes an incremental movement Δθ or “step”. This device enables the use of the machine to make an incremental positioning of its charge, which is very interesting in various domains of electrical actuation.
For the positioning to be precise, it is important that Δθis small. Machines with specific structures are generally used, mainly with variable reluctance, the study of which is outside the scope of this book.
3.7.1.1.3. Self-synchronous behavior
The set “rectifier-inverter” is usually used to make the synchronous machine work at a variable speed in various industrial domains. In this case, current I is successively commuted from one phase of the machine to the next, which also makes the motor torque “switched” to be worth successively ΓBC, ΓBA, ΓCA, etc. (Figure 3.30).
If θj is the electrical angle, for which ΓBA becomes greater than ΓBC (Figure 3.30), it seems optimal to commute the current from one phase to the other for θ = θj + Kπ/3 (K ∈ N). However, in order to avoid the risk of commutation failure (see section 1.4.1.3.1), it is advisable to make these commutations with θC < θj. This leads to torque discontinuities that cannot be avoided, generating noises and vibrations.
Figure 3.30. Machine torque in self-synchronous state

In order to reduce those discontinuities, which are very damaging in some industrial applications (rail traction and naval propulsion, in particular), it is useful to increase the number of phases. The most basic structure is the “double-star” synchronous machine in which the stator has two 3-phase coils (A1, B1, C1 and A2, B2, C2) shifted in space by an electric angle equal to π/6 (Figure 3.31). Each coil is supplied by a current commutator (Figure 3.32). The torque ripples are thus considerably reduced.
Figure 3.31. Stator of the “double-star” synchronous machine

The structure of “double-star” motors supplied by current commutators was developed during the 1980s for rail traction, then extended to more considerable powers (several MW) for naval propulsion (Figure 3.33). For this latter application, the motors are often located outside the ship's hull in pods (Figures 3.34) used for both propelling and steering the ship. This device enables the simplification of motor maintenance.
Figure 3.32. Double-star machine supplied by current commutators

Figure 3.33. Cruise liner MSC Poesia, equipped with two inboard double-star synchronous motors driving the propellers through shafts. Each motor develops a power of 18 MW at around 170 rpm. These motors are supplied by current inverters (photograph Aker Yards Saint-Nazaire, Bernard Biger)

Figure 3.34. Motor in a pod fixed under the hull of a ship (photo source: Converteam)

3.7.1.1.4. Concentrated winding machines
It has already been seen (Chapter 2) that the machines with sinusoidal repartition of ampere-turns are particularly well suited to continuous energy conversion when the stator currents are sinusoidal. In such a case, they are much more interesting than those for which conductors are concentrated in a single slot per pole and per phase (machines that we had called “basic”). Remember that, for those machines, the stator-rotor mutual inductances have triangular variation (Figure 3.35a).
Let us consider the general expression of the instantaneous torque again:
![]()
with:

It is clearly visible that the triangular wave shape of the mutual inductances will lead to square waves for their derivatives (Figure 3.35b).
Figure 3.35. a) Stator-rotor mutual inductances of a “non-distributed” synchronous machine; b) derivative of the mutual inductance MAR; c) torque ΓAB; d) torque ΓAC

If the machine is supplied by a current commutator, the three stator current values are +I, 0 or –I, and we obtain, as previously, six possible expressions for the instantaneous torque:
![]()

Figures 3.35c and d emphasize the evolution of the two elementary torques ΓAB and ΓAC. It is noticeable that they have a “flat” maximum for a duration of 2π/3 electric and that these maxima overlap on a π/3 angle. If current –I is commuted from phase B to phase C during this overlap (for example, in θ = –π/2), the electromagnetic torque will remain constant. Thus it can be seen that, with a current distribution such as the representation in Figure 3.36, the torques Γi will be constant (taking into account the simplifying assumptions).
Figure 3.36. Currents iA, iB and iC and corresponding torques

This relatively simple example enables us to illustrate a fundamental point of present electrical engineering: it is no longer possible to optimize a machine without knowing how it shall be used, and generally it is the whole drive (static converter-rotating machine set) which has to be optimized.
3.7.1.1.5. Principle of self-synchronous control
We have just seen that the inverter current has to be commuted from one phase of the machine to the following phase with judiciously chosen values of the electrical angle θ, that is to say for particular positions of the rotor.
A position sensor is used with this aim: it provides the control device of the inverter bridge with the order of the commutation components, thus the name of “self-synchronous controlled synchronous machine” given to the whole drive (bridges-synchronous machine-control) (Figure 3.37).
Figure 3.37. General diagram of the self-synchronous machine control
It can be shown that the model of the set commutator P2– synchronous machine, observed between points M and N, is similar (in mean values and in stationary state) to a separated excitation DC machine. It has therefore been easy to transpose the methods of speed and current regulation. This device has quickly replaced the separated excitation DC machine from the 1970s.
The position sensor needed to control P2 also gives through derivation, the “speed” information at P1 control in charge of the current and speed regulation of the machine.
3.7.1.2. PWM inverter synchronous motor drive
The evolution of power electronics and the growth of the power of fully controllable switches allow to deal with the supply of high power synchronous motors (several megawatts) by PWM inverters (Figure 3.38). Without detailing the working of these converters, bear in mind that they enable to generate variable frequency stator currents with little harmonics (see section 1.3.5).
Figure 3.38. Structural diagram of a vectorial controlled synchronous machine
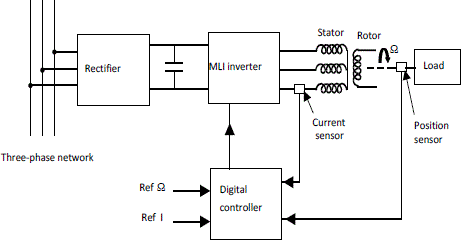
In a first approximation, those currents are therefore sinusoidal, and the motor turns at a speed proportional to their fundamental frequency; it produces a torque with a slight harmonic content.
This device, associated with digital controls (microprocessor, DSP, etc.), enabled the introduction of the vectorial command of synchronous machines. This command leans on a particular modeling of the machines in transient state (Park equations), which is beyond the scope of this book. Outstanding dynamic performance can thus be obtained. This device is now largely used in industry.
3.7.2. Implementation of the AC generators taking into account the saturation phenomena
In most cases, AC generators work connected to a network, which they have to supply with an active power P and a reactive power Q (Figure 3.39). With this end in view, it is possible to use two control parameters: the mechanical power supplied by the driving “motor” and the rotor excitation current IR (voltage V, frequency f, and therefore speed Ω imposed by the network). Those control parameters or “inputs” therefore have to be predetermined. This is very different depending on whether the magnetic saturation can be neglected or not.
Figure 3.39. “System” representation of an AC generator connected to a network

3.7.2.1. Analysis in a linear state
When saturation can be neglected, the solution is immediate because the approach developed in section 3.3 is valid. Indeed, if P and Q are fixed, the position of operating point M in the phasor diagram is undoubtedly defined. Electromotive force E is immediately deduced and therefore current IR to which E is proportional (Figure 3.5). In the same way, P' being known, the mechanical power and the torque needed are determined.
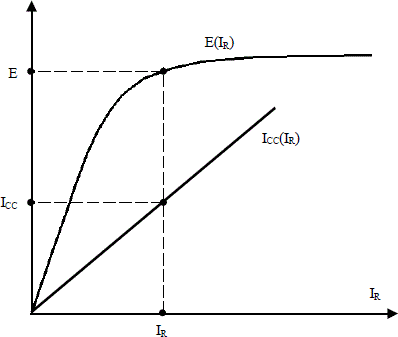
It is clear that, if the AC generator has to supply the network with active and reactive power (capacitive AC generator) the required value of E is linked to a very important field current IR. In that case the AC generator cannot be in linear state. Figure 3.40 shows that when the field current is great, the electromotive force E is no longer proportional to IR.
We shall therefore see how it is possible to take into account the saturation using a few physical considerations.
Figure 3.40. Characteristic E = f(IR) or “no-load curve” of a 10 MVA machine, 50 Hz, Un = 5 000 V (composed voltage), IN = 200 A, IRN = 50 A

3.7.2.2. Physical considerations about magnetic saturation
Magnetic saturation is a complex physics phenomenon linked with the non-linear behavior of ferromagnetic materials when they are excited by a magnetic field. The magnetic state of the machine then depends on the flux density in each point, and when it is important, there is no longer proportionality between the flux and the currents. Note that this flux density depends on the interaction of the whole of the fields and therefore on the rotor and stator currents.
The saturation in AC generators is taken into account using standard methods. In order to make these methods comprehensible we shall first point out some key phenomena. For that purpose we shall use field lines distribution and corresponding levels of flux densities. These are obtained by finite element computation.
3.7.2.2.1. Fields and inductances
In a ferromagnetic material, saturation is characterized by the fact that flux density B is not proportional to field H. For a synchronous machine working as a “no-load” AC generator (without any stator currents), this leads to the non-proportionality of the electromotive force E to IR (Figure 3.40). When the machine is on-load, its magnetic state depends on the whole of the ampere-turns distributed in it: the field generated by the field system and the field linked to the stator currents or “magnetic armature reaction field”. In the air-gap those two fields have amplitudes that can be described by sinusoidal progressive waves, and their phase shift depends on the operating point. Saturation therefore depends on various parameters, and particularly on IR, I and φ.
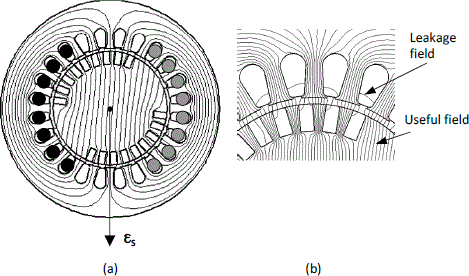
Let us consider, for example, the cylindrical 3-phase machine represented by Figure 3.41. It is bipolar and has 18 slots in the rotor and 24 slots in the stator. Each stator phase takes 4 “outward” slots and 4 “return” slots. Figure 3.41a shows the field lines in the machine during the no-load functioning, that is to say when only the field system is supplied by a current IR corresponding to the mmf εR. In the Figure, the “outward” conductors of the rotor coil are represented in a darker shade than the “return” conductors.
It is observed that all the field lines do not go through all the parts of the machine uniformly. Thus, in an initial approximation, they go through the stator teeth located in front of the rotor poles only, and when IR increases, those teeth are increasingly subject to saturation because the flux density becomes considerable there.
Figure 3.41b represents the local distribution of the flux density. It shows the parts of the machine likely to have the biggest magnetic saturation; they are the darkest parts. Note that those parts “move” with the rotor when it rotates.
Figure 3.41. No-load operating: a) field lines; b) flux density levels

Figure 3.42a represents the on-load field lines, that is to say when the stator and the rotor are fed. In this example, the position of the rotor is the same as in Figure 3.41, and it is assumed that the stator is supplied by a balanced 3-phase current system considered at one particular instant when iA = –iB = I and iC = 0. The “outward” stator conductors (represented in dark) are therefore located in 8 adjacent slots, and the “return” conductors (represented in a lighter shade) are located in 8 diametral slots. The corresponding mmf εS is shifted from mmf εR with load angle γ.
Figure 3.42b shows that the parts of the machine most subject to magnetic saturation (represented in a darker shade) do not exactly correspond to those of no-load operating. This saturation state, which varies with IR, therefore depends on the amplitude of stator current I and of its shifting φ in terms of the voltage.
Figure 3.42. On-load operating: a) field lines; b) flux density levels

Figure 3.43 shows the armature reaction field lines, that is when only the stator is power supplied. The rotor is in the same position as in Figures 3.41 and 3.42. In Figure 3.43b, which is a zoom-in on a part of the machine, the field linked to the “useful” flux can be distinguished from the field linked to the leakage flux. The field determining the “useful” flux goes through the air-gap and through the ferromagnetic material constituting the stator and the rotor whereas the field lines corresponding to the leakage flux do not cross the air-gap and are mainly localized in materials with permeability µ0 (slots, air-gap, end winding, etc.). It can therefore be admitted that leakage inductance l associated with the leakage flux is constant and does not depend on the magnetic saturation.
Figure 3.43. Armature reaction field: a) field lines; b) zoom-in
Synchronous inductance L is then broken up into two parts:
[3.23] ![]()
Inductance s corresponds to the “useful” flux and varies with the saturation state of the machine.
3.7.2.2.2. Resulting electromotive force
Considering the electrical equation [3.5] of the synchronous machine again and if [3.23] is taken into account, we can write:
![]()
that is to say:
[3.24] ![]()
with:
[3.25] ![]()
![]() σ is called the “resulting electromotive force” of the synchronous machine. It corresponds, for the stator phases, to the common flux coming from, on the one hand the field system, and on the other hand the armature currents. It is therefore representative of the overall saturation state of the machine.
σ is called the “resulting electromotive force” of the synchronous machine. It corresponds, for the stator phases, to the common flux coming from, on the one hand the field system, and on the other hand the armature currents. It is therefore representative of the overall saturation state of the machine.
When the machine is short-circuited (V = 0), there comes:
![]()
Since R is usually smaller than lω, we deduced that ![]() σ and
σ and ![]() cc are almost in quadrature. The flux generated by ICC is then in direct opposition to the field system flux linked to IR. The armature reaction is called “degaussing” and the resulting flux remains small. Characteristic Icc = f(IR) or “short-circuit characteristic” can be approximated by a straight line, even for high values of IR. In order to draw it, it is therefore possible to make one test only.
cc are almost in quadrature. The flux generated by ICC is then in direct opposition to the field system flux linked to IR. The armature reaction is called “degaussing” and the resulting flux remains small. Characteristic Icc = f(IR) or “short-circuit characteristic” can be approximated by a straight line, even for high values of IR. In order to draw it, it is therefore possible to make one test only.
These various considerations lead to the methods used to answer the following question: what value shall be given to IR in order to supply the network with an active power P and a reactive power Q (or, in the same way, set an armature current I with a phase φ)? Various methods exist in the literature, but we shall restrict ourselves to the two main ones: the Behn-Eschenburg method, which is the simplest to implement, and the Potier method, which is the more accurate.
3.7.2.3. The Behn-Eschenburg method
This method is quite elementary because it is based on large simplifying assumptions: the magnetic armature reaction is neglected, and the dipolar model of the machine is used assuming that E and L depend only on IR. Let us draw on the same figure (Figure 3.44) the no-load curve E(IR) and the short-circuit straight line Icc(IR).
Figure 3.44. No-load and short-circuit characteristics (same machine as Figure 3.40)
If one value of field system current Ir is given, the corresponding values of E and of ICC (associated with this value of IR) can be determined. The value of the impedance is then deduced:
![]()
In knowing the value of the stator resistance R, the phasor diagram can be drawn as follows (Figure 3.45). The stator current I is chosen as the phase origin and segment OA = RI is positioned. Point B, the intersection of the perpendicular to OA in A and of circle of centre O and of radius ZI, is then determined. Let us consider the straight line going through B and making the angle φ with the direction of I; the intersection of this line with the circle of centre O and the radius E gives the point M.
Vector ![]() =
= ![]() verifies the equation:
verifies the equation:
![]()
for the chosen value of current IR. The obtained value V therefore has a priori no reason for corresponding with the given voltage of the network.
Figure 3.45. Phasor diagram for the Behn-Eschenburg method
The process is taken again for another value of IR (bigger than the previous one if too small a value of V was obtained, or smaller if a larger value of V was obtained). It is then possible, through successive approximations, to come closer to the value of IR leading to the desired value of V.
The interest of the method mainly resides in its great experimental simplicity. Indeed it requires only the knowledge of the no-load curve and the implementation of a short-circuit test. However it shall be noted that, considering the simplifying hypotheses adopted, it is unrealistic to hope for a good precision through this method.
3.7.2.4. Potier method
3.7.2.4.1. Theoretical foundations
This method is based on the model introduced in section 3.7.2.2: breaking up synchronous inductance L in a saturable part s and a non-saturable part l, and introduction of a “resulting electromotive force” Eσ.
Modification of the sign covenant: in order to find the standard Potier method again, we shall, for this section, leave the “motor” covenant to take the “AC generator” covenant of the synchronous machine. This consists of changing I into –I in the equations. Equations [3.24] and [3.25] become:
[3.26] ![]()
[3.27] ![]()
where λ = lω is the leakage reactance.
Equation [3.27] highlights that the resulting electromotive force comes from the superposing of excitation ampere-turns and of armature reaction. We can set down:
![]()
This value has no size and is called “ampere-turns equivalence coefficient”. It implies that μI amperes in the field system generate the same flux as a current I in the armature.
We can then set down:
[3.28] ![]()
[3.29] ![]()
These two equations amount to the consideration that the resulting electromotive force ![]() σ is produced by a resulting field system current Iσ which is the result of the superposing of current IR and of an “equivalent” armature current
σ is produced by a resulting field system current Iσ which is the result of the superposing of current IR and of an “equivalent” armature current ![]() .
.
If equation [3.29] is put together with expression [3.6], it is evident that the magnitude dependence from Eσ to Iσ is the same as from E to IR, coefficient M being representative of the saturation state of the machine. The “no-load curve” shall therefore be, at the same time, the image of E = f(IR) and of Eσ = f(Iσ).
3.7.2.4.2. Potier diagram
Let us assume the “Potier coefficients” (µ and λ = lω), the resistance R and the no-load curve of the machine are known; equations [3.26] to [3.29] enable us to solve the formulated problem: if V, I and φ are given, the resulting electromotive force can be deduced from:
[3.26] ![]()
where V, assumed constant, will be considered as a real number taken as the phase origin (Figure 3.46). It is then easy, in referring to the no-load curve, to obtain the value of the “resulting” current Iσ. We can then draw, on the same diagram, a “triangle of the currents” representative of equation [3.28].
In this vectorial diagram, the position of ![]() is defined in quadrature with
is defined in quadrature with ![]() . The value of the sought excitation current
. The value of the sought excitation current ![]() is thus obtained. Sometimes the figure is drawn by rotating the “triangle of the currents” by(–π/2). Current Iφ is then in the same direction as Eφ and µI is perpendicular to I.
is thus obtained. Sometimes the figure is drawn by rotating the “triangle of the currents” by(–π/2). Current Iφ is then in the same direction as Eφ and µI is perpendicular to I.
3.7.2.4.3. Determining the Potier coefficients
The geometrical construction of Figure 3.46 assumes that λ and µ are known. These two coefficients are considered to be constant for a given machine. In order to determine them, let us examine what the diagram becomes for reactive currents, that is to say when φ = π/2 (Figure 3.47).
Figure 3.46. Potier diagram

Figure 3.47. Potier diagram for φ=π/2

Since R is usually very small, it can be stated that V , λ![]() and Eσ are collinear and therefore
and Eσ are collinear and therefore ![]() ,
, ![]() and
and ![]() are collinear too, and orthogonal to the former, hence the two algebraic equations:
are collinear too, and orthogonal to the former, hence the two algebraic equations:
![]()
The coefficients λ and µ can be deduced from these two equations: let us draw on the same diagram the no-load curve Eσ = f(Iσ) and the “constant current of power factor zero” (p.f.z.) curve V = f(IR), drawn for the desired value of I (Figure 3.48). It can be considered that one point M on the “p.f.z.” curve is related to one homologous point M0 on the no-load curve through a translation (– µI in the direction of the currents and λI in the direction of the voltages). If M and M0 were known, λ and µ: would be deduced immediately. If these two points are a priori unknown, M0 can be deduced from M according to the following considerations.
If the Potier coefficients are assumed to be constant, any point on the p.f.z. curve is related to its homologue on the air-gap curve through the same translation. This is therefore true for point P corresponding to V = 0 and its correspondent P0 (Figure 3.48). Since P corresponds to a working short-circuit, the machine is not saturated at this point and P0 is therefore located on the linear part of the air-gap curve. This consideration enables us to determine M0, because we can be consider that triangle POP0 translates itself in the plane. So, if we set MO' = PO and at the point O', we draw the parallel to OP0, this straight line crosses the air-gap curve at M0. In drawing M0 the perpendicular to O'M, we get HM0 = λI and HM = µI, which determine λ and µ.
Note that, since this determination is unique, there is no need to draw the whole curve; a single p.f.z. current point and the short-circuit point are enough.
Figure 3.48. air-gap and p.f.z. characteristics

3.8. Experimental determination of the parameters
The performances and characteristics of synchronous machines can be predetermined using the equivalent diagrams and the diagrams drawn above. This assumes, for a given machine, the knowledge of the parameters numerical values.
Depending on the case, we proceed as follows.
3.8.1. Cylindrical machine in linear state
It is a matter of identifying the parameters of the equivalent diagram in Figure 3.3. Resistance R is measured with a hot machine with DC current (nominal value) through an “ammeter-voltmeter” method. The value of reactance Lω is obtained from the air-gap curve in its linear part and a short-circuit test with a field system current value of IRCC corresponding to a supportable value (for example, the nominal value) of the armature current I.
We then obtain:
![]()
and then we deduce ![]() .
.
3.8.2. Saturation of the cylindrical machine
It is also necessary to draw the no-load curve E = f(IR) and to make a short-circuit test. Those two tests are enough to use the Behn-Eschenburg method (see section 3.7.2.3).
In order to use the Potier method, it is necessary to obtain a point with p.f.z. current. In order to do so, it is possible to load the machine on a supposedly perfect 3–phase inductance, and to measure the phase voltage and current as well as the field current.
3.8.3. Salient poles machine
In order to determine reactances Xd and Xq, the “slip test” is used. The stator is supplied by a reduced value balanced 3–phase voltage system, with rms value V. The rotor, in open circuit, is driven in the direction of the stator field at a speed very close to the synchronous speed in order to reduce the effect of the damping windings.
During this test, when the stator mmf axis coincides with the rotor axis d, the reluctance met by the stator flux is at a minimum. This reluctance is maximum when those axes are in quadrature (position q). The current is therefore minimum in position d and maximum in position q (Figure 3.49). The variation of stator current i(t) is then recorded, the extreme values Imin and Imax are obtained and the direct and quadrature reactances are deduced:
![]()
Let us point out that during the short-circuit test the load angle is almost zero, which corresponds to position d. It is then preferred to determine Xd using the Behn-Eschenburg method (see section 3.7.2.3). Reactance Xq is then deduced in a more accurate way by:
![]()
Figure 3.49. Variation of the stator current: slip method
