
![]()
14
Working with SmartArt
In This Chapter
![]() Looking at the SmartArt feature
Looking at the SmartArt feature
![]() Creating diagrams using SmartArt
Creating diagrams using SmartArt
![]() Creating organization charts
Creating organization charts
You’ll hear nothing but yawns from the back row if your presentation consists of slide after slide of text and bulleted lists with an occasional bit of clip art thrown in for good measure. Mercifully, PowerPoint is well equipped to add all sorts of embellishments to your slides. This chapter shows you how to work with one of the coolest ways to embellish your slides — adding special diagrams called SmartArt.
Understanding SmartArt
PowerPoint includes a nifty little feature called SmartArt, which lets you add several different types of useful diagrams to your slides. With SmartArt, you can create List, Process, Cycle, Hierarchy, Relationship, Matrix, Pyramid, and Picture diagrams. And each of these basic diagram types has multiple variations. In all, you can choose from 185 variations.
The diagrams created by SmartArt consist of multiple elements, such as shapes and lines. SmartArt itself takes care of drawing these elements in a coordinated fashion, so you don’t have to draw the separate elements manually.
The basic idea behind SmartArt diagrams is to represent bullet lists as a diagram of interconnected shapes. Although many different types of SmartArt diagrams are available, they all work the same way. The only real difference among the various SmartArt diagram types is how they graphically represent the bullets. For example, consider the following bullet list:
![]() Arrive
Arrive
![]() Work
Work
![]() Lunch
Lunch
![]() More work
More work
![]() Leave
Leave
Figure 14-1 shows this list represented by a SmartArt diagram. All I did to create this diagram was select the text, right-click, and choose Convert to SmartArt, and then select the Descending Process SmartArt diagram type.

Figure 14-1: A simple SmartArt diagram.
Note that many of the SmartArt diagram types can display two or more outline levels in your bullet list. For example, suppose you have this list:
![]() Arrive
Arrive
• Stop for coffee on the way
• Try not to be late
![]() Work
Work
• Coffee break at 10:00
• Look smart!
![]() Lunch
Lunch
• Best part of the day!
• No more than 90 minutes
![]() More work
More work
• Coffee break at 2:00
• Try to stay awake at 4:00
![]() Leave
Leave
• Leave early today?
Figure 14-2 shows how this list appears when formatted as an Increasing Arrows Process chart. As you can see, the second-level bullets are incorporated as text within the diagram.
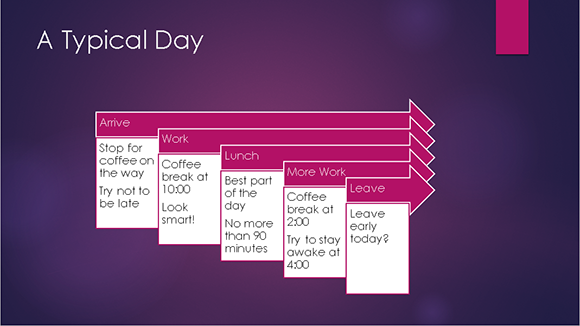
Figure 14-2: How second-level text is displayed in an Increasing Arrows Process chart.
One of the most useful aspects of SmartArt is that you can easily change from one type of diagram to another. Thus, if you decide that a diagram doesn’t convey the message you intend, you can try changing the diagram type to see whether the message is clearer.
Creating a SmartArt Diagram
The easiest way to create a SmartArt diagram is to create a new slide and enter the bullet list as if you were going to display the list as normal text and then convert the text to SmartArt. Just follow these steps:
1. Create a new slide with the Title and Content layout.
2. Type your bullet list.
Use one or two levels of bullets, but try to keep the list as short and concise as you can.
3. Right-click anywhere in the list and choose Convert to SmartArt.
A menu of SmartArt diagram types appears, as shown in Figure 14-3.
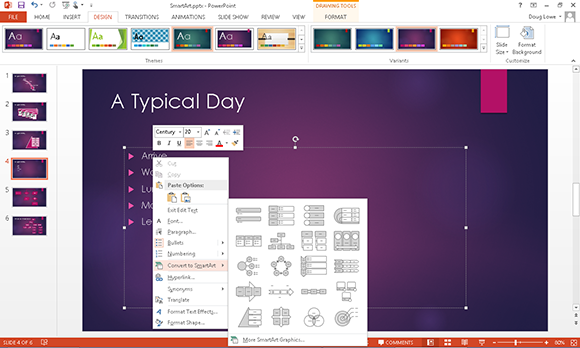
Figure 14-3: Converting text to SmartArt.
4. Select the SmartArt type you want to use.
If the SmartArt type doesn’t appear in the menu, you can choose More SmartArt Graphics to display the Choose a SmartArt Graphic dialog box, as shown in Figure 14-4. As you can see, this dialog box lets you choose from about a million different SmartArt diagram types. PowerPoint offers eight basic categories of SmartArt diagrams; these diagram types are pictured and described in Table 14-1.

Figure 14-4: The Choose a SmartArt Graphic dialog box.
5. Click OK.
The diagram is created.
6. Modify the diagram however you see fit.
For more information, see the section “Tweaking a SmartArt Diagram,” later in this chapter.
7. You’re done!
Well, you’re never really done. You can keep tweaking your diagram until the end of time to get it perfect. But at some point, you have to say, “Enough is enough,” and call it finished.

Tweaking a SmartArt Diagram
After you’ve created a SmartArt diagram, you can adjust its appearance in many ways. The easiest is to change the SmartArt Style that’s applied to the diagram. A SmartArt Style is simply a collection of formatting elements such as colors and shape effects that are assigned to the various elements of a SmartArt diagram.
Microsoft provides a large assortment of SmartArt styles to choose from. For example, Figure 14-5 shows the style gallery for Pyramid diagrams.
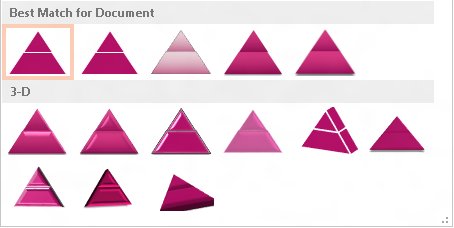
Figure 14-5: The SmartArt Style Gallery for pyramid diagrams.
To change the quick style for a SmartArt diagram, follow these steps:
1. Click the diagram to select it.
Doing this adds the SmartArt tools to the Ribbon.
2. Click the Design tab.
Figure 14-6 depicts the SmartArt Tools Design tab.

Figure 14-6: The SmartArt Tools Design tab.
3. Select the style you want to use from the SmartArt Styles group.
The Quick Styles group displays the most commonly used styles for the diagram type. If the style you want to use isn’t visible in this group, you can click the More button to display a gallery like the one shown in Figure 14-5.
Note that the SmartArt Tools Design tab also includes controls that let you modify the SmartArt diagram by adding additional shapes or bullet items or changing the chart type. You can also reset the diagram to its original appearance by clicking the Reset Graphic button found in the Reset group.
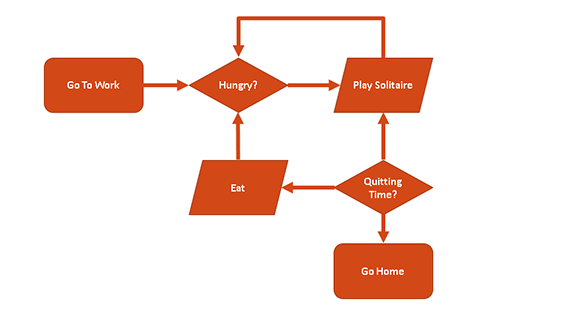
Flowcharts, anyone?
One type of diagram that people often want to create with PowerPoint is a flowchart. Although SmartArt doesn’t have an option for creating flowcharts, you can easily create flowcharts by using PowerPoint’s AutoShapes. For example, take a look at the following flowchart, which I created with just a few minutes’ work.
To create a flowchart like this, follow these basic steps:
1. Draw each flowchart shape by using basic shape objects as described in Chapter 12.
Use the shapes in the Flowchart section of the Shapes gallery to create the shapes for the flowchart, and use arrows to connect the shapes.
2. Enter text into each flowchart shape by clicking the shape and typing.
If necessary, adjust the text font and size.
3. Adjust the alignment of your shapes.
Here’s where the flowcharting AutoShapes really shine: The connectors stay attached to the shapes even when you move the shapes around! Pretty slick, eh?
Editing the SmartArt Text
When you create a SmartArt diagram from an existing bullet list, the bullet text is replaced by the diagram. After you’ve converted the text to SmartArt, what do you do if you need to modify the text?
To modify SmartArt text, simply select the SmartArt diagram. Then click the little double-arrow icon that appears on the left edge of the diagram’s selection box. This action reveals a fly-out window called the Text pane, in which you can edit the bullet points. See Figure 14-7.
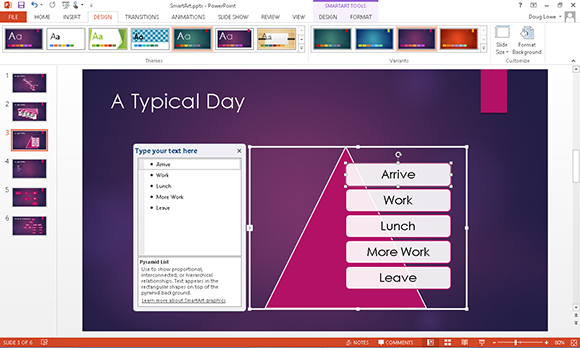
Figure 14-7: Editing SmartArt bullet text.
Working with Organization Charts
Organization charts — you know, those box-and-line charts that show who reports to whom, where the buck stops, and who got the lateral arabesque — are an essential part of many presentations.
The hierarchical SmartArt diagrams are ideal for creating organization charts. You can create diagrams that show bosses, subordinates, co-workers, and assistants. You can easily rearrange the chain of command, add new boxes or delete boxes, and apply fancy 3-D effects. Figure 14-8 shows a finished organization chart.
The bullet list I used to create this chart looked like this before I converted it to SmartArt:
![]() Doc
Doc
• Sneezy
• Grumpy
• Sleepy
• Happy
• Bashful
Notice that Dopey isn’t in this list. That’s because Dopey is in a special kind of box on the chart, called an Assistant. You find out how to add Assistant boxes later in this chapter.
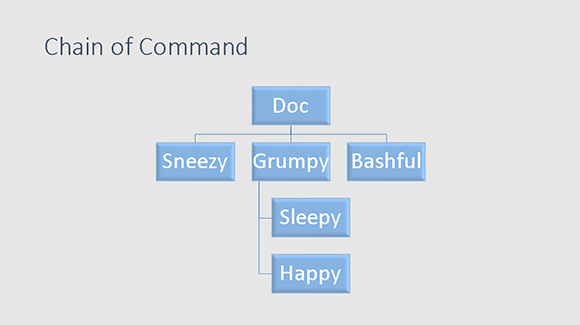
Figure 14-8: A finished organization chart.
 Keep in mind that organization charts are useful for more than showing employee relationships. You also can use them to show any kind of hierarchical structure. For example, back when I wrote computer programs for a living, I used organization charts to plan the structure of my computer programs. They’re also great for recording family genealogies, although they don’t have any way to indicate that Aunt Milly hasn’t spoken to Aunt Beatrice in 30 years.
Adding boxes to a chart
You can add a box to an organization chart by calling up the Text pane and editing the text. Refer to the section “Editing the SmartArt Text,” earlier in this chapter, for tips on how to do that.
Alternatively, you can use the controls in the SmartArt Tools tab on the Ribbon to add boxes. One nice feature that these controls provide is the capability to add an Assistant, which is a box that appears outside of the hierarchical chain of command. Here are the steps:
1. Click the box you want the new box to be below or next to.
2. Open the SmartArt Tools tab on the Ribbon.
3. Click the Add Shape button to reveal a menu of choices. Then select one of the following options:
• Add Shape Before: Inserts a new box at the same level as the selected box, immediately to its left.
• Add Shape After: Inserts a new box at the same level as the selected box, immediately to its right.
• Add Shape Above: Inserts a new box above the selected box.
• Add Shape Below: Inserts a new box beneath the selected box.
• Add Assistant: Inserts a new box beneath the selected box, but the new box is connected with a special elbow connector to indicate that the box is an Assistant, not a subordinate.
4. Click the new box and then type whatever text you want to appear in the box.
5. If necessary, drag the box to adjust its location.
Deleting chart boxes
To delete a box from an organization chart, select the box and press Delete. PowerPoint automatically adjusts the chart to compensate for the lost box.
When you delete a box from an organization chart, you should observe a moment of somber silence — or throw a party. It all depends on whose name was in the box, I suppose.
Changing the chart layout
PowerPoint lets you choose from four methods of arranging subordinates in an organization chart branch:
![]() Standard: Subordinate shapes are placed at the same level beneath the superior shape.
Standard: Subordinate shapes are placed at the same level beneath the superior shape.
![]() Both Hanging: Subordinates are placed two per level beneath the superior with the connecting line between them.
Both Hanging: Subordinates are placed two per level beneath the superior with the connecting line between them.
![]() Left Hanging: Subordinates are stacked vertically beneath the superior, to the left of the connecting line.
Left Hanging: Subordinates are stacked vertically beneath the superior, to the left of the connecting line.
![]() Right Hanging: Subordinates are stacked vertically beneath the superior, to the right of the connecting line.
Right Hanging: Subordinates are stacked vertically beneath the superior, to the right of the connecting line.
Figure 14-9 shows an organization chart that uses all four of these layouts. Sneezy, Grumpy, and Bashful use Standard layout. Sleepy and Happy use Both Hanging layout. Groucho, Harpo, and Chico use Left Hanging layout, and Manny, Moe, and Jack use Right Hanging layout.

Figure 14-9: An organization chart that uses all four layout types.
To change the layout of a branch of your chart, first click the shape at the top of the branch, and then click the SmartArt Tools Design tab on the Ribbon. Then click the Layout button in the Create Graphic group and choose the layout type you want to use.