
Permanent installation of wireless structural monitoring systems in infrastructure systems
C.A. Peckens, M.B. Kane, Y. Zhang and J.P. Lynch, University of Michigan, USA
Abstract:
Over the last several decades, wireless sensing technologies have arisen as an inexpensive and robust method of data collection, used in a variety of structural monitoring applications for various types of infrastructure systems. In comparison with their natural counterparts (i.e., cabled monitoring systems), wireless monitoring systems offer low-cost and low-power communication between a large number of sensing devices. However, successful implementation of such technologies is highly dependent on several factors, such as constant power supply, reliable communication, and dependable data collection strategies. These can often be challenging to achieve in real-world applications, due to harsh environmental conditions and overall limitations of the current technology. While numerous studies have effectively overcome such challenges in a variety of infrastructure systems, bridges have had numerous successful deployments of wireless sensor networks. As such, this chapter focuses on four particular cases that demonstrate successful long-term deployment of wireless sensor networks on bridges for structural monitoring purposes.
Key words
structural monitoring; bridge applications; wireless sensors
17.1 Introduction
Critical infrastructure systems (e.g., bridges, pipelines, roads, buildings) are vital to the economic success of today’s society. However, such structures are extremely susceptible to degradation and deterioration due to aging effects or extreme loading scenarios, such as earthquakes or high wind loads. Additionally, due to their extensive daily use, the condition of many infrastructure systems in developed nations such as the United States is dire. For example, 26% of all bridges in the United States have been reported as structurally deficient or functionally obsolete in 2003 by the Federal Highway Administration.1 Current federal law mandates that all bridges be visually inspected on a bi-annual basis, but these inspections can be extremely subjective in nature, very costly, and largely insufficient, as the majority of structural defects often lie beneath the surface of the structure.2 Other infrastructure systems face similar challenges. Therefore, alternative methods of accurately assessing a structure’s integrity and detecting key problem areas are needed.
Recently, numerous civil engineering structures across the world have been instrumented with long-term wired monitoring systems, thus allowing for real-time data collection.3 While offering reliable communications and accurate data collection, wired monitoring systems can be time consuming to install. Additionally, such systems are often extremely expensive, with one sensing node costing several thousand dollars.4 As a result, due to financial constraints, such monitoring systems often lack high spatial density of sensors across the networks. This has motivated the structural monitoring community to seek alternative methods to traditional wired systems that would allow for a dense deployment of sensors with greater affordability. Wireless sensing technology has risen as one possibility, thus replacing the coaxial cables of wired systems with wireless communication at a fraction of the installation cost. See Chapter 16 for a full overview of wireless sensor technologies as they relate to civil infrastructure.
Since its initial proposal in 1998,5 the utilization of wireless sensor networks (WSNs) has become increasingly popular for both academic and commercial use, with a particular emphasis on bridge monitoring applications.6,7 Deploying wireless sensors on bridges presents its own unique challenges for the sensor community. Careful consideration must be given to specific factors before any installation can occur, such as power supplies and the reliability of wireless communication, given current environmental conditions. While the removal of cables relieves much of the manual labor required for installation of monitoring systems, it also eliminates a reliable power source. As a result, WSNs must rely on batteries or other non-traditional energy sources as their primary source of power. If not carefully considered, this factor may severely inhibit the longevity of the overall network. Additionally, in eliminating cables as the avenue for data transmission, WSNs must be able to develop reliable communication at long distances in order to truly be applicable for most monitoring applications. However, such reliability is often achieved at the expense of increased power consumption. Therefore, by removing the cables, successful deployments of WSNs now depend on a careful balance between power constraints and communication ranges. Additionally, such monitoring systems on bridges are highly exposed to harsh environmental conditions, such as wind, snow, and rain. Before any deployment of a WSN, these factors must be considered and extra precautions must be taken to protect system components without inhibiting communication range or the ability to perform data acquisition tasks.
While wireless sensing technologies have emerged as a viable alternative to the traditional tethered systems for civil infrastructure systems, they have many challenges that must be addressed to be useful in real-world applications. This chapter covers four major deployments of WSNs on long-span bridges using various wireless sensing systems. Each case study carefully addresses the aforementioned technical challenges of WSN. This chapter focuses on bridges largely because wireless sensors have seen greatest use in these infrastructure system types. However, the lessons learned from these studies can be generalized for any large, complex infrastructure system. This chapter is not intended to be an exhaustive review of WSNs deployed on bridge systems; rather, a select number of field validation studies offering the most valuable lessons learned have been selected for illustrative purposes. The first case study is the Golden Gate Bridge, where a short-term WSN was installed for monitoring purposes. The remaining three case studies are the Stork Bridge, the Jindo Bridge, and the New Carquinez Bridge, which are all permanent, long-term system deployments.
17.2 Case study I – The Golden Gate Bridge, San Francisco, California, USA
One of the first full-scale deployments of a WSN on a long-span bridge was conducted by Pakzad et al.8 on the Golden Gate Bridge, in San Francisco, California, USA (Fig. 17.1). The WSN was deployed on 14 July 2006, and the study lasted for approximately two months on the bridge, before removal on 22 September 2006. The Golden Gate Bridge was chosen for the wireless sensor system because Abdel-Ghaffer and Scanlan9,10 had conducted previous studies on this bridge with tethered data acquisition systems, thus allowing for a comparison between the wired and wireless systems. Completed in 1937, the steel suspension bridge has a main span of 1280 m and two side spans of 343 m. Additionally, two towers separate the main span from each side span, each rising 210 m above sea level.

During the study, 64 wireless sensing nodes were deployed across the bridge (Fig. 17.2), with 56 nodes on the main span measuring transverse and vertical acceleration, and eight nodes on the east tower measuring transverse and longitudinal acceleration. Of the 56 nodes on the main span, 53 were deployed on the west side of the bridge deck during the primary installation phase, and three were deployed on the east side of the bridge deck during a second installation phase. Due to communication constraints, the units were typically placed 30 m apart but in the presence of obstructions this distance was limited to 15 m.
17.2.1 Wireless sensing unit
The MICAz mote11 was chosen as the wireless sensing node in this study, due to its open source operating system, TinyOS, as well as its reliable communication protocol. The mote operates on the Atmel AVR ATMega128L microprocessor with 512 kB FLASH memory, thereby enabling storage of approximately 250 000 two-byte (16-bit) values prior to data transmission. For data collection, the MICAz interfaces with an external sensor board that monitors four channels of acceleration, as well as one temperature channel. The board uses two types of accelerometers: a high level sensor, Analog Device ADXL202, with a measurement range of ± 2 g and a noise floor of 1 mg at 25 Hz, and a high sensitivity sensor, Silicon Design 1221 L, with a scaled measurement range of ± 0.1 g, and noise floor of 10 μg. Each accelerometer channel is equipped with an on-board anti-aliasing filter with a cut-off frequency of 25 Hz, which prefaces a 16-bit analog-to-digital converter (ADC). For data transmission, the MICAz mote interfaces with a 2.4 GHz IEEE 802.15.4 compliant radio transceiver, thus providing reliable in-field communication for distances up to 30 m.
Power is of particular concern for the deployment of wireless sensing networks, and therefore the consumption of each component should be care-fully considered. During a preliminary analysis of the sensing node, Kim et al.12 found that the sensor board, including the accelerometers, anti-aliasing filters, and ADC, has a power draw of 240 mW when using a 9 V power source. This is over twice the draw of the MICAz, which draws 118 mW at the same power source in its idle state. However, when operating as a combined unit and performing routine tasks, the entire sensing node draws a maximum of 672 mW at 9 V. Through this brief study, it was acknowledged that more sophisticated methods of power management, such as implementing sleep modes for components, was required for full-scale implementation of wireless sensing networks during long-term or permanent installations.
17.2.2 Communication scheme
While wireless communication is one of the greatest benefits of these new sensor networks, it also poses one of the greatest challenges, due to limited radio bandwidths and short communication ranges. The nodes used in this study have a maximum communication range of 30 m, which is significantly less than the total length of the bridge. Therefore, some units were not able to communicate directly with the base station and alternative methods had to be employed. As a result, the WSN relied on the use of a multi-hop communication scheme whereby data is transferred from distant nodes to the base station through the use of intermediary nodes. While hopping enables communication between all nodes and the base station, it does pose additional constraints to the network design, because each node must find a reliable path that allows for data transfer to the base station, without over-lapping the transmission from another unit. Additionally, the unit must be able to dynamically adapt its path in the event that one of its intermediary nodes falls out of the network or exhibits poor reliability.
For the deployment of sensor nodes on the Golden Gate Bridge, Pakzad et al.8 made use of pipelining, first proposed by Kim et al.12 to optimize the communication bandwidth across the multi-hop network. In pipelining, the network organizes data transmission such that several nodes can simultaneously transmit data across the network without interference. In this way, the overall network is able to communicate higher rates of data and the effective bandwidth of radio communication is increased. Even with this method there is a risk of packet loss or radio interference. A balance between the number of hops permitted within the network and the amount of data lost due to interference must be found. For the Golden Gate Bridge network, Pakzad et al.8 found that using five hops between transmitting nodes resulted in reliable data transmission rates of 550 bytes/s, with packet loss rates of 2.5% or lower, which was adequate for their sensing requirements.
In conjunction with multi-hop communication, Pakzad et al.8 also made use of the Scalable Thin and Rapid Amassment Without Loss (STRAW) protocol, first proposed by Kim et al.12 to regulate reliable communication across the network. STRAW is a negative-acknowledgment (NACK) collection protocol, in which the receiver always initiates data collection from the network nodes. Once data transfer has started, the receiver tracks the received packets from each node and sends a list of missed packets to the sender. Based on this list, the sender then retransmits any missed packets. Communication continues between the node and the receiver until all data have been received by the receiver. In this way, reliable communication can be achieved, even with the added risk of multi-hop communication.
The final factor that can prohibit successful communication and data collection in WSNs is time synchronization. To maximize the information that can be extracted from the network, it is important that all units in the network are synchronized. In a single-hop network units can easily be aligned, because each unit can receive a beacon directly from the base station. For a multi-hop network, however, all units cannot communicate with the base station and therefore, delays will be introduced in the network as intermediary nodes relay messages. To overcome this, Pakzad et al.8 employed the Flooding Time Synchronization Protocol (FTSP) first proposed by Maroti et al.13 and readily available in TinyOS. In FTSP, a global timestamp is passed across the network through a series of handshakes until all units are on the same ‘time zone,’ and hence time synchronized.
17.2.3 Field deployment
Pakzad et al.8 deployed their wireless sensing network on 14 July 2006. Each unit was bonded to the bridge with temporary connections, such as c-clamps, zip ties, and duct tape, all of which proved to be adequate for the two month testing scheme (Fig. 17.3). Once the network was installed, vibration time histories were collected at a 50 Hz sampling frequency for 1600 s, resulting in 20 MB of data collected across the entire network. Using the multi-hop communication scheme, it took approximately 9 h to collect data from the entire network. Once data were collected, it was used in an off-line analysis to estimate the modal properties of the Golden Gate Bridge. Through the analysis, it was demonstrated that as more nodes were included in the analysis, higher order modes could be identified with greater accuracy, thereby validating the need for dense networks of sensing nodes on complex civil infrastructure systems.

17.2.4 Case study conclusions
This deployment on the Golden Gate Bridge marked the first successful large-scale deployment of WSNs on a long-span bridge. Through the study, Pakzad et al.8 validated multi-hop communication with the use of pipelining and time synchronization techniques. As such, networks of sensing nodes were not limited to the communication ranges of their radios, but instead could scale according to the requirements of the structure. Additionally, Pakzad et al.8 successfully executed off-line modal analysis, thereby demon-strating the need for dense sensor networks. Thus, the study on the Golden Gate Bridge addressed some of the initial concerns of deploying WSNs on civil infrastructure and presented future areas for exploration.
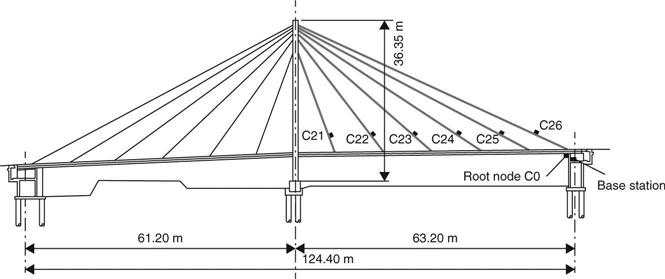
17.3 Case study II – The Stork Bridge, Winterthur, Switzerland
Shortly following the study on the Golden Gate Bridge, Feltrin et al.14–16 installed a wireless sensing network on the Stork Bridge (Fig. 17.4), a cable-stay bridge located in Winterthur, Switzerland.14–16 Built in 1996, the Stork Bridge was the first carbon-fiber cable-stayed bridge in the world. Comprising two spans, one 63 m in length and the other 61 m in length, the Stork Bridge has 24 cables, of which two are carbon fiber and the remainder are traditional steel tendon. WSNs are ideal for data acquisition on cable-stayed bridges, due to their ease of application thereby enabling rapid deployment. On 16 January 2007, Feltrin et al.14 deployed six wireless sensors on the cables of the Stork Bridge (Figs 17.5 and 17.6) for a long-term study that has continued to the time of this book’s publication.


17.3.1 Wireless sensing unit
Due to its low-power consumption, the commercially available Tmote Sky wireless sensing unit was chosen for this study.17 The Tmote Sky uses the low-power 16-bit Texas Instruments microprocessor, MSP430F1611, which provides 10 kB of RAM and 48 kB of FLASH memory, while running the TinyOS operating system. The mote interfaces with a 2.4 GHz IEEE 802.15.4 Chipcon wireless transceiver, thereby enabling radio communication for distances of 30–40 m. The Tmote Sky is equipped with eight 12-bit ADC channels, each with a maximum sampling frequency of 200 Hz, thus allowing a variety of sensors (e.g., accelerometers, strain gages) to be integrated into the data acquisition system. For this study, Feltrin et al.14 used one ST Microelectronics LIS2L06 MEMS accelerometer per mote, with a measurement range of ± 2 g, sensitivity of 0.6 V/g and a noise floor of 0.2 mg with a 50 Hz bandwidth. Each analog signal was pre-processed with a low-pass filter having a cut-off frequency of 20 Hz and a low-power signal amplifier. Additionally, the ambient temperature and air humidity were also measured using the Sensirion SHT11 chip. The entire system was packaged in a durable aluminum box, thus protecting it from the harsh outdoor environment (Fig. 17.7).

Throughout the study, the system designers were cognizant of the over-all power consumption of the network, and therefore carefully chose each component of the wireless sensing unit according to this constraint. The Tmote Sky consumes 5.4 mW of power in idle mode and 65 mW in full operational mode (at a 3 V referenced power source). Additionally, the signal processing board and accelerometer draw 5 mW of power, while the temperature and humidity sensor consumes 0.5 mW of power. Once the network was deployed, Feltrin et al.14 continually modified the network so as to minimize the energy consumption of the network. They found that by decreasing the duty cycle of the radio (i.e., the time that the radio is on – for example, a 40% duty cycle corresponds to the radio being on for 40% of the time) they could significantly increase the battery life of their system (see Table 17.1).
17.3.2 Communication scheme
Due to the geometry of the bridge, as well as the availability of a stable AC power supply, the root node, which communicates information between the base station and all other wireless sensor nodes, was installed on the abutment underneath the bridge deck. This location offered no line-of-sight connection with the other wireless sensor nodes. Therefore, the wireless link between the root node and the sensor nodes on the cable-stays was established through reflectivity, thus reducing the overall communication range. As a result, the two sensor nodes that were closest to the mid-span could not directly communicate with the root node, thereby requiring a multi-hop communication scheme. Because there were only six nodes in the network, these two nodes could communicate with the root node by employing one additional hop of the data to any of the four other nodes. These nodes periodically assessed their link quality with adjacent nodes and chose the most reliable one for the hopped transmission. Similar to the Golden Gate Bridge case study, due to the multi-hop communication time synchronization was a concern across the network and a method similar to FTSP was employed. The root node transmitted a global timestamp every 30 s and, upon receiving the timestamp, a sensor node rebroadcast the message. This process continued until the entire network had received the global timestamp and each sensor had updated its local clock.
17.3.3 Data management
In terms of power consumption, WSNs, in general, consume less energy through data processing, as opposed to data transmission.18 One large benefit of wireless sensing nodes is that they are capable of performing local computations and, as a result, can transmit small bandwidths of processed data, as opposed to large bandwidths of raw data, thus saving radio transmission time. Cable-stay bridges are ideal for localized data processing, as forces in the cables are often monitored through natural frequency estimations that can be extracted from the measured vibrations in each cable.19 Each cable can be analyzed independently of the others, resulting in a completely decentralized data processing architecture. By converting acceleration time histories to the dominant natural frequencies and transmitting only these values, Feltrin et al.16 found that the transmitted data was reduced by a factor of 500. This resulted in a dramatic reduction in energy consumption due to decreased radio use, as well as decreased likelihood of data loss during transmission between nodes.14 The ambient vibrations were sampled at 50 Hz for 20.5 s. Each round of sampling took less than 1 s to extract the first eight dominant frequencies.16 Once the data were analyzed, they were transmitted to the root node and temporarily stored at the base station. The base station was linked through a secure mobile cellular connection to a remote control center that was used for long-term data storage and off-line analysis.
17.3.4 Network stability
One of the largest challenges in deploying a WSN is ensuring network stability over a long period of time. Nodes may fall out of the network for a variety of reasons, including insufficient battery power, lack of reliable communication, or microprocessor inundation due to localized data processing. Throughout their study, Feltrin et al.14 focused on optimizing network stability through various means. They first divided their frequency algorithm into two separate threads, thus improving the node’s availability for communication and limiting the likelihood of complete node inundation. They next made improvements to their system management techniques at the node, base station, and control center. Even with these improvements, however, only 4.2 nodes, on average, were responsive throughout an 80 day test period. Therefore, this study clearly highlights the difficulties that arise with a field deployment of WSNs, specifically in terms of long-term network stability.
17.3.5 Case study conclusions
This study demonstrated the successful long-term deployment of a WSN on a cable-stayed bridge. During this time, Feltrin et al.14–16 focused heavily on the reduction of energy consumption across the network, specifically through the optimization of radio usage. They highlighted the benefit of decreased radio use by reducing the duty cycle usage of each node and simultaneously increasing the battery life of the network. Additionally, by performing localized data processing, they were able to significantly minimize the bandwidth of transmitted data, thereby reducing the active time of the radio while paying a minimal price in data processing. Finally, this field deployment demonstrated the difficulties of ensuring network stability over a long time period while offering suggestions for system improvement.
17.4 Case study III – Jindo Bridge, Haenam/Jindo, South Korea
In 2009, as part of a joint collaboration between the University of Illinois at Urbana-Champaign (UIUC, USA), the Korean Advanced Institute of Science and Technology (KAIST, South Korea) and the University of Tokyo (Japan), a full-scale sensor network was deployed on one of the Jindo Bridges in South Korea.20 The Jindo Bridges are twin cable-stayed bridges that connect the mainland of South Korea, in the city of Haenam, to the Jindo islands (Fig. 17.8). Each bridge comprises three continuous spans, with a main span of 344 m and two 70 m side spans. The first bridge was constructed in 1984 and the second bridge was constructed in 2006. The newer bridge was chosen for the wireless sensing system installation due to the availability of construction and design drawings, as well as access to a pre-existing wired monitoring system, thus allowing for direct comparison between the wired and wireless systems. The wired monitoring system included 15 thermometers, 15 strain gages, four biaxial inclinometers, two string pots, two laser displacement meters, 24 fiber Bragg grating sensors, 20 uniaxial capacitive accelerometers, two biaxial force-balance accelerometers, and three tri-axial seismic accelerometers.20

With its initial deployment in 2009, the wireless sensing system consisted of 70 nodes (Fig. 17.9), with 33 nodes installed on the half of the bridge closest to the Jindo island (22 nodes on the deck, three on the pylon, and eight on cables) and 37 nodes were installed on the Haenam side (26 nodes on the deck, three on the pylon, and seven on the cables).20 In 2011, the network was expanded to include a total of 113 sensor nodes,21 with additional motes added to the previously monitored cables, as well as the deck. Of these 113, three nodes measured temperature, three nodes measured wind characteristics (direction and speed), and the remaining nodes measured acceleration. The system was implemented as a full-scale long-term deployment project without an identified end date.

17.4.1 Wireless sensing unit
Each wireless sensing unit was comprised of the Crossbow Imote2 (now sold by MEMSIC), an IBB2400CA battery board and the SHM-A multiscale sensor board.22 The commercially available Imote223 (Fig. 17.10) was chosen as the wireless sensor unit for this study, due to its high level of adaptability as well its established support system. The mote uses the Intel PXA271 Xscale microprocessor, which runs the TinyOS operating system. It has significant memory capacity with 256 kB SRAM, 32 MB FLASH, and 32 MB SDRAM, thereby enabling longer periods of data collection. The unit is powered from three 1.5 V batteries. The Imote2 is designed to interface with additional data acquisition boards, thereby enhancing its overall functionality. Initially, the SHM-A and SHM-W (a modified version of SHM-A) were interfaced with the Imote2 for data collection purposes20 and the SHM-H was later implemented for monitoring low-level ambient vibrations.21

By using any of the three sensor boards (SHM-A,24 SHM-H,21 or SHM- W25), the Imote2 is able to more effectively monitor civil infrastructure systems. The SHM-A board was developed at the University of Illinois as a fully equipped sensing board containing an on-board 3-axis ST Microelectronics LIS344ALH accelerometer with a measurement range of ± 2 g, a sensitivity of 0.66 V/g, a noise floor of 0.3 mg for the x- and y-axes, and a noise floor of 0.7 mg for the z-axis. The acceleration signals are conditioned by the Quickfilter QF4A51226, which passes the signal through a programmable anti-aliasing filter prior to a 12-bit ADC, with user-select-able sampling rates (pre-programmed at 10, 25, 50, or 100 Hz). The resolution of the ADC can be increased to 16-bits through oversampling but at the penalty of increased power consumption. The SHM-A sensor board also features the Sensirion SHT11 chip, which features on-board digital humidity and temperature sensors. The SHM-H is similar to the SHM-A in design but features an on-board low-noise accelerometer (Silicon’s Design SD1221L-002) with a measurement range of ± 2 g, a sensitivity of 2 V/g, and a noise floor of 0.05 mg at 20 Hz.
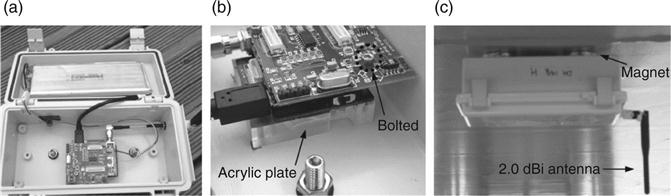
Due to the location of the bridge and its susceptibility to high winds, it was also important to monitor wind speeds. Therefore, the ADC connection on the SHM-A board was modified, and renamed SHM-W such that it contained three 0–5 V channels that could be used for an anemometer (measuring wind speed), a wind vane (measuring horizontal and vertical wind directions), and an accelerometer. The SHM-W board was interfaced with the RM Young Model 81000 anemometer, chosen because of its high resolution and durability in harsh environments. All units were packaged in water-tight PVC enclosures, thus protecting them from environmental factors (Fig. 17.11) and mounted to the bridge using magnets (for the units on the deck or pylons) or U-bars and mounting plates (for the units on the cables), thereby permitting easy and non-obtrusive installation of the units.
17.4.2 Power consumption
As with most field deployments of WSNs, Jang et al.20 were very aware of the power consumption of their network. It was estimated that when using three 1.5 V D-cell batteries a sensing unit would operate for 2 months. To alleviate the issue of periodically replacing batteries, Jang et al.20 also deployed solar panels on eight nodes (five were located on the cables, two on the pylons, and one under the deck). With periodic assessment, they found that the majority of the nodes maintained voltage levels at 4.15 V, which was sufficient to power the units indefinitely, and therefore provided motivation for deployment of more solar charging systems on future network upgrades. The one unit under the deck, however, was not able to properly recharge its batteries. As a result, wind power was also explored as an energy source and was successfully demonstrated as a viable alternative for such nodes.27
Additionally, Jang et al.20 found that the network could conserve power by forcing the units to be in sleep mode (all components on the mote are powered down except for the clock) for long periods of time, a form of duty cycling that was first proposed by Ye et al.28. A unit in sleep mode consumes only 2.25 mW of power as compared to the 756 mW when not in sleep mode (at a 4.5 V referenced power source).24 To ensure that the network is still responsive to sensing commands, each unit periodically wakes and listens for messages from the base station. If it is desired for the entire network to collect data, the base station continuously sends a wake-up message to all of the units until each unit has verified that it is awake and ready for its task. For deployment on the Jindo Bridge, the units slept for 15 s and woke for 750 ms, resulting in a 4.8% duty cycle of the unit and radio.
17.4.3 Communication scheme
The unit was equipped with an Antenova gigaNova Titanis 2.4 GHz external antenna, which enabled a communication range of approximately 200 m. Because the bridge is almost 500 m in length a single base station would not be able to communicate to all the nodes without the use of multi-hopping. Instead, the system was broken down into two sub-networks with a base station located on the concrete piers of each steel pylon of the first Jindo Bridge. As such, one base station could communicate with the nodes on the half of the bridge closest to the Jindo side and another base station could communicate with the remaining nodes on the other half of the bridge closest to the Haenam side.
17.4.4 Data collection and management
The network employed two data collection strategies, which not only ensured that data were collected at regular intervals but also that low frequency, long duration critical events, such as high winds, were captured by the sensing system. To do this, a small subset of the WSN is designated as sentry nodes and sample more frequently. If a sentry node detects a critical event, as indicated by exceeding a threshold value, then the remaining nodes are woken up and perform routine sampling.24 The sentry nodes on the Jindo Bridge monitor both wind and acceleration so as to adequately respond to the prevalent environmental factors of the region.20 If no critical event is detected, the network is designed to sample one time per day, when normal operating thresh-olds are exceeded.29 Once collected, data are sent from the base station to a remote server via the Internet.20 Similar to the aforementioned analyses performed on the Stork Bridge, the collected data were used to perform online decentralized cable tension monitoring. Additionally, the data were also used to determine mode shapes, both using off-line centralized processing techniques as well as on-line decentralized processing algorithms. All analyses were consistent with the wired system response.21
17.4.5 Case study conclusions
With the installation of this sensor network, Jang et al.20 demonstrated a successful long-term deployment of a dense sensor network using the Imote2. The effective use of alternative energy sources was demonstrated through the successful implementation of solar panels, thus providing motivation for further investigation into the area of energy sources for WSNs. Additionally, Jang et al.20 eliminated the need for a multi-hop communication scheme by creating sub-networks within the entire network. Finally, possible data analyses were demonstrated both on-line and off-line, alluding to greater processing requirements and data management with the deployment of such a large data acquisition system.
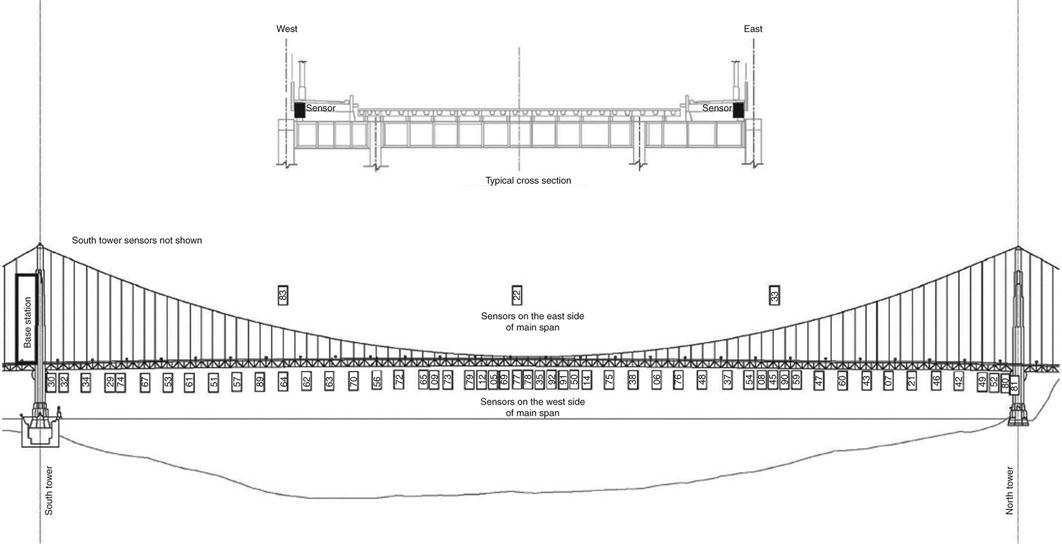
17.5 Case study IV – New Carquinez Bridge, Vallejo/ Crockett, California, USA
In October 2010, a wireless sensing network was deployed on the New Carquinez (Alfred Zampa Memorial) Bridge, with a strong motivation for further addressing the limitations and challenges found from previous WSN deployments.30 In particular, this study had a specific focus on the management of the large amounts of data that are collected through dense WSNs, thereby enabling more effective information extraction by the system end-user. The New Carquinez Bridge is a steel suspension bridge that was constructed in 2003 to cross the Carquinez Strait, thus providing a connection between Vallejo, California and Crockett, California (Fig. 17.12). It is 1024 m in length, with a main span of 728 m; its two concrete towers rise 120 m above sea level. It has a permanent wired monitoring system installed by the California Strong Motion Instrumentation Program, which collects 70 channels of acceleration data from force-balance accelerometers installed along the bridge girder and the link beams of the two concrete towers. Additionally, an anemometer installed at the bridge center span monitors the wind profile of the bridge, and relative longitudinal displacement of the girder is monitored through sensors installed on the girder.30

The WSN contains 33 sensing nodes with 23 measuring acceleration (19 on the main girder, two on the south tower, and two on the north tower), three measuring girder displacement from potentiometers, three measuring climate, such as wind speed, temperature, and humidity (two on the main girder, one on the north tower) and four measuring the strain of the continuous girder box at the maximum strain location, as determined by finite element analysis (Fig. 17.13). In total, the network was capable of collecting 104 channels of data at any given time. The system was implemented as a full-scale, long-term deployment without a specified end date.

17.5.1 Wireless sensing unit
The Narada wireless sensing node, developed at the University of Michigan,31 was chosen as the data acquisition unit for this study, due to its compact design as well as having been tailored specifically for structural monitoring applications (Fig. 17.14). Narada has also been successfully used to monitor bridges,32 wind turbines,33 ships,34 and buildings 35 in the past. The Narada utilizes the Atmel AVR ATMega128 microprocessor and is enhanced with 128 kB of external SRAM memory capabilities. The Narada directly interfaces with a mounted radio using the Chipcon CC2420 transceiver chip operating on the 2.4 GHz IEEE 802.15.4 standard. The radio’s typical communication range is 100 m; however, by using a power-amplified transceiver, the communication range increases to over 500 m.32

Narada contains four data acquisition channels, thus enabling data collection from any 5 V sensor, which feeds directly into an on-board 16-bit ADC. In this study, the tri-axial MEMSIC CXL02TG03 accelerometer was used to measure the ambient vibrations of the bridge. Vertical and transverse accelerations were tracked on the main girder, while nodes on the towers measured acceleration in the longitudinal and transverse directions.
Units between the wind tongue of the girder and the tower shear key measured longitudinal displacements using Celesco SP2–50 potentiometers. Units on the box girders at both towers used Tokyo Sokki FLA-6–11–3LT gages to measure the strain at both the top (longitudinal and transverse directions) and the bottom of the girder (longitudinal direction only). Finally, units designated as climate sensors measured wind speed using a NRG Systems 40H anemometer, wind direction with the NRG Systems 200P wind vein, temperature with the National Semi-Conductor LM35DT solid-state temperature sensor, and humidity with the TDK Corporation CHS-UPS humidity sensor. All units were enclosed in a polycarbonate NEMA-rated waterproof enclosure, such that all electrical components were protected from harsh environmental effects (Fig. 17.15).

17.5.2 Power consumption
Kurata et al.30 optimized their power consumption through the use of alternative energy sources, as well as low-power sleep modes for the wireless sensor. Each sensing unit relied on solar power energy to recharge its battery pack, comprising five AA NiMH rechargeable batteries, thereby alleviating the constraints placed on traditional battery-powered systems. The panel was a mono-crystalline solar panel with a power rating of 3.3 W and a maximum power voltage of 9 V. Each Narada unit could also measure the battery pack voltage, thus ensuring that each solar panel was working properly.
Similar to the previous case studies, Kurata et al. also optimized the networks energy consumption by introducing sleep modes to the sensor units.30 By powering down the microcontroller, but still leaving the radioactive, the Narada consumes 215 mW in sleep mode (at a 5 V regulated power source), as compared to the 375 mW consumed in active mode, resulting in a modest, but important, reduction in energy consumption. By leaving the radio enabled, the unit is still able to receive commands from the system server, thereby still allowing fast response of a unit. In this way, the network is able to be revived very quickly, allowing it to respond to critical events such as earthquakes.
17.5.3 Communication scheme
When equipped with the power-amplified transceiver, the sensing units were capable of communicating over 500 m. The bridge, however, extends more than 1000 m in length, thus prohibiting the use of a single network without implementing a multi-hop communication scheme. To bypass this form of slow communication, Kurata et al.30 employed three sub-networks, each relying on a single-hop communication scheme and communicating to their own unique server station. The 14 nodes on the north side of the bridge operate as one network, the 14 nodes on the south side of the bridge operate as a second network, and the five nodes at the top of the towers operate as the third network. Each sub-network was internally time synchronized through the beacon method, in which all units are synchronized through a single packet sent from the server. The sub-networks were time synchronized through the remote network server that was used to manage and store data, using the network time protocol (NTP) native to Linux.30
17.5.4 Data collection and management
As this is a fairly young bridge, the wireless sensing system was not installed as a means of detecting structural deterioration or health. Instead, the system was used to understand the bridge’s response to daily use, as well as to understand how bridge behavior varies with the external environment (e.g., wind, temperature). Additionally, data that are collected are also used to verify and update finite element models (FEMs) developed by the bridge owner. Due to the bridge being situated in a seismic region, the bridge owner uses the FEM as a means of checking the bridge condition immediately following a large earthquake by inputting measured ground time histories collected from the bridge foundation into the model. As a result of these two motivators for data collection, any data that are collected by the WSN are stored by a remote server where they can be further analyzed and used later, resulting in a high volume of both raw and processed data.
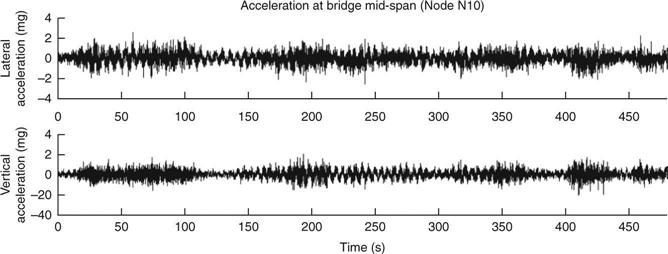
Typically, data are collected from all sensors every 4 h for 8 continuous minutes at 20 Hz, resulting in acceleration (Fig. 17.16), strain (Fig. 17.17), wind (Fig. 17.18), and temperature time histories. This information can be synthesized in post-processing to extract important bridge characteristics and behav- iors. For example, using stochastic subspace identification36 with acceleration data from normal traffic flow, the operational frequencies can be extracted (Fig. 17.19), thereby highlighting important bridge behaviors that can be compared with FEM results through model updating. Numerous other post-processing algorithms can be employed to allow for information integration for the end-user thereby enabling more effective structural monitoring.


One of the largest contributions of this study was the implementation of a two-tiered wireless sensing network (Fig. 17.20). The lower tier is the network of low-power sensor nodes (i.e., the Narada units), which performs the data collection across the bridge. The upper tier represents a complete cyber-infrastructure framework with a remote database server called SenStore.37 Data that are collected from the lower tier are transmitted to the database through a cellular modem where they are archived and stored. Additionally, SenStore stores bridge metadata (i.e., bridge geometric details, structural details, sensor information, etc.) in a separate database, thus allowing easy access by the end-user for modeling or decision-making use. In this way, the end-user is able to access the database at any time, thereby enabling complete information integration.

17.5.6 Case study conclusions
In this study, Kurata et al.30 demonstrated the successful long-term deployment of a WSN on the New Carquinez Bridge. They were able to significantly reduce power concerns through the implementation of solar panels for recharging each wireless sensor unit’s battery pack. Additionally, Kurata et al. refined the data collection process by creating sub-networks of sensing nodes, each reporting to its own base station, thus eliminating the need for multi-hop communication. Such a network, however, creates large amounts of data that must be stored for further analysis. As such, in this study it was demonstrated the need for, as well as the successful integration of, a database that is capable of storing information that can be easily accessed. These data may be stored in raw form, or may be processed off-line such that they are more useful to the end-user.
17.6 Conclusion
Four case studies were presented in this chapter as a means of providing a representative view of the challenges encountered during full-scale deployment of WSNs on civil infrastructure, in particular bridges. From the studies, it is evident that power consumption, reliable communications, and environmental impact are large concerns that must be addressed for successful implementation. By incorporating software enhancements, such as sleep times for sensing units or streamlining algo-rithms, as well as integrating alternative energy sources into the network, it is possible to overcome the power constraints of the network. Additionally, by utilizing long range radios and also carefully deploying the network such that all units can be accessed by a server station either directly or through multi-hops, reliable communication can be ensured. Finally, by carefully packaging the units and by performing routine maintenance, the units can be protected against environmental factors that may inhibit the longevity of the network. As such, by overcoming these network constraints, WSNs will become increasingly common for civil infrastructure and, as they do, it is important to develop mechanisms for dealing with the enormous amounts of data that can be extracted from the network. Therefore, as proposed by Kurata et al.,30 in order for such monitoring systems to be truly successful, future work should focus on developing appropriate database systems for data collection that allow for ease of access by the end-user and full integration with existing models and decision-making tools.
17.7 Acknowledgments
The authors of this chapter would like to acknowledge the generous support provided by the National Science Foundation (NSF) through grant numbers CCF-0910765 and CMMI-0846256. The authors would also like to gratefully acknowledge the generous support offered by the US Department of Commerce, National Institute of Standards and Technology (NIST) Technology Innovation Program (TIP) under Cooperative Agreement 70NANB9H9008. Finally, preparation of the chapter was partially supported by the National Research Foundation of Korea Grant funded by the Korean Government (MEST) (NRF-2011–220-D00105 (2011068.0)).