
Laser-based sensing for assessing and monitoring civil infrastructures
T.-Y. Yu, University of Massachusetts Lowell, USA
Abstract:
This chapter provides an overview of current laser-based sensing techniques and their applications in science and engineering. The chapter first introduces the principles of lasers, followed by a technical description of several laser-based sensing techniques including laser interferometry or electronic speckle pattern interferometry (ESPI), digital shearography, scanning photogrammetry, laser Doppler vibrometry (LDV), and laser-ultrasound. Other laser-related techniques are also discussed, with an emphasis on civil infrastructure applications. The chapter then addresses the safety issue associated with the use of lasers.
Key words
laser; electronic speckle pattern interferometry (ESPI); digital shearography; scanning photogrammetry; laser Doppler vibrometry (LDV); laser-ultrasound; safety
12.1 Introduction
Since the debut of light amplification by stimulated emission of radiation (LASER) in the 1960s, laser-based sensing techniques have found expanding application and growing influence in science and engineering, as well as in academia and industry. The noncontact nature of using coherent electromagnetic waves (monochromatic radiation) in detecting the characteristics of a remote target in a laser-based sensing is enabled by the high energy levels at which laser beams are generated. This high energy level characteristic of laser-based sensing improves the signal-to-noise ratio (SNR) in many engineering inspection problems, still creating new applications for laser in the twenty-first century.
Laser-based sensing can be destructive (e.g., electric speckle pattern interferometry (ESPI)) or nondestructive (e.g., laser Doppler vibrometry (LDV)), depending on the purpose of investigation. It is one of the noncontact inspection/evaluation/testing (NDI/E/T) methods applied to assess and monitor the performance/condition of engineering materials and structures. While the theoretical foundation of laser-based sensing was laid down by A. Einstein in 1917 (Einstein, 1917), its practical use and wide application were not possible until W.E. Lamb and R.C. Retherford demonstrated the mechanism of stimulated emission in hydrogen spectra in 1947, the principle of microwave amplification by stimulated emission of radiation (MASER) developed by J.R. Gordon, H.J. Zeiger, and C.H. Townes in 1955, the method of optical pumping theoretically by A. Kastler in 1950 and experimentally by J. Brossel, A. Kastler, and J. Winter in 1952 (Brossel et al., 1952; Kastler, 1957), the experimental work on the use of ruby for lasers, and the MASER principle for the amplification of light proposed by A.L. Schawlow and C.H. Townes in 1958. G. Gould coined the acronym LASER in 1959, while Schawlow and Townes proposed ‘optical maser’ for the same concept in 1957.
Early developments of lasers include the first solid-state laser (made of synthetic ruby crystal) built by T.H. Maiman at the Hughes Research Labs in 1960, and the first gas laser (made of helium–neon) built by D.R. Herriott, A.M. Javan, and W.R. Bennett at the Bell Telephone Labs in 1960. A.M. Prokorov and N. Basov also made major contributions in the theoretical development of lasers.
While widely used in precision manufacturing at the present time, lasers have been applied in the sensing, inspection, and measurement applications in science and engineering. Since lasers can range in power from the harmless level (> 1 mW) (e.g., laser pointer) to the dangerous level (1.3 PW or 1.3 × 10¹⁵ W) (e.g., the laser developed by the Lawrence Livermore National Laboratory (LLNL)), they are suitable for the distant inspection and remote sensing of physical parameters such as displacement/deformation and velocity in hostile environments (e.g., high temperature) for a wide variety of applications. Furthermore, lasers have also been used to ignite and/or drive a nuclear fusion reaction. The US National Ignition Facility at the LLNL is a representative example.
When choosing laser-based sensing techniques for a particular application, energy level (watts or W for continuous wave (CW) laser and millejoules or mJ for pulsed laser), laser carrier wavelength (nm), laser resolution (e.g., spot size = μm, angular resolution), laser pulse length (ns) (for pulsed lasers), and pulse interval (ns) (for pulsed lasers) of a selected laser system are usually evaluated. CW or pulsed lasers can be selected, depending on the required sampling resolution for time-dependent parameters such as velocity and dynamic strain. In general, the advantages of laser techniques include (i) noncontact nature of measurement, (ii) flexible range of measurement, (iii) multi-dimensional measurement, and (iv) real-time assessment. On the other hand, the disadvantages of laser techniques include safety considerations and data interpretation.
In this chapter, the principles of lasers are first introduced in a concise manner. Current laser-based sensing techniques including laser interferometry or ESPI, laser digital shearography, laser scanning photogrammetry, LDV, and laser-ultrasound, and other techniques are also described. Safety measures and standards in the use of laser-based sensing techniques are also provided. Finally, research issues associated with laser-based sensing are discussed in Section 12.11.
12.2 Laser principles
A laser is a device that generates an intense light beam of highly monochromatic radiation (coherent electromagnetic waves in space and time) through externally amplifying a light source inside an optical resonator/cavity. In other words, it is an optical oscillator, consisting of an amplifying medium placed inside an optical resonator. Standing waves are excited within the medium to amplify the input light beam in order to produce an intense, highly monochromatic output beam. Theoretically, this is achieved by stimulated or induced emission of radiation by atomic systems. In the following, key principles in the formation of laser are addressed.
12.2.1 Stimulated emission and thermal radiation
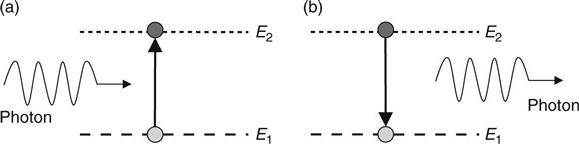
As A. Einstein first introduced in 1917, radiation of atomic systems can be generated by the concept of stimulated (induced) emission. When an active, amplifying medium is subject to an intense burst of broadband (incoherent) light, some of the input light energy is absorbed by the atoms of the medium (or the atoms in the medium are excited) such that the energy level of these atoms is increased to a higher level. After achieving the desired energy level, these atoms are released to return to their unexcited state (ground state, lower energy level), accompanied by the emission of light waves (photons).
Selection of a laser amplifying medium is made based upon the requirement that the excited (stimulated) atoms in the amplifying medium can pause or stay in an energy level (metastable state) before returning to their ground state. Light emission of the same input light wavelength in the medium can occur during this process. In other words, stimulated atoms start emitting single wavelength (coherent) light. Figure 12.1 shows three energy states in laser.

Consider a quantized atomic system in two different energy states: E1 and E2 with the numbers of atoms N1 and N2, respectively. Assuming that E2 is higher than E1 and the system is in equilibrium with thermal radiation at a given temperature T, the relationship between N1 and N2 can be determined by Boltzmann’s equation:
[12.1]
where k = R/NA is the Boltzmann constant (k = 1.380648 × 10− 23 J/K), R the gas constant (= 8.314462 J/mol/K), NA the Avogadro constant (= 6.022141 × 10²³ mol− 1), and T the absolute temperature (K).
Emission of a photon occurs when an atom in E2 decays to E1. Figure 12.2 conceptually describes the energy absorption and emission of atoms. The frequency of emitted/radiated photons (light wave), f, is determined by:
[12.2]
where h is the Planck constant (= 6.6260069 × 10− 34 J-s). Since the emission of photons by an atom can be created spontaneously or by stimulation, the energy equilibrium between emission and absorption is:
[12.3]
where A21 is the probability per unit time for spontaneous emission, B21 the proportional constant for stimulated emission, B12 the proportional constant for stimulated absorption, and uv the energy density of the radiation frequency v. By applying the Planck radiation formula, the energy density of the radiation frequency can be found by:
[12.4]
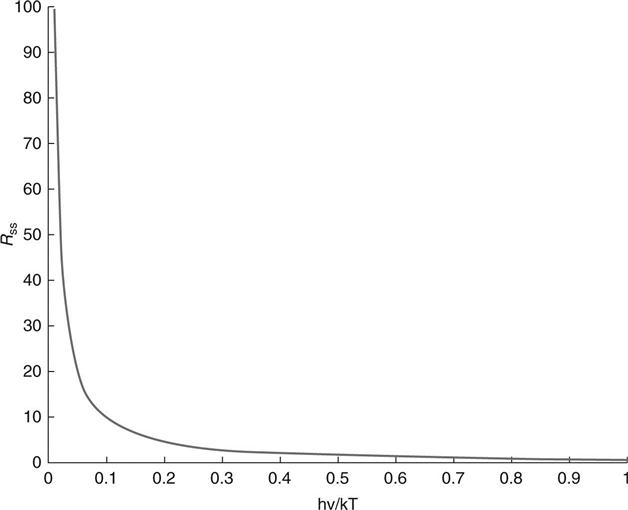
The ratio of stimulated emission rate to spontaneous emission rate, Rss, is determined by:
[12.5]
When the value of kT becomes much greater than that of hv, Rss is significantly increased, as shown in Fig. 12.3.
12.2.2 Optical amplification of lights in a medium
The Planck radiation condition requires B21 = B12, suggesting that N2 > N1, which means the number (population) of atoms in E2 is greater that in E1 (called population inversion). When population inversion occurs, a light beam will increase in intensity (or be amplified) as it passes through the amplifying medium. In other words, optical amplification happens when the gain due to stimulated emission exceeds the loss due to absorption.
There are several approaches to achieving optical amplification, including (i) optical pumping (photon excitation), (ii) electron excitation, (iii) inelastic atom–atom collisions, and (iv) chemical reactions. In the optical pumping approach, an external light source is applied to produce a high population of energy levels in the amplifying medium by selective optical absorption. Solid-state lasers and the ruby laser are based on this principle. In the electron excitation approach, direct electron excitation is employed in a gaseous discharge process to produce population inversion. Examples include the gaseous ion lasers and the argon laser. In the inelastic atom–atom collision approach, two different types of gas atoms are used, whose excited energy states coincide or are very close. If one excited state of a gas atom is metastable, then the other gas atom will decay by radiation and emit photons. For example, in the helium–neon laser, the energy level of a neon atom is first increased by an excited helium atom, and the laser transition occurs in the neon atom. In the chemical reaction approach, an excited state of molecules or atoms is achieved by the chemical change in these molecules or atoms. In the example of the hydrogen fluoride chemical laser, excited hydrogen fluoride molecules are generated from a chemical reaction. Other theoretical topics on the principle of lasers can be found in the literature (Kock, 1969; Fowles, 1975; Svelto, 1982; Weber, 2001; Csele, 2004; Chang, 2005; Stenholm, 2005; Chu 2007).
Examples of laser include gas lasers (e.g., helium–neon or He–Ne, argon or Ar, krypton, carbon dioxide or CO2), solid-state lasers (e.g., ruby, neodymium, calcium fluoride, calcium tungstate, and neodymium-doped yttrium aluminum garnet (Nd:YAG)), dye lasers (e.g., sodium fluorescein, rhodamine, cresyl violet, and coumarin), semiconductor diode lasers (e.g., light-emitting-diode (LED)), and fiber lasers (e.g., erbium, neodymium, dysprosium, praseodymium, thulium, and ytterbium). These lasers are developed for various purposes and different materials. For example, the Nd:YAG laser typically works with metals and composite materials, while the CO2 laser is best for glasses and ceramics. Table 12.1 lists the properties of selected lasers.
12.3 Laser interferometry or electronic speckle pattern interferometry
Laser interferometry or ESPI, also known as computer-aided speckle pattern interferometry (CASPI), television holography, and video holography, is the electronic processing of speckle patterns produced by a laser interferometer consisting of two laser beams (using a beam splitter) generated from the same laser source. Interferometers can be categorized into amplitude-splitting (e.g., Michelson, Mach-Zehner (Zipser and Franke, 2004), Fabry–Pérot, Fizeau) and wavefront-splitting (e.g., Fresnel bi-prism, Rayleigh, Lloyd’s mirror).
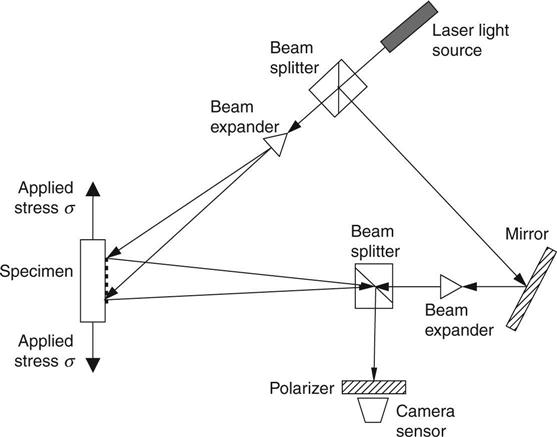
When a target with a perfectly-smooth surface is illuminated by laser, no speckles will be generated and an amplitude-splitting interferometer such as Michelson interferometer can be used. However, when a rough surface is encountered, a speckle pattern (irregular fringe pattern) will be revealed by the use of a coherent light source such as a laser. In ESPI, the laser interferometer generates a primary beam split into two beams: one is the object beam, which passes through a beam expander and is used to illuminate the target, and the other is the reference beam, which is directed to the image recording device or sensor, typically a charge-coupled device (CCD). The returned beam reflected from the target surface is also recorded by the CCD. When the beam path difference between the object beam and the reference beam is within the coherent length of the primary laser beam, the two beams will interfere and produce a speckle pattern. The purpose of a frame grabber is to capture and store these speckle images for post-processing and data interpretation. Further information on speckle interferometry can be found at Jones and Wykes (1989).
Measurement schemes for in-plane and out-of-plane deformation and velocity are shown in Figs 12.4 and 12.5, respectively.

12.3.1 Laser holographic interferometry
Laser holographic interferometry is a technique combining laser interferometry and holography. The principle of holography is based on the fact that, via simultaneously recording a reference light (laser) beam (split by a beam splitter) and a returned, scattered light beam from the surface of a target on a holographic plate, reconstruction of an exact replica of the target can be achieved. The image recorded on the holographic plate is called a hologram of the target, which carries both the amplitude and phase of the returned, scattered beam from the target. The first exposure of the holographic plate by the reference beam results in a reference hologram, while the second exposure by the returned beam imposes all changes of the target to the reference hologram. The result is a fringe pattern of the target, containing all information about the change that occurred between the first and the second exposures. In laser holographic interferometry, both a reference beam and a returned beam (scattered from the target) are required. Additional information on holographic imaging can be found at Erf (1974) and Vest (1979). Further information on laser interferometry can be found at Chu (2007) and Hariharan (2007).
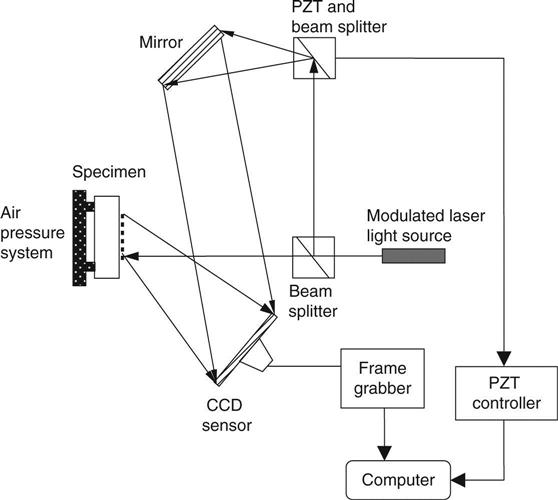
Twitto et al. (1996) used an He–Ne laser to illuminate loaded brass plate specimens and a piezoelectric (PZT) crystal controlled mirror for the holographic imaging of the specimen. The reflected laser beam from the specimen was measured by a CCD sensor and the PZT mirror. Phase shifting was included in the development of their work. Figure 12.6 illustrates the experimental set-up of a holographic interferometry utilizing phase shift.
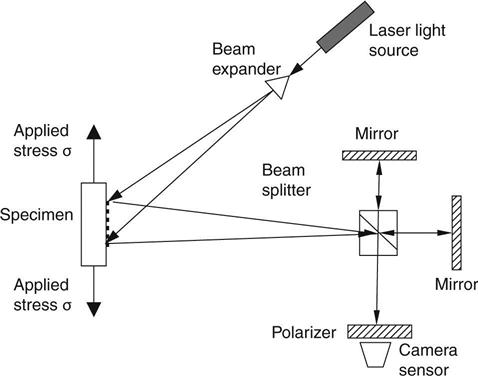
12.4 Laser digital shearography
Laser digital shearography is an interferometric technique developed to overcome the limitations of holography, due to the advantages including (i) removing requirement for a reference light beam, (ii) reduced coherence length, and (iii) direct measurement of surface strain (Hung et al., 2007). The principle of image shearing is based on a light beam passing through a doubly refractive prism and splitting into two angularly separated beams. Figure 12.7 shows the principle of laser digital shearography. Through the image-shearing device, two nonparallel light beams scattered from two different object points become nearly collinear, and the resulting low spatial frequency of the interference fringes can be resolved with a low resolution image sensor such as a CCD. The two sheared wavefronts transmitted by the two axes of the image's hearing device, however, are orthogonally polarized. Therefore, they will not interfere with each other. To enable interference, a polarizer with its polarization axis oriented at an azimuth of 45° is required, as shown in Fig. 12.7. Since the illuminated object surface is generally optically rough, interference of the two sheared wavefronts will result in a speckle pattern embedded in the shearographic image. This speckle pattern image of the specimen before loading can be represented by Hung and Ho (2005):
[12.6]
where I is the speckle image intensity at the image plane of the CCD sensor before loading, I0 the intensity of the laterally sheared image, μ the amplitude of modulation of the speckle pattern, and ϕ the random phase angle. The speckle pattern image of the specimens after loading can be expressed by:
[12.7]
where I′ is the speckle image intensity at the image plane of the CCD sensor after loading and Δ the phase angle change due to surface deformation. To remove the random phase angle change, the difference between I and Ι′ is used:
[12.8]
where Id is evaluated at the pixel level and used for relating the level of loading and surface deformation. Digital shearography using multiple wavelengths has also been proposed by Kastle et al. (1999). A comparison between digital shearography and ESPI can be found at Findeis and Gryzagoridis (2004).
12.5 Laser scanning photogrammetry
Laser scanning is a remote inspection/sensing method in which laser beams are steered/directed along a line (2D) (Fig. 12.8) or within an area (3D) for distance measurement. Laser scanners operate in either (i) stationary mode or (ii) mobile mode. In stationary mode, laser scanners are typically installed on a tripod, while in mobile mode, laser scanners can be handheld, vehicle-mounted, robot-mounted, or aircraft-mounted. Laser scanning photogrammetry is an integrated technique combining laser scanning and digital photogrammetry. Digital photogrammetry is based on the processing of images and produces digital terrain models (DTM), digital surface models (DSM), orthoimages, and 2D/3D reconstruction and classification of objects for mapping and visualization purposes (Baltsavias, 1999). The main differences between laser scanning and digital photogrammetry are summarized in Table 12.2.

Table 12.2
Comparison between laser scanning and photogrammetry
| Laser scanning | Digital photogrammetry | |
| Sensing scheme | Active | Passive |
| Power level | High | Low |
| Sensor type | Point sensors with polar geometry | Frame/linear sensors with perspective geometry |
| Sampling area | Full area | Point wise sampling |
| Acquisition of 3D coordinates | Direct | Indirect |
| Image type | Monochromatic (low quality, single spectral) | Geometrical/radiometrical (high quality, multi spectral) |
Key components of laser scanning photogrammetry include: (i) a laser scanner, (ii) a digital camera, (iii) global positioning system (GPS) (when the position of the laser scanner is changed), (iv) a total station (optional), (v) a portable computer, and (vi) data processing software for 3D modeling and data registration.
El-Omari and Moselhi (2007, 2008) applied a 3D laser scanning system (Riegl LPM 100 VHS LADAR) and photogrammetry (including software, computer, and a digital camera) to generate point cloud data of a construction site and several boxes for image reconstruction and 3D modeling. Scanning angular resolution varied from 0.015° to 0.75°, and the inspection distance ranged from 1 to 50 m. Image resolution (or the distance between any two points in the point cloud image) depended on (i) the distance between the target and the laser scanner, and (ii) the angular resolution of the laser scanner. Inspection time depended on the required image resolution and the spatial range of inspection (size of the target). For example, with a distance of 4.3 m, horizontal angular range of 21°, vertical angular range of 18°, and an angular resolution of 0.015°, the total inspection time was 58 min, while the total inspection time could be reduced to 15 s in the case of 0.75° angular resolution (El-Omari and Moselhi, 2008).
Rodriguez et al. (2008) developed a portable laser photogrammetric sensor by combining a laser distance meter (ranger) (Leica Zinder Distro Plus) and a digital camera. The laser distance meter could measure distance ranging from 0.2 to 200 m at a resolution of 1.5 mm. Sturzenegger and Stead (2009) adopted laser scanning photogrammetry in a photogrammetric rock cut survey and used a 3D laser scanner (Optech ILRIS-3D), a digital camera, and data processing software. They scanned few terrestrial targets at distances ranging from 29 to 163 m. Armesto et al. (2009) applied an analog semi-metric camera, a laser total station, and a monoscopic digital photogrammetric station for the close-range (< 100 m) evaluation of timber roof construction. 3D finite element modeling was also adopted to perform static and dynamic analyses of the timber roof structure. In other damage detection problems such as surface potholes in asphalt pavement structures, 3D laser scanning technology was applied in literature (Koch and Brilakis, 2011).
12.6 Laser Doppler vibrometry
A laser Doppler vibrometer is a passive, nondestructive, dynamic interferometer in which the beam emerging from the laser is divided into two: one of which is used as a transmitting beam and the other as a reference beam for coherent detection.
The transmitting beam illuminates the surface of a target (which can be a solid structure, or a particle in air or in fluid), while the reference beam is combined with the returned beam from the target at the detector for coherent detection. The frequency shift between the returned beam and the reference beam is related to the instantaneous velocity of target, due to the Doppler effect. This frequency shift is the Doppler frequency shift. The basic laser Doppler vibrometer is a single point vibrometer. With the addition of a video camera and two orthogonal mirrors, scanning LDV systems can be made to allow large surface measurement with high spatial resolution. LDV is a mature technique for the nondestructive measurement of velocities of macroscopic objects (e.g., engineering structures), fluids (e.g., fluid flow structure), and vibration noise.
Depending on the type of velocity to be measured, LDV can be categorized into translational, rotational, and torsional LDV (Fig. 12.9). In translational LDV, the direction of measured motion is in parallel to the laser beam direction, while in rotational and torsional LDV, the direction of measured motion is perpendicular to the laser beam direction. LDV has been applied in the measurements of translational, rotational (Bell and Rothberg, 2000), and torsional (Halliwell, 1996; Drew and Stone, 1997; Oberholster et al., 2012) velocities in literature.

The principle of LDV is briefly described as follows. Consider the rotational velocity measurement problem using LDV, in which the laser beam is configured on the plane perpendicular to the axis of rotation. The target position x can be assumed to be:
[12.9]
where x0 is the maximum amplitude of x,ωt the angular velocity of rotation, and t the time variable. The rotational velocity υ is found by:
[12.10]
When measuring the laser beam returned from a moving target, the optical frequency is shifted due to the Doppler effect. This Doppler frequency shift fd is given by:
[12.11]
where α is the intersection angle between the laser beam and the target velocity direction, and λ the optical wavelength. Substituting Equation [12.10] into Equation [12.11] leads to:
[12.12]
The intensity of measured returned laser beam Iv can be expressed as:
[12.13]
where Iv0 is the maximum intensity of the returned beam, f= fd+ f0 the total frequency shift, f0 a fixed requency shift used to improve SNR, and φ the random phase angle. In this result, the rotational velocity υ is related to the measured intensity of the returned laser beam Iv.
For basic LDV systems, the lead time for changing one point position to another can be less than 10− 3 s. Typical velocity range for LDV is up to 11 000 rpm or 1000 rad/s. The frequency range in rotational velocity measurement problems is from 1 Hz to 10 kHz, at a calibration accuracy of approximately 0.5% (Castellini et al., 2006). For out-of-plane translational velocity measurements, the frequency range is from 0 Hz to 1 MHz (Olson et al., 2010).
Further information on the theory of rotational vibration measurements using LDV can be found at Bell and Rothberg (2000) and Rothberg and Tirabassi (2012).
LDV has been applied in various fields including modal vibrational analysis, rotating structures, on-line quality control, structural damage detection, assessment of microelectromechanical systems (MEMS) (DeCoster et al., 2008), micro-optical-electromechanical systems (MOEMS), and nanoelectromechanical systems (NEMS),material characterization (Huang et al. 2007), biomedical applications, and condition assessment in civil engineering (Castellini et al., 2006).
Pascal et al. (1993) applied a laser Doppler vibrometer (Polytec OFV 1000) to the characterization of vibrating plates.
Castellini and Santolini (1998) applied a laser Doppler vibrometer (Polytec OFV 3000) to measure the vibration of a naval propeller in water. Mallet et al. (2004) used LDV and Lamb waves on two rectangular plates for crack detection. Vanlanduit et al. (2004) investigated the microphony problem of a mask of a picture tube in a television using LDV. Damljanovic and Weaver (2005) applied a laser Doppler vibrometer (Polytec PDV 100) of 50 μm spot size and 0.05 μm/s resolution to the vibration measurement problem of rail specimens. Hong et al. (2007) applied an scanning laser Doppler vibrometer (SLDV) (Polytec LSV PSV 3000) to determine the piezoelectric coefficients and elastic constant of a piezoelectric thin film on silicon substrate cantilevers. The SLDV was used to measure the displacement and first/fundamental resonant frequency of thin film specimens. Prazenica et al. (2007) used LDV in the surface inspection of artwork and frescoes. Hapsara and Iliescu (2008) applied LDV to biomedical sensing by inspecting a bovine cortical tibia in vitro using a Polytec PSV 400 system. Olson et al. (2010) used LDV (Polytec PSV 400 3D-M) and Lamb waves to inspect 7075-T6 aluminum sheets. Oberholster and Heyns (2011) applied LDV (Polytec PSV 300) to characterize a multi-blade test rotor in operation.
Limitations of LDV include (i) measurement resolution (e.g., range-dependent and frequency-dependent resolution of analog and digital velocity decoders), (ii) measurement uncertainty (e.g., in the optical components of LDV and in the analog signal processor), (iii) direction uncertainty (e.g., misalignment of laser beam path with respect to the out-of-plane velocity direction), (iv) LDV standoff distance (e.g., surface reflection-dependent performance of LDV), (v) SLDV spatial resolution (e.g., minimum spot size of the laser beam), (vi) SNR (e.g., poor SNR on measuring low diffusive surfaces due to speckle effects), and (vii) environmental measurement conditions (e.g., dust, temperature, and pressure) (Castellini et al., 2006). Signal denoising and filtering to improve SNR of LDV can be achieved by hardware design or by software processing. Both frequency-domain (e.g., Fourier analysis) and time-domain (e.g., wavelets and multiresolution analysis (Prazenica et al., 2007)) filtering techniques can be applied.
Also, data compression and evaluation are needed when dealing with large amounts of data. Techniques such as principal component analysis (PCA) and singular value decomposition (SVD) can be used to evaluate the quality of data and to reduce the data size for interpretation (Vanlanduit et al., 2004). In addition, the use of auxiliary computational models in LDV, 3D modeling tools such as SolidWork® can be used for data visualization. Finite element (FE) models can also be used to complement the experimentally obtained LDV data (Olson et al., 2010).
12.7 Laser-ultrasound
Laser-ultrasound (also known as laser-ultrasonics, laser-based ultrasound) is an active, nondestructive, dynamic, interferometric, sensing method capable of revealing the subsurface condition of a target. Different from LDV, in laser-ultrasound, surface/subsurface ultrasonic vibration of a target is generated by one laser and the response is measured either by another laser (Amziane et al., 2012), or by other sensors (Park et al., 2009). In the case of using laser for both excitation and measurement, an interferometer is required to couple the two lasers. In laser-ultrasound the material surface serves as the emitting ultrasonic transducer. The ultrasonic source is produced either by a thermoelastic mechanism or material ablation. Detection is based on the Doppler effect that produces a frequency or phase modulation in the returned laser beam. Demodulation of laser signals is performed by the interferometer that is insensitive to speckle (confocal Fabry–Pérot, or photorefractive or Michelson interferometer). Laser-ultrasound is particularly useful for detecting flaws in targets with complex geometry and measurements on hot surfaces.
In laser-ultrasound techniques, ultrasonic waves or mechanical waves including body waves and surface waves are used to characterize a target. The governing equation of mechanical wave propagation in media is the Navier equation of motion. For homogeneous and isotropic materials (Malvern, 1969),
[12.14]
where λL= Eυ/(1 + υ)(1–2υ) and μL= E/2(1 + υ) are the Lamé constants, ∇ the Laplace operator or Laplacian, u= u(xi; i = 1, 2, 3) the displacement (position) field of a unit cell, ρ the density of the unit cell, and F the body force of the unit cell per unit mass. The traction boundary condition is needed for solving the observable displacement field at the boundary.
[12.15]
where ![]() is the normal vector at the boundary and FBC the prescribed force function acting on the boundary. Displacement fields at the boundary in different conditions (e.g., different mechanical properties: λL, μL) are measured in order to retrieve the variation in the mechanical properties of materials. Velocity fields ∂u/∂t and acceleration fields ∂2u/∂t2 can be determined either analytically when displacement fields u are obtained by evaluating the Navier equation, or numerically when displacement fields are measured over a period of time. The Navier equation is also the general form of the governing equation of mechanical waves.
is the normal vector at the boundary and FBC the prescribed force function acting on the boundary. Displacement fields at the boundary in different conditions (e.g., different mechanical properties: λL, μL) are measured in order to retrieve the variation in the mechanical properties of materials. Velocity fields ∂u/∂t and acceleration fields ∂2u/∂t2 can be determined either analytically when displacement fields u are obtained by evaluating the Navier equation, or numerically when displacement fields are measured over a period of time. The Navier equation is also the general form of the governing equation of mechanical waves.
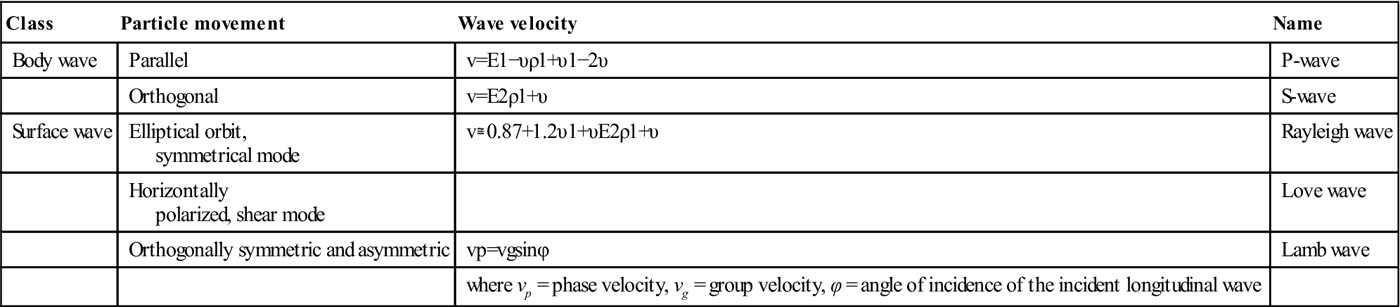
Depending on the boundary condition of the medium, different modes of mechanical waves can be accommodated by the medium. Body waves including compressional waves (or dilational waves, pressure waves or P-waves) and distortional waves (or equivoluminal waves, rotational waves, or shear or S-waves) can occur in an infinite medium or in a medium without finite boundaries. Surface waves including Rayleigh waves and Love waves can occur in a semi-infinite medium or in a medium with one finite boundary. Lamb waves can occur in thin plate and shells (special finite media). Table 12.3 lists the properties of selected mechanical waves. In Table 12.3, the direction of particle movement is determined with respect to the direction of wave propagation. It is obvious that changes in the mechanical properties (E, v, ρ) of a target are reflected in the variation of these wave velocities. The presence of anomalies on/inside a target, on the other hand, can also be reflected in the change of wave velocity, owing to the scattering of waves when encountering the anomalies. The phase and group velocities of Love waves (Jardetzky et al., 1957) can be numerically evaluated, while the phase and group velocities of Lamb waves can be obtained by solving the Rayleigh-Lamb equation (Viktorov, 1967). Further information about laser-ultrasound can be found at Scruby and Drain (1990).
Table 12.3
| Class | Particle movement | Wave velocity | Name |
| Body wave | Parallel | P-wave | |
| Orthogonal | S-wave | ||
| Surface wave | Elliptical orbit, symmetrical mode |
Rayleigh wave | |
| Horizontally polarized, shear mode |
Love wave | ||
| Orthogonally symmetric and asymmetric | Lamb wave | ||
| where vp = phase velocity, vg = group velocity, φ = angle of incidence of the incident longitudinal wave |
Pedrini et al. (2002) combined 3D digital holography with LDV (a pulsed Q-switched ruby laser) and a high-resolution CCD (Pulnix TM-1001) camera to reconstruct the dynamic profile of specimens with curved surfaces. Markov et al. (2003) proposed a whole field laser Doppler vibrometer, and demonstrated the performance of the system on a clamped, circular thin plate. The thin plate was remotely excited by a pulsed acoustical exciter, which generates a brief, broadband shock wave that stimulates the vibration of the plate. Huber et al. (2005) developed laser-acoustic microscopy using an Nd:YAG laser to generate 800 MHz (and higher) longitudinal mode ultrasound in several polymer films. Longo et al. (2006) used a Panametrics 10 MHz transducer to generate surface acoustic waves (SAW) on a steel beam and a laser vibrometer (Polytec PSV 300) for measuring the SAW response of the specimen. Kim et al. (2006) used a pulsed Nd:YAG laser to generate focused ultrasonic (Lamb) waves on an aluminum plate and a Michelson interferometer (Fiberpro MI7000) for measuring the response. Zhang et al. (2006) applied a pulsed Nd:YAG laser to generate Lamb waves on paper samples and a CW photorefractive laser interferometer for measurement. The ultrasonic wave response was used to determine the Young’s modulus, shear rigidity, and thickness of paper samples. In the aerospace industry, Kalms et al. (2008) applied a pulsed CO2 laser to generate ultrasounds in semicrystalline polyphenylene sulfide thermoplastic composites (a material used in modern aircrafts such as Airbus A380) and a macropulse YAG laser for detection. In the nuclear industry, Liu and Yang (2008) applied a pulsed Nd:YAG laser, an interferometer (Polytec OFV 511), and an oscilloscope to characterize the cladding condition on hydrogen-charged Zircaloy tubes that are used in nuclear reactors. Material properties such as Young's modulus and Poisson's ratio were identified from the experiment.
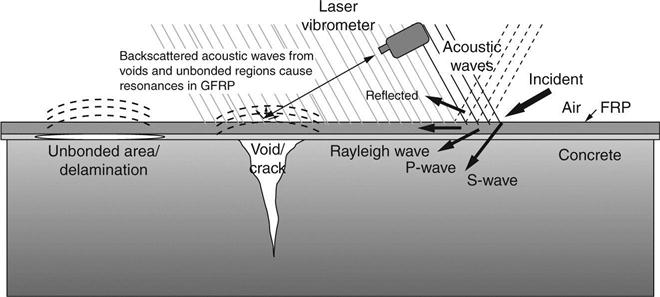
Yu and Haupt (2010) proposed a distant acoustic-laser nondestructive evaluation (NDE) technique utilizing a high powered standoff parametric acoustic array (PAA) and LDV for the detection of debonding and delamination in multi-layer fiber reinforced polymer (FRP) wrapped-concrete systems. In their development, a focused sound beam is generated by the PAA such that the beam diameter can be controlled to directly and locally excite the surface area (where damages/defects are embedded) in the FRP-concrete systems, from a distance exceeding 30 m. Flaws and structural damage embedded underneath the externally bonded FRP plates or wrapped FRP sheets will be detected through the acoustically excited vibration launched by the system (Fig. 12.10). Surface dynamic signatures (Rayleigh waves) of damaged and intact regions are collected by laser Doppler vibrometer and analyzed for damage detection. The laser vibrometer beam size provides us the opportunity to obtain spatial resolution on the order of a millimeter. In this development, the PAA has two sources of sound: one source is high frequency, which is generated directly from one or more high-frequency transducers (2–7 kHz) and the other is low frequency, which is generated from nonlinear effects in the volume of air in front of the transducer (500 Hz–2 kHz). The PAA source can provide a practical means to deliver the necessary level of acoustic power in air to the void underneath the FRP sheet while minimizing system size and weight, reducing the sound level imposed on personnel close to the source. To be able to detect voids of small size between FRP and concrete, the use of PAA source exhibits potential advantages on this particular application.
Amziane et al. (2012) investigated the crack detection problem in a composite spherical particle consisting of four spherical layers, using a laser homodyne interferometer with 532 nm wavelength, 8 mm focal length, 0.5 numerical aperture, and 1 μm spot resolution.
Advantages of laser-ultrasound techniques include (i) noncontact and remote nature, (ii) applicability in hostile environments, (iii) rapid scanning capability, (iv) applicability on geometrically complex targets, (v) ability to generate ultrasonic point source both temporally and spatially, (vi) broadband inspection (in pulsed laser), (vii) high resolution, (viii) ability to generate both surface and bulk acoustic waves, and (ix) ability to generate various ultrasonic surface wavefronts.
Disadvantages of laser-ultrasound techniques include (i) being relatively expensive, (ii) lower sensitivity (iii) material-dependent ultrasound generation efficiency (e.g., material's optical absorption properties), and (iv) laser safety requirements.
12.8 Other laser-based techniques
Laser diffraction grating: Kurita and Ma (1998) used an He–Ne (helium–neon) laser beam (wavelength = 0.6328 μm) to illuminate the surface of a structural steel specimen in order to determine surface strain (εx) using a laser diffraction grating method. The intensity distribution of the diffracted laser beam was measured with a plasma-coupled device (PCD) sensor. The strain was calculated from the shift of the locations of the first-order laser beam spots measured with the PCD sensor. They found that neither the incident angle of laser nor the deformation of the grating affect the measured surface strain. Figure 12.11 schematically shows the experimental setup of the method.

Laser-acoustic-emission (laser-AE) technique: Enoki and Nishinoiri (2005) proposed an He–Ne laser-AE system to measure high-temperature (~ 773 K) AE signals during sintering of alumina ceramics and thermal spying of alumina powder on steel substrate to overcome the difficulties associated with conventional AE sensors, which typically do not perform well above 600 K.
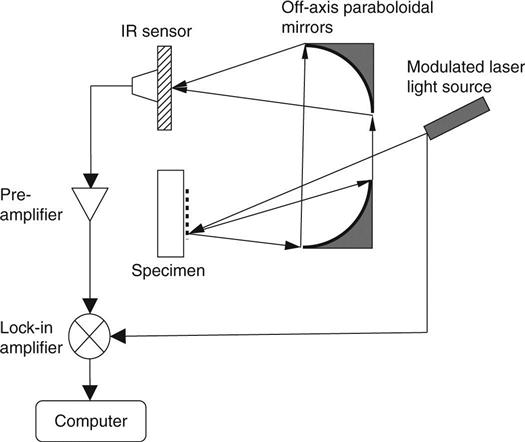
Laser infrared photothermal radiometry (laser IR-PTR): Mandelis (2001) developed a laser IR-PTR using an argon-ion laser modulated by an acousto-optic modulator to direct the laser beam onto the specimen surface. The laser beam is broadened with a diffuser to attain a larger spot size for 1D analysis. The emitted IR radiation from the specimen surface is collected and focused onto the detector using two off-axis paraboloidal mirrors. Collected signals (amplitude and phase) are pre-amplified, sent to a lock-in amplifier, and recorded over a range of laser modulation frequencies for data analysis. Experimental work was reported on the surface roughness measurement of thermally processed carbon steels, thermal-barrier coatings, and industrial silicon wafers. Figure 12.12 shows the inspection scheme of laser IR-PTR.
Laser photoacoustic spectroscopy: van Neste et al. (2008) used a pulsed quantum cascade laser (QCL) to illuminate the surface of stainless steel specimens coated with varying amounts of chemical residue and a quartz crystal tuning fork (QCTF) to detect the scattered laser beam in developing a laser photoacoustic spectroscopy system.
Wireless power transmission using laser: Park et al. (2012) inspected aluminum plates using an Nd:YAG laser as power source to remotely excite ultrasonic transducers used for sensing, achieved by converting modulated optical power into electrical power.
12.9 Civil infrastructure applications
In civil engineering, laser-based sensing has shown its potential and practical value in a number of inspection and monitoring problems in bridges, buildings, tunnels, railways, roadways, and material characterization, due to its advantages in terms of (i) capability to access difficult to reach locations, (ii) non-invasive nature of interrogation, (iii) remote inspection, and (iv) relatively quick configuration. Selected applications are summarized as follows.
• Bridge cable tension measurements – in the condition assessment of cable-stayed bridges, tension levels in cables are of primary importance in ensuring the safety and preserving the integrity of the cable-stayed bridge. Laser-based sensing techniques such as LDV can be applied to extract the dynamic characteristic of stay cables under temperature variation and ambient vibration for condition assessment. Chen and Petro (1999) applied an LDV (Ometron VPI 4000) to a highway bridge to measure the frequency and tension in cables under ambient conditions.
• Construction monitoring – during construction, kinematic information on the ground and the surface of a temporary supporting system indicates the on-site soil condition and the structural integrity of the supporting system. Laser scanners can be applied to such engineering geodesy applications to monitor the movement and deflection of targets in the field during construction for safety assurance and quality control. Zogg and Grimm (2008) applied a profile laser scanner (SICK LMS200-30106) to monitor field deflections in airport construction. A 200-ton crane simulated airplane loading. The size of the bow wave, which occurs on the first wheel when driving into the ground, was measured and studied.
• Tunnel liner inspection – in the condition assessment of railway, subway, and roadway tunnels, surface characteristics and internal check of concrete liners are important to the structural integrity of tunnels. Physical damage including concrete cracking, concrete spalling, steel corrosion, and material deterioration indicates excessive earth pressure, abnormal change in geological conditions, and other causes, which can lead to structural failure. By measuring the surface profile and calculating the histogram of laser return intensity, geometric and physical characteristics of tunnels can be identified and used for damage detection. Yoon et al. (2009) combined LDV (Optech ILRIS-3D) and a line scanner (Acuity AR-4000) in a locomotive laser scanning system for the inspection of a railway tunnel.
• Rail track evaluation – laser-based sensing techniques can be applied to the inspection of rail tracks by (i) surface profiling of railways and (ii) laser-induced thermal vibration in rail tracks. Surface profiling is capable of providing the texture characteristics of rail tracks, ties, and ballast, while laser-induced thermal vibration can reveal the subsurface condition of rail tracks. Mandelis et al. (1999) applied laser IR-PTR and tomographic imaging for the subsurface defect detection in steel rail tracks. Depth-dependent thermal diffusivity of steel rail tracks was used to reveal the presence of a subsurface defect in a steel sample. Kenderian et al. (2006) developed a laser-ultrasound technique for the detection of vertical split head cracks, rail base cracks, shattered rim cracks, thermal fatigue cracks in wheel tread in rails, using time-domain analysis and waveform analysis of acoustic wave.
• Image segmentation for stone aggregates – with the accuracy and efficiency laser scanners can provide, 3D image analysis of stone aggregates becomes available and can be used to determine the volume and size of the minimum square opening through which it can pass in an aggregate sample. Kim et al. (2003) proposed a particle segmentation method in the development of the laser-based aggregate scanning system (LASS).
• Dynamic/modal analysis – by measuring the dynamic response of structures using LDV to generate the cross-correlation functions and applying the eigenvalue realization algorithm (ERA) to identify modal parameters of structures, operational modal analysis can be conducted using laser-based sensing techniques. Identification of modal parameters can be performed by time-domain methods (e.g., covariance-driven, data-driven), frequency-domain methods, or crosstime-frequency-domain methods (e.g., Hilbert-Huang transform, wavelet transform). Bourgard and Ellis (1998) conducted extensive measurement of building vibration, including an eight-story steel frame building, a six-story timber frame building, and a concrete building. Siringoringo and Fujino (2009) used a scanning LDV (using He–Ne laser) to determine the modal parameters of a steel plate clamped by bolts, using several threshold criteria and extended modal amplitude coherence to identify vibration modes.
• Structural health monitoring – compared to other structural health monitoring techniques including strain sensors (e.g., linear variable displacement transducers, fiber optics), accelerometers (e.g., piezoelectric sensors, MEMS), and vision-based sensors (e.g., CCD and LED), laser-based sensing techniques do not require the deployment of a large number of sensors for large civil infrastructure systems (hence, no wiring cost for wired sensors and no maintenance cost for wireless sensors), neither do they require the direct access to reach structures and the need to illuminate the structure. Laser-based sensing techniques are capable of measuring maximum deflections/displacements and vibration level and are independent of natural light sources as compared with other passive digital camera sensors. Park et al. (2007) demonstrated the use of a scanning LDV system (Optech ILRIS-3D) to measure the displacement and deformation shape of a steel beam specimen in their development of a terrestrial laser scanning (TLS) system. Vertical deflections and maximum stress were measured by their TLS and compared with linear variable differential transformer (LVDT), strain gage, and fibre optic sensor (FOS) sensors. Nassif et al. (2005) used an LDV system (Polytec OFV-3001) on a four-span bridge under a dynamic live load test to verify the displacement measurement collected by LVDT sensors and the velocity measurement collected by geophone sensors.
• Pavement texture characterization – in the mix design of bituminous/asphalt pavements, the adopted compaction condition of bituminous mixtures can affect the physical, mechanical, and volumetric properties of the mixture. Laser profilers can be used in determining the geometry of the pavement surface by measuring the texture depth, mean profile depth, and average asperity density. Gabriele et al. (2009) proposed a testing protocol to evaluate a Superpave gyratory compactor's ability to produce bituminous mixtures able to effectively represent both the density and the surface properties of the mixture in site. Vilaca et al. (2010) developed a laboratory prototype equipment to characterize the texture of asphalt pavement road surfaces by using a laser range finder (LRF). Wang et al. (2011) also used an LRF in the development of a portable device to measure the macrotexture of roadway pavement.
• Street mapping – when combined with GPS, laser scanners can be turned into a field mapping system for landscapes and street views. Such applications usually require a mobile carrier and a 3D platform to enable the laser scanner to maneuver within the angular range of inspection. Barber et al. (2008) developed a street mapping system using a van and studied the elevation accuracy and planimetric accuracy of scanned data.
• Limit analysis of historical structures – in the survey and documentation of historical structures, shape and mechanical condition of historical structures can be used as an indication of the collapse load value and position which are obtained in the limit analysis. Geometric survey and documentation of historical structures using laser scanners can accelerate this process without jeopardizing the structures. Riveiro et al. (2011) demonstrated the use of a time-of-flight (TOF) laser scanner (Riegl LMS Z-390i 3D), a digital camera (Nikon D200), and a CCD sensor in the limit analysis of a medieval masonry arch bridge.
12.10 Laser safety
In laser-based sensing, potential hazard to the eye and skin from laser radiation are possible, depending on the laser wavelength, exposure duration, and viewing conditions. Specific safety measures must be obeyed, and safety procedures must be followed to avoid potential hazards, including:
• American National Standards Institute (ANSI) Z136.1 ‘Safe Use of Lasers,’ and Z136.3 ‘Safe Use of Lasers in Health Care Facilities’ (ANSI, 2012)
• Laser Institute of America (LIA) ‘Laser Safety Guide’ (LIA, 2012)
• US Department of Labor, Occupational Safety and Health Administration (OSHA) Technical Manual Section III: Chapter 6 'Laser Hazards' (OSHA, 2012)
Laser systems are categorized into five classes:
• Class 1: Very low power, eye-safe, output beam below maximum permissible exposure; safe to view.
• Class 2: Low-power visible lasers only; safe for brief (< 0.25 s) viewing; intentional extended viewing is considered hazardous.
• Class 3A: Medium power; safe for brief (< 0.25 s) viewing; direct beam should not be viewed with magnifying optics such as a microscope, binoculars, or telescope.
• Class 3B: Medium power; not safe for brief viewing of direct beam or specular reflections; control measures should eliminate this possibility.
• Class 4: High power; not safe for momentary viewing; potential for skin, fire, or diffuse reflection hazard.
Exposure times or exposure limits (EL) are used to quantitatively evaluate the level of potential hazards imposed to human inspectors, from one nanosecond (ns) to 8 h and for wavelengths between 180 nm in the ultraviolet (UV) spectrum (at the end of the ultraviolet C band; 100–280 nm) to 1 mm in the extreme end of IR spectrum (at the edge of microwave spectrum).
For example, the maximum permissible exposure (MPE) for a CO2 laser with wavelength 10.6 mm is 100 mW/cm2 for 10 s to 8 h for limited area exposure and 10 mW/cm2 for > 10 s for whole-body exposure. The MPE for a He–Ne laser with wavelength 632.8 nm is 3.2 mW/cm2 for 0.1 s and 1.0 mW/cm2 for 10 s. Other MPEs for various lasers can be found in ANSI Z136.1.
When using Class 3B and Class 4 lasers, eye protection is required wherever the exposure above the MPE of the laser occurs. ANSI Z136.1 provides general guidance for the use of eye protection devices.
12.11 Conclusion
Laser-based sensing has been a promising technology since its debut in 1960s and has been widely adopted in a variety of material characterization, damage/defect detection, and condition assessment applications in science and engineering. Owing to the flexibility of its energy level, the laser can be used as a tool for passive sensing or a source for active sensing, as well as either a nondestructive technique or a destructive technique. The integration of laser measurement with other imaging methodologies such as holography and tomography further enables laser-based sensing to be applied to the inspection problems that were previously considered difficult or impossible using laser and other sensing methods. This improvement on data visualization for laser-based sensing has fundamentally changed the face of laser-based sensing from a frequency-domain technique (spectroscopy) to a space domain technique. Although laser-based sensing basically measures the surface response of a target, it can be used to interrogate the subsurface region of a target when the optical energy carried by laser beams is converted to the mechanical energy to enable acoustic/ultrasonic waves propagating inward towards the target. When the surface response of a target can be successfully correlated to the subsurface condition of the target with the aid of theoretical and computational modeling, laser-based sensing can be used as an effective approach in some applications.
When applied in civil engineering applications, laser-based sensing is capable of accessing difficult to reach locations, non-invasive, remote, and relatively quick to set up in the field configuration. With all the promising technical capabilities possessed by the laser-based sensing techniques, laser safety remains a necessary concern in laboratory and in practice. Care must be taken when using high-power laser systems on large-size engineering structures (e.g., bridges, buildings, tunnels, railroads) for long inspection. Trade-offs between the safety and SNR (performance) of selected laser systems need to be assessed in the planning stage.