
Chapter 9
The Man with the Sprained Brain
Francis Galton (1822–1911) was a social snob who never worked to earn a living, except for a brief stint in a hospital during his early twenties.1 Yet he was one of the most charming and likable of the many characters mentioned in this account. He was Charles Darwin’s first cousin, an occasional inventor, and an avid explorer of parts of Africa where whites had never been seen. He made a seminal contribution to the theory of risk management, but he made that contribution in stubborn pursuit of an evil concept.
Measurement was Galton’s hobby—or, rather, obsession. “Wherever you can, count,” he would say.2 He took note of the size of heads, noses, arms, legs, heights, and weights, of the color of eyes, of the sterility of heiresses, of the number of times people fidgeted as they listened to lectures, and of the degree of color change on the faces of spectators at the Derby as they watched the horses run. He classified the degree of attractiveness of girls he passed on the street, pricking a hole in a left-pocket card when a girl was comely and pricking a right-pocket card when she was plain. In his “Beauty Map” of Britain, London girls scored highest; Aberdeen girls scored lowest. He examined 10,000 judges’ sentences and observed that most of them occurred at regular intervals of 3, 6, 9, 12, 15, 18, and 24 years, while none appeared at 17 and only a few at 11 or 13. At a cattle exhibition, he tabulated the guesses of 800 visitors as to the weight of an ox and found that the “average vox populi was correct to within one percent of the real value.”3
Galton’s Anthropometric Laboratory, which he established in 1884, measured and kept track of the range and character of every possible measurement of the human body, including even finger prints. Finger prints fascinated Galton because, unlike every other part of the body, their configuration never changes as a person grows older. In 1893, he published a 200-page book on the subject that soon led to the widespread use of finger printing by police.
Galton’s compulsion to measure was evident even on a trip to Africa in 1849 to hunt big game in what is now Namibia. When he arrived at a village of Hottentots, he discovered “figures that would drive the females of our land desperate—figures that could afford to scoff at Crinoline.”4 One woman in particular caught his attention.5 As a scientific man, he reported, he was “exceedingly anxious to obtain accurate measurements of her shape.” Unable to speak Hottentot and uncertain how to undertake this urgent piece of research, he still managed to achieve his goal:
Of a sudden my eye fell upon my sextant; the bright thought struck me, and I took a series of observations upon her figure in every direction. . . . [T]his being done, I boldly pulled out my measuring tape, and measured the distance from where I was to the place where she stood, and having thus obtained both base and angles, I worked out the results by trigonometry and logarithms.
Galton was the personification of the Victorian Englishman who strode the earth as though it were his private preserve. On another occasion during his hunting trip to Africa, he grew worried that the local chieftain might attack his camp. Clad in his red hunting coat, cap, and jackboots, he mounted an ox, charged up to the largest hut in the village, and forced the ox’s head into the hut. The camp was never attacked.
At another village, he committed a social gaffe by refusing to take part in a ritual in which the host gargles and then spits the liquid into the face of his guest. And when King Nangoro presented him with Princess Chapange for an evening of pleasure, Galton was aghast when she arrived for the occasion “raddled with ochre and butter.” “I was dressed in my one well-preserved suit of white linen, so I had her ejected with scant ceremony.”
King Nagoro found it hard to believe that there were places in the world inhabited entirely by people with white skins. To him, Galton and his friends were rare migratory animals or some kind of anomaly. One of Galton’s companions had to undress repeatedly before the king to prove that he was white all over.
Galton’s curiosity was insatiable. When a traveling circus came through Cambridge while he was studying there, he walked straight into the lion’s cage, only the fourth person to have done so in that circus’s history. He kept himself from falling asleep during his favorite studying hours of 10 p.m. to 2 a.m. with his “Gumption-Reviver machine,” a gadget he had invented that kept his head wet with cold water. Later in life, he invented a device for reading under water; he nearly drowned on one occasion when he submerged himself in his bath while enjoying a good book.
![]()
As we shall see shortly, Galton’s fascination with measurement and his talent for innovation had loathsome consequences. Still he must be credited with a remarkable contribution to statistics and to risk management. As with Cardano, his insistence on testing his ideas through experimentation led to new statistical theory even though a search for new theory was not his primary objective.
Galton moves us into the world of everyday life, where people breathe, sweat, copulate, and ponder their future. We are now far removed from both the gaming tables and the stars, the means chosen by earlier mathematicians to get their theories right. Galton took the theories as he found them and went on to discover what made them tick.
Although Galton never alludes to Jacob Bernoulli, his work reflects Bernoulli’s insistence that the study of probability is an essential tool for the analysis of disease, mental acuteness, and physical agility. And he follows in the footsteps of Graunt and Price, whose main interest was the organization of human society rather than the science of nature. What Galton and these other innovators learned along the way led ultimately to the emergence of today’s complex instruments for the control and measurement of risk in both business and finance.
![]()
Galton grew up in an environment of affluence and lively intellectual activity. His grandfather, Erasmus Darwin, was among the most famous physicians of his time and a man with many interests beyond medicine. He invented a ferry driven by machinery instead of pulled by animals and a lavatory that flushed, experimented with windmills and steam engines, and wrote The Loves of the Plants, 2,000 lines of poetry describing in scientific detail the reproductive processes of many different plants. In 1796, when he was 65 years old, Erasmus published a two-volume work called Zoonomia, or the Theory of Generations. Although the book went through three editions in seven years, it failed to impress the scientific community because it was rich in theory but poor in facts. Nevertheless, Zoonomia bears a striking resemblance to The Origin of the Species, published 63 years later by Erasmus’s more famous grandson, Charles Darwin.
At the age of four, Galton claimed, he could read any book written in English. He could recite “all the Latin Substantives and adjectives and active verbs besides 52 lines of Latin poetry” and could multiply by 2, 3, 4, 5, 6, 7, 10.6
He began to study medicine in Birmingham when he was 16 years old, but described his visits to the wards and the postmortems as “Horror-horror-horror!”7 After Charles Darwin advised him to “read Mathematics like a house on fire,” Galton headed to Cambridge to study math and the classics.8
Galton was 22 when his father died, leaving a substantial estate to his seven surviving children. Deciding that he could now do anything he liked, he soon chose to give up formal studies. Inspired by Darwin’s voyage to the Galápagos, he made the first of two trips to Africa, sailing up the Nile and then traveling by camel to Khartoum—a total distance of a thousand miles. After his return to England, he idled away four years and then made a second trip to Africa. He wrote a book about Africa in 1853 that gained him membership in the Royal Geographic Society, which awarded him a gold medal, and won him acceptance by the scientific community. In 1856, he was made a fellow of the Royal Society.
His second trip to Africa when he was 27 left Galton “rather used up in health,” the result of a combination of physical exhaustion and bouts of depression that were to recur often though briefly throughout his life. He referred to himself on those occasions as someone with a “sprained brain.”9
![]()
Galton was an amateur scientist with a keen interest in heredity but with no interest in business or economics. Yet his studies of “the ideal mean filial type,” “the parental type,” and “the average ancestral type” led him to a statistical discovery that is essential to forecasting and to risk management.
The study of heredity has to do with the transmission of key characteristics such as intelligence, eye color, size, and behavior from generation to generation. It takes note of the outliers—individuals whose characteristics do not conform to the norm—but it pays more attention to the tendency of all members of a species to look pretty much the same. Hidden within that tendency toward homogeniety—the tendency of the average to dominate—is a powerful statistical tool that relates to many aspects of risk management.
Galton’s primary goal was to understand how talent persists through generation after generation in certain families, including the Darwin family—and, not incidentally, the Bernoulli family. Galton had hoped to see that persistence of talent in his own progeny, but he and his wife were childless, as were both of his brothers and one of his sisters. Most of all, he sought to identify “natures preeminently noble” among members of the families he classified as the most highly talented.
In 1883, he labeled this field of study “eugenics,” a word whose Greek root means good or well. The adoption of the term a half-century later by the Nazis was associated with the extermination of millions of human beings whom they identified as utterly without talent, or any kind of worth.
Whether Galton should be charged with responsibility for that evil outcome has been the subject of spirited debate. There is nothing about the man to suggest that he would have condoned such barbaric behavior. For him, the good society was a society that had an obligation to help and educate “highly gifted” individuals, regardless of their wealth, social class, or racial background. He proposed inviting and welcoming “emigrants and refugees from other lands” to Britain and encouraging their descendants to become citizens. Yet at the same time he seems to have been looking for ways to limit the reproduction of people who were less talented or ill; he suggests that the good society would also be a society “where the weak could find a welcome and a refuge in celibate monasteries or sisterhoods.”10
Regardless of the uses to which others put Galton’s work in eugenics, its significance extends far beyond the parochial questions he addressed directly. In brief, it gave further credibility to the truism that variety is the spice of life. When Enobarbus paid homage to Cleopatra, he remarked, “Age cannot wither her, nor custom stale her infinite variety.” Though always the same woman, she was alternately lover, friend, cool, hot, temptress, enemy, submissive, and demanding. One person can be many.
We can recognize as an individual every one of 5-5 billion people alive today. Countless maples grow in the forests of Vermont, each of which is different from all the other maples, but none of which could be mistaken for a birch or a hemlock. General Electric and Biogen are both stocks listed on the New York Stock Exchange, but each is influenced by entirely different kinds of risk.
Which of the many guises of Cleopatra, of the billions of human beings alive today, of the maples, birches, and hemlocks in Vermont, or of the stocks listed on the New York Stock Exchange is the prototypical exemplar of its class? How much do the members of each class differ from one another? How much does a child in Uganda differ from an old woman in Stockholm? Are the variations systematic or merely the results of random influences? Again, what do we mean by normal anyway?
In searching for the answers to such questions, Galton makes little mention of early mathematicians and ignores social statisticians like Graunt. He does, however, cite at great length a set of empirical studies carried out in the 1820s and 1830s by a Belgian scientist named Lambert Adolphe Jacques Quetelet. Quetelet was twenty years older than Galton, a dogged investigator into social conditions, and as obsessed with measurement as Galton himself.11
![]()
Quetelet was only 23 years old when he received the first doctorate of science to be awarded by the new University of Ghent. By that time, he had already studied art, written poetry, and co-authored an opera.
He was also what the historian of statistics Stephen Stigler calls “an entrepreneur of science as well as a scientist.”12 He helped found several statistical associations, including the Royal Statistical Society of London and the International Statistical Congress, and for many years he was regional correspondent for the Belgian government’s statistical bureau. Around 1820, he became leader of a movement to found a new observatory in Belgium, even though his knowledge of astronomy at the time was scant. Once the observatory was established, he persuaded the government to fund a three-month stay in Paris so that he could study astronomy and meteorology and learn how to run an observatory.
During his time in Paris, he met many of the leading French astronomers and mathematicians, from whom he learned a good bit about probability. He may even have met Laplace, who was then 74 years old and about to produce the final volume of his masterpiece, Mécanique céleste. Quetelet was fascinated by the subject of probability. He subsequently wrote three books on the subject, the last in 1853. He also put what he learned about it to good—and practical—use.
Although Quetelet continued to work at the Royal Observatory in Brussels after he returned from Paris in 1820, he also carried on research relating to French population statistics and started to plan for the approaching census of 1829. In 1827, he published a monograph titled “Researches on population, births, deaths, prisons, and poor houses, etc. in the Kingdom of the Low Countries,” in which he criticized the procedures used in gathering and analyzing social statistics. Quetelet was eager to apply a method that Laplace had developed back in the 1780s to estimate France’s population. Laplace’s method called for taking a random sample from a diversified group of thirty départements and using the sample as the basis for estimating the total population.
A colleague soon persuaded Quetelet to abandon that approach. The problem was that the officials in charge of the French census would have no way of knowing how representative their sample might be. Each locality had certain customs and conventions that influenced the birth rate. Furthermore, as Halley and Price had discovered, the representative quality of a survey even in a small area could be affected by movements of the population. Unlike Enobarbus, Quetelet found too much variety in the French sociological structure for anyone to generalize on the basis of a limited sample. A complete census of France was decided upon.
This experience led Quetelet to begin using social measurement in a search to explain why such differences exist among people and places—whence the variety that adds the spice? If the differences were random, the data would look about the same each time a sample was taken; if the differences were systematic, each sample would look different from the others.
This idea set Quetelet off on a measurement spree, which Stigler describes as follows:
He examined birth and death rates by month and city, by temperature, and by time of day.-. . . He investigated mortality by age, by profession, by locality, by season, in prisons, and in hospitals. He considered . . . height, weight, growth rate, and strength . . . [and developed] statistics on drunkenness, insanity, suicides, and crime.13
The result was A Treatise on Man and the Development of His Faculties, which was first published in French in 1835 and subsequently translated into English. The French expression Quetelet chose for “faculties” was “physique social.” This work established Quetelet’s reputation. The author of a three-part review of it in a leading scholarly journal remarked, “We consider the appearance of these volumes as forming an epoch in the literary history of civilization.”14
The book consisted of more than just dry statistics and plodding text. Quetelet gave it a hero who lives to this very day: l’homme moyen, or the average man. This invention captured the public imagination and added to Quetelet’s growing fame.
Quetelet aimed to define the characteristics of the average man (or woman in some instances), who then became the model of the particular group from which he was drawn, be it criminals, drunks, soldiers, or dead people. Quetelet even speculated that “If an individual at any epoch of society possessed all the qualities of the average man, he would represent all that is great, good, or beautiful.”15
Not everyone agreed. One of the harshest critics of Quetelet’s book was Antoine-Augustin Cournot, a famous mathematician and economist, and an authority on probability. Unless we observe the rules of probability, Cournot maintained, “we cannot get a clear idea of the precision of measurements made in the sciences of observation . . . or of the conditions leading to the success of commercial enterprises.”16 Cournot ridiculed the concept of the average man. An average of all the sides of a bunch of right triangles, he argued, would not be a right triangle, and a totally average man would not be a man but some kind of monstrosity.
Quetelet was undeterred. He was convinced that he could identify the average man for any age, occupation, location, or ethnic origin. Moreover, he claimed that he could find a method to predict why a given individual belonged in one group rather than in another. This was a novel step, for no one up to that point had dared to use mathematics and statistics to separate cause and effect. “[E]ffects are proportional to causes,” he wrote, and then went on to italicize these words: “The greater the number of individuals observed, the more do peculiarities, whether physical or moral, become effaced, and allow the general facts to predominate, by which society exists and is preserved. “17 By 1836, Quetelet had expanded these notions into a book on the application of probability to the “moral and political sciences.”
Quetelet’s study of causes and effects makes for fascinating reading. For example, he carried out an extended analysis of the factors that influence rates of conviction among people accused of crimes. An average of 61.4% of all people accused were convicted, but the probability was less than 50% that they would be convicted for crimes against persons while it was over 60% that they would be convicted for crimes against property. The probability of conviction was less than 61.4% if the accused was a woman older than thirty who voluntarily appeared to stand trial instead of running away and who was literate and well educated. Quetelet also sought to determine whether deviations from the 61.4% average were significant or random: he sought moral certainty in the trials of the immoral.
Quetelet saw bell curves everywhere he looked. In almost every instance, the “errors,” or deviations from the average, obediently distributed themselves according to the predictions of Laplace and Gauss—in normal fashion, falling symmetrically along both sides of the average. That beautifully balanced array, with the peak at the average, was what convinced Quetelet of the validity of his beloved average man. It lay behind all the inferences he developed from his statistical investigations.
In one experiment, for example, Quetelet took chest measurements on 5,738 Scottish soldiers. He concocted a normal distribution for the group and then compared the actual result with the theoretical result. The fit was almost perfect.18
It had already been demonstrated that Gaussian normal distributions are typical throughout nature; now they appeared to be rooted in the social structures and the physical attributes of human beings. Thus, Quetelet concluded that the close fit to a normal distribution for the Scottish soldiers signified that the deviations around the average were random rather than the result of any systematic differences within the group. The group, in other words, was essentially homogeneous, and the average Scottish soldier was fully representative of all Scottish soldiers. Cleopatra was a woman before all else.
One of Quetelet’s studies, however, revealed a less than perfect fit with the normal distribution. His analysis of the heights of 100,000 French conscripts revealed that too many of them fell in the shortest class for the distribution to be normal. Since being too short was an excuse for exemption from service, Quetelet asserted that the measurements must have been distorted by fraud in order to accommodate draft-dodgers.
Cournot’s remark that the average man would be some sort of monstrosity reflected his misgivings about applying probability theory to social as opposed to natural data. Human beings, he argued, lend themselves to a bewildering variety of classifications. Quetelet believed that a normally distributed set of human measurements implied only random differences among the sample of people he was examining. But Cournot suspected that the differences might not be random. Consider, for example, how one might classify the number of male births in any one year: by age of parents, by geographical location, by days of the week, by ethnic origin, by weight, by time in gestation, by color of eyes, or by length of middle fingers, just to name a few possibilities. How, then, could you state with any confidence which baby was the average baby? Cournot claimed that it would be impossible to determine which data were significant and which were nothing more than the result of chance: “[T]he same size deviation [from the average] may lead to many different judgments.”19 What Cournot did not mention, but what modern statisticians know well, is that most human measurements reflect differences in nutrition, which means that they tend to reflect differences in social status as well.
Today, statisticians refer to the practice that stirred Cournot’s misgivings as “data mining.” They say that if you torture the data long enough, the numbers will prove anything you want. Cournot felt that Quetelet was on dangerous ground in drawing such broad generalizations from a limited number of observations. A second set of observations drawn from a group of the same size could just as likely turn up a different pattern from the first.
There is no doubt that Quetelet’s infatuation with the normal distribution led him to claim more than he should have. Nevertheless, his analysis was hugely influential at the time. A famous mathematician and economist of a later age, Francis Ysidro Edgeworth, coined the term “Quetelismus” to describe the growing popularity of discovering normal distributions in places where they did not exist or that failed to meet the conditions that identify genuine normal distributions.20
![]()
When Galton first came upon Quetelet’s work in 1863, he was deeply impressed. “An Average is but a solitary fact,” he wrote, “whereas if a single other fact be added to it, an entire Normal Scheme, which nearly corresponds to the observed one, starts potentially into existence. Some people hate the very name of statistics, but I find them full of beauty and interest.”21
Galton was enthralled by Quetelet’s finding that “the very curious theoretical law of the deviation from the average”—the normal distribution—was ubiquitous, especially in such measurements as body height and chest measurements.22 Galton himself had found bell curves in the record of 7,634 grades in mathematics for Cambridge students taking their final exam for honors in mathematics, ranging from highest to “one can hardly say what depth.”23 He found similar statistical patterns in exam grades among the applicants for admission to the Royal Military College at Sandhurst.
The aspect of the bell curve that impressed Galton most was its indication that certain data belonged together and could be analyzed as a relatively homogeneous entity. The opposite would then also be true: absence of the normal distribution would suggest “dissimilar systems.” Galton was emphatic: “This presumption is never found to be belied.”24
But it was differences, not homogeneity, that Galton was pursuing—Cleopatra, not the woman. In developing his new field of study, eugenics, he searched for differences even within groups whose measurable features seemed to fall into a normal distribution. His objective was to classify people by “natural ability,” by which he meant
. . . those qualities of intellect and disposition, which urge and qualify a man to perform acts that lead to reputation. . . . I mean a nature which, when left to itself, will, urged by an inherent stimulus, climb the path that leads to eminence, and has strength to reach the summit. . . . [M]en who achieve eminence, and those who are naturally capable, are, to a large extent, identical.”25
Galton began with the facts. During the years 1866 to 1869, he collected masses of evidence to prove that talent and eminence are hereditary attributes. He then summarized his findings in his most important work, Hereditary Genius (which includes an appendix on Quetelet’s work, as well as Galton’s own caustic appraisal of the typical prickly Bernoulli personality). The book begins with an estimate of the proportion of the general population that Galton believed he could classify as “eminent.” On the basis of obituaries in the London Times and in a biographical handbook, he calculated that eminence occurred among English people past middle age in a ratio of one to every 4,000, or about 5,000 people in Britain at that time.
Although Galton said that he did not care to occupy himself with people whose gifts fell below average, he did estimate the number of “idiots and imbeciles” among Britain’s twenty million inhabitants as 50,000, or one in 400, making them about ten times as prevalent as his eminent citizens.26 But it was the eminent ones he cared about. “I am sure,” he concluded, that no one “can doubt the existence of grand human animals, of natures preeminently noble, of individuals born to be kings of men.”27 Galton did not ignore “very powerful women” but decided that, “happy perhaps for the repose of the other sex, such gifted women are rare.”28
Galton was convinced that if height and chest circumference matched Quetelet’s hypotheses, the same should be true of head size, brain weight, and nerve fibers—and to mental capacity as well. He demonstrated how well Quetelet’s findings agreed with his own estimates of the range of Britons from eminence at one end to idiocy at the other. He arrived at “the undeniable, but unexpected conclusion, that eminently gifted men are raised as much above mediocrity as idiots are depressed below it.”29
But beyond all that, Galton wanted to prove that heredity alone was the source of special talents, not “the nursery, the school, the university, [or] professional careers.”30 And heredity did seem to matter, at least within the parameters that Galton laid out. He found, for example, that a ratio of one out of nine close relatives of 286 judges were father, son, or brother to another judge, a ratio far greater than in the general population. Even better, he found that many relatives of judges were also admirals, generals, novelists, poets, and physicians.a And heredity did seem to matter, at least within the parameters that Galton laid out. He found, for example, that a ratio of one out of nine close relatives of 286 judges were father, son, or brother to another judge, a ratio far greater than in the general population. Even better, he found that many relatives of judges were also admirals, generals, novelists, poets, and physicians.a (Galton explicitly excluded clergymen from among the eminent). He was disappointed to note that his “finger marks” failed to distinguish between eminent men and “congenital idiots.”31
Yet Galton discovered that eminence does not last long; as physicists would put it, eminence has a short half life. He found that only 36% of the sons of eminent men were themselves eminent; even worse, only 9% of their grandsons made the grade. He attempted to explain why eminent families tend to die out by citing their apparent habit of marrying heiresses. Why blame them? Because heiresses must come from infertile families, he argued; if they had had a large number of siblings with whom to share the family wealth, they would not have inherited enough to be classified as heiresses. This was a surprising suggestion, in view of the comfort in which Galton lived after sharing his father’s estate with six other siblings.
![]()
After reading Hereditary Genius, Charles Darwin told Galton, “I do not think I ever in my life read anything more interesting and original . . . a memorable work.”32 Darwin suggested that he go on with his analysis of the statistics of heredity, but Galton needed little encouragement. He was now well on his way to developing the science of eugenics and was eager to discover and preserve what he considered to be the best of humanity. He wanted the best people to have more offspring and the lowly to exercise restraint.
But the law of the deviation from the mean stood stubbornly in his way. Somehow he had to explain differences within the normal distribution. He realized that the only way he could do so was to figure out why the data arranged themselves into a bell curve in the first place. That search led him to an extraordinary discovery that influences most of the decisions we make today, both small and large.
Galton reported the first step in an article published in 1875, in which he suggested that the omnipresent symmetrical distribution around the mean might be the result of influences that are themselves arrayed according to a normal distribution, ranging from conditions that are most infrequent to conditions that are most frequent and then down to a set of opposite kinds of influences that again are less frequent. Even within each kind of influence, Galton hypothesized, there would be a similar range from least powerful to most powerful and then down again to least powerful. The core of his argument was that “moderate” influences occur much more often than extreme influences, both good and bad.
Galton demonstrated this idea with a gadget he called the Quincunx to the Royal Society around 1874.33 The Quincunx looked a lot like an up-ended pinball machine. It had a narrow neck like an hour-glass, with about twenty pins stuck into the neck area. At the bottom, where the Quincunx was at its widest, was a row of little compartments. When shot were dropped through the neck, they hit the pins at random and tended to distribute themselves among the compartments in classic Gaussian fashion—most of them piled up in the middle, with smaller numbers on either side, and so on in diminishing numbers.
In 1877, in conjunction with his reading of a major paper titled “Typical Laws of Heredity,” Galton introduced a new model of the Quincunx. (We do not know whether he actually built one). This model contained a set of compartments part way down, into which the shot fell and arrayed themselves as they had in the bottom compartments in the first model. When any one of these midway compartments was opened, the shot that had landed in it fell into the bottom compartments where they arrayed themselves—you guessed it—in the usual normal distribution.
The discovery was momentous. Every group, no matter how small and no matter how distinct from some other group, tends to array itself in accordance with the normal distribution, with most of the observations landing in the center, or, to use the more familiar expression, on the average. When all the groups are merged into one, as Quincunx I demonstrated, the shot also array themselves into a normal distribution. The grand normal, therefore, is an average of the averages of the small subgroups.
Quincunx II provided a mechanical version of an idea that Galton had discovered in the course of an experiment proposed by Darwin in 1875. That experiment did not involve dice, stars, or even human beings. It was sweet peas—or peas in the pod. Sweet peas are hardy and prolific, with little tendency to cross-fertilize. The peas in each pod are essentially uniform in size. After weighing and measuring thousands of sweet peas, Galton sent ten specimens of each of seven different weights to nine friends, including Darwin, throughout the British Isles, with instructions to plant them under carefully specified conditions.
After analyzing the results, Galton reported that the offspring of the seven different groups had arrayed themselves, by weight, precisely as the Quincunx would have predicted. The offspring of each individual set of specimens were normally distributed, and the offspring of each of the seven major groups were normally distributed as well. This powerful result, he claimed, was not the consequence of “petty influences in various combinations” (Galton’s italics). Rather, “[T]he processes of heredity . . . [were] not petty influences, but very important ones.”34 Since few individuals within a group of humans are eminent, few of their offspring will be eminent; and since most people are average, their offspring will be average. Mediocrity always outnumbers talent. The sequence of small-large-small distributions among the sweet peas—according to the normal distribution—confirmed for Galton the dominance of parentage in determining the character of offspring.
The experiment revealed something else, as the accompanying table of diameters of the parent peas and their offspring shows.
Diameter of Parent Seeds and Offspring35(In Hundredths of an Inch)

Note that the spread of diameters among the parents was wider than the dispersion among the offspring. The average diameter of the parents was 0.18 inches within a range of 0.15 to 0.21 inches, or 0.03 on either side of the mean. The average diameter of the offspring was 0.163 inches within a range of 0.154 to 0.173 inches, or only about 0.01 inches on either side of the mean. The offspring had an overall distribution that was tighter than the distribution of the parents.
This experiment led Galton to propound a general principle that has come to be known as regression, or reversion, to the mean: “Reversion,” he wrote, “is the tendency of the ideal mean filial type to depart from the parental type, reverting to what may be roughly and perhaps fairly described as the average ancestral type.”36 If this narrowing process were not at work—if large peas produced ever-larger offspring and if small peas produced ever-smaller offspring—the world would consist of nothing but midgets and giants. Nature would become freakier and freakier with every generation, going completely haywire or running out to extremes we cannot even conceive of.
Galton summarized the results in one of his most eloquent and dramatic paragraphs:
The child inherits partly from his parents, partly from his ancestry. . . . [T]he further his genealogy goes back, the more numerous and varied will his ancestry become, until they cease to differ from any equally numerous sample taken at haphazard from the race at large. . . . This law tells heavily against the full hereditary transmission of any gift. . . . The law is even-handed; it levies the same succession-tax on the transmission of badness as well as of goodness. If it discourages the extravagant expectations of gifted parents that their children will inherit all their powers, it no less discountenances extravagant fears that they will inherit all their weaknesses and diseases.37
This was bad news for Galton, no matter how elegantly he articulated it, but it spurred him on in his efforts to promote eugenics. The obvious solution was to maximize the influence of “the average ancestral type” by restricting the production of offspring at the low end of the scale, thereby reducing the left-hand portion of the normal distribution.
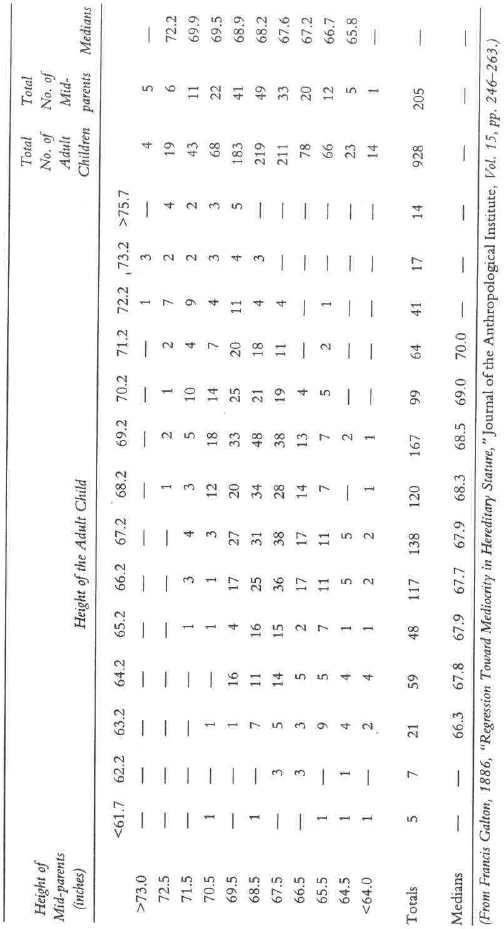
Galton found further confirmation of regression to the mean in an experiment that he reported in 1885, on the occasion of his election to the presidency of the British Association for the Advancement of Science. For this experiment, he had gathered an enormous amount of data on humans, data that he had received in response to a public appeal backed by an offer of cash. He ended up with observations for 928 adult children born of 205 pairs of parents.
Galton’s focus in this case was on height, or, in the language of his times, stature. His goal was similar to that in the sweet-pea experiment, which was to see how a particular attribute was passed along by heredity from parents to children. In order to analyze the observations, he had to adjust for the difference in height between men and women; he multiplied the female’s height in each case by 1.08, summed the heights of the two parents, and divided by two. He referred to the resulting entities as “mid-parents.” He also had to make sure that there was no systematic tendency for tall men to marry tall women and for short men to marry short women; his calculations were “close enough” for him to assume that there were no such tendencies.38
The results were stunning, as the accompanying table reveals. The diagonal structure of the numbers from lower left to upper right tells us at once that taller parents had taller children and vice versa—heredity matters. The clusters of larger numbers toward the center reveal that each height group among the children was normally distributed and that each set of children from each parental height group also was normally distributed. Finally, compare the furthest right-hand column to the furthest left-hand column. (“Median” means that half the group were taller and half were shorter than the number shown.) The mid-parents with heights of 68.5 inches and up all had children whose median heights were below the height of the mid-parents; the mid-parents who were shorter than 68.5 inches all had children who tended to be taller than they were. Just like the sweet peas.
The consistency of normal distributions and the appearance of regression to the mean enabled Galton to calculate the mathematics of the process, such as the rate at which the tallest parents tend to produce children that are tall relative to their peers but shorter relative to their parents. When a professional mathematician confirmed his results, Galton wrote, “I never felt such a glow of loyalty and respect towards the sovereignty and magnificent sway of mathematical analysis.”39
Galton’s line of analysis led ultimately to the concept of correlation, which is a measurement of how closely any two series vary relative to one another, whether it be size of parent and child, rainfall and crops, inflation and interest rates, or the stock prices of General Motors and Biogen.
Cross-Tabulation of 928 Adult Children Born of 205 Midparents, Sorted by Their Height and Their Midparent’s Height
Karl Pearson, Galton’s principal biographer and an outstanding mathematician himself, observed that Galton had created “a revolution in our scientific ideas [that] has modified our philosophy of science and even of life itself.”40 Pearson did not exaggerate: regression to the mean is dynamite. Galton transformed the notion of probability from a static concept based on randomness and the Law of Large Numbers into a dynamic process in which the successors to the outliers are predestined to join the crowd at the center. Change and motion from the outer limits toward the center are constant, inevitable, foreseeable. Given the imperatives of this process, no outcome other than the normal distribution is conceivable. The driving force is always toward the average, toward the restoration of normality, toward Quetelet’s homme moyen.
Regression to the mean motivates almost every variety of risk-taking and forecasting. It is at the root of homilies like “What goes up must come down,” “Pride goeth before a fall,” and “From shirtsleeves to shirtsleeves in three generations.” Joseph had this preordained sequence of events in mind when he predicted to Pharaoh that seven years of famine would follow seven years of plenty. It is what J.P. Morgan meant when he observed that “the market will fluctuate.” It is the credo to which so-called contrarian investors pay obeisance: when they say that a certain stock is “overvalued” or “undervalued,” they mean that fear or greed has encouraged the crowd to drive the stock’s price away from an intrinsic value to which it is certain to return. It is what motivates the gambler’s dream that a long string of losses is bound to give way to a long string of winnings. It is what my doctor means when he predicts that “tincture of time” will cure my complaints. And it is what Herbert Hoover thought was going to happen in 1931, when he promised that prosperity was just around the comer—unhappily for him and for everyone else, the mean was not where he expected it to be.
Francis Galton was a proud man, but he never suffered a fall. His many achievements were widely recognized. He ended a long, full life as a widower traveling and writing in the company of a much younger female relative. He never allowed his fascination with numbers and facts to blind him to the wonders of nature, and he delighted in diversity:
It is difficult to understand why statisticians commonly limit their inquiries to Averages, and do not revel in more comprehensive views. Their souls seem as dull to the charm of variety as that of the native of one of our flat English counties, whose retrospect of Switzerland was that, if its mountains could be thrown into its lakes, two nuisances would be got rid of at once.41
a Galton would surely have classified Cardano as eminent, but what would he have thought of Cardano’s disastrous progeny? Gauss, also an eminent man, scored better. He produced five surviving children, of whom one was a distinguished engineer and two of whom emigrated to the United States to run successful businesses (but also to escape from their father’s domineering influence); one of them was also a brilliant linguist, a gambler, and a skillful mathematician as well.
Notes
1. The biographical background on Galton is primarily from Forrest, 1974.
2. Newman, 1988e, p. 1142.
3. Ibid., p. 1143.
4. Kelves, 1985.
5. The details of these African anecdotes, including the quotations, are from Forrest, 1974, pp. 38–57.
6. Forrest, 1974, p. 4.
7. Ibid., p. 12.
8. Ibid., p. 12.
9. Newman, 1988e.
10. Galton, 1869, p. 20. This citation was brought to my attention by Stigler in personal correspondence.
11. The background material on Quetelet is from Keynes, 1921, pp. 334–335, and Stigler, 1986, pp. 161–182 and 206–268.
12. Stigler, 1986, p. 162.
13. Ibid., p. 169.
14. Ibid., p. 170.
15. Ibid., p. 171.
16. An excellent discussion of Cournot’s views on probability may be found in Stigler, 1986, pp. 195–201.
17. Stigler, 1986, p. 172.
18. A detailed description of Quetelet’s experiment may be found in Galton, 1869, in Newman’s abstract, p. 1157.
19. Stigler, 1986, p: 171.
20. Ibid., p. 203.
21. Forrest, 1974, p. 202.
22. Stigler, 1986, p. 268.
23. Forrest, 1974, p. 89.
24. Galton, 1883, p. 49. Also quoted in Stigler, 1986, p. 271.
25. Forrest, 1974, p. 92.
26. Ibid., p. 91.
27. Galton, 1869, from Newman’s abstract, p. 1153.
28. Forrest, 1974, p. 201.
29. Galton, 1869, in Newman’s abstract, p. 1162.
30. Forrest, 1974, p. 89.
31. Ibid., p. 217.
32. Ibid., p. 217.
33. Ibid., p. 101.
34. A detailed description of the Quincunx, including an illustration and photographs of Galton’s original notes, may be found in Stigler, 1986, pp. 275–281.
35. Stigler, 1986, p. 281.
36. Forrest, 1974, p. 189.
37. Ibid., p. 189.
38. Ibid., p. 190.
39. This discussion, including the table that follows, are from Stigler, 1986, pp. 283–290.
40. Stigler, 1986, p. 289.
41. Forrest, 1974, p. 199.