
Chapter 14. Building a Management Dashboard Solution
IN THIS CHAPTER
• Preparing the Management Console
• Creating Reporting Services Report with Report Builder 3.0
• Creating PerformancePoint Services Content
• Building and Deploying the PerformancePoint Dashboard
• Interacting with the BI Dashboard
The most common requirement within a business intelligence (BI) solution is to provide a management dashboard filled with scorecards, reports, charts, and graphs. This chapter provides an end-to-end solution for building out the presentation of BI information within a management dashboard.
Preparing the Management Console
The first step in building out the solution is laying down the BI foundation within your SharePoint environment. This includes several areas covered previously in this book.
Creating the Site Collection and Sites
Several planning questions need to be answered to build out the solution properly. Because the management dashboard will use PerformancePoint Services, the obvious location of the solution is within a Business Intelligence Center site collection.
However, you need to decide whether this is the main solution that will be hosted within the site collection or if this solution is one of many that will be contained within the site collection. You might want to provide overall results within the BI Center site collection but then have specific pages or subsites that focus on particular areas or departments within your organization.
Nonetheless, you need to create the main BI Center site collection first and then create any specific pages or sites below it if required. Figure 14.1 shows an example of this.
Figure 14.1. Company Performance site collection with departmental pages.

The solution details in this chapter do not depend on this structure, but the example involves a main site collection named Company Performance along with departmental pages below it using the Business Intelligence Center site templates.
The steps outlined at this point using the example are as follows:
- Create a Business Intelligence Center site collection named Company Performance.
- Create pages (or sites) for functional areas (for example, Finance, HR, Sales & Marketing).
Typically, creating pages for the functional areas within the BI site collection should suffice. Creating subsites adds overhead and might not be warranted based on requirements.
Customizing the Navigation
The Quick Launch (left-side navigation) displays several links within the site that may or may not be necessary for all users. In addition, when using pages to segregate functional areas, these pages do not appear in the Quick Launch or the top navigation. Therefore, the navigation of the site collection should be customized to provide a friendlier interface.
To customize the navigation, follow these steps:
- From the BI site collection, select Site Settings from the Site Actions menu.
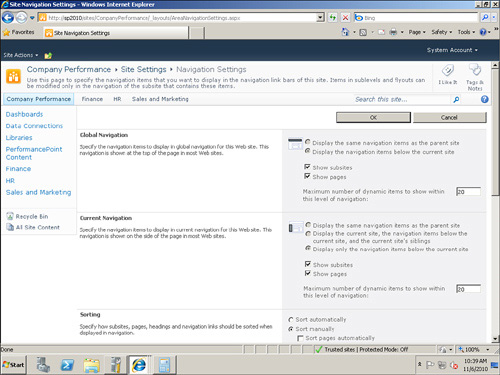
- Under the Look and Feel section, click the Navigation link. The Navigation Settings page appears.
- Within the Global Navigation and the Current Navigation sections, check the Show Pages option, as shown in Figure 14.2.
Figure 14.2. Modifying the global and current navigation to show pages.
- Scroll down to the Navigation Editing and Sorting section.
- Under the Current Navigation node, select the Dashboards entry and then click Delete from the menu bar in the window.
- Repeat the deletion for Data Connections, Libraries, and PerformancePoint Content.
- Select each sample page shown within the navigation and then click Hide from the menu bar in the window. (Optionally, you may navigate to the Pages library of the site collection and delete these pages as done for this example.)
- Select Current Navigation and click Add Heading. The Navigation Heading dialog appears.
- Enter the name of the main site into the Title field (Company Performance in this example).
- In the URL field, enter the root location of the site collection (for example, /sites/CompanyPerformance) or just click the Browse button (which defaults to the root location) and then click OK.
- Click OK within the Navigation Heading dialog. This action creates an entry in the Quick Launch for the main site; it already appears in the top navigation. The cleaned up navigation should now look similar to Figure 14.3.
Figure 14.3. Refined navigation structure settings.

- Click OK.
- Click Company Performance in the top or left navigation to return to your main site page. The modified navigation should look similar to Figure 14.4.
Figure 14.4. Modified navigation results.

Configuring Reporting Services
Because this solution requires Reporting Services, at this point Reporting Services needs to be installed and configured in SharePoint Integration mode if it has not been already. See Chapter 3, “Reporting Services Setup and Installation,” for specific instructions.
Configuring PerformancePoint Services
PerformancePoint Services is used in this solution. Therefore, the service application needs to be configured properly if it has not been already. See Chapter 6, “PerformancePoint Services Configuration,” for specific instructions on configuring PerformancePoint Services.
Deployed Solution
For the sample solution, the premise of the solution is to answer a high-level requirement of providing an answer to the Contoso management about the health of the company and identify areas that can be improved. The answer for this requirement is to build a dashboard that contains the information in a clean and concise manner. The sample dashboard built for the deployed solution displays information about Category Sales, Returns, and Trend information using the different BI components explained in earlier chapters of this book. Figure 14.5 shows the final solution.
Figure 14.5. Deployed BI solution.

The dashboard built is composed of several different BI components coming together to form the dashboard: Scorecard, Analytic Chart, and a SQL Server Reporting Services Report. In addition, the dashboard contains a filter on the Calendar Year that then filters and interacts with each of the dashboard components. The remaining parts of this chapter walk through the steps to build these components, create the dashboard to contain the content, connect the components filter, and then deploy and interact with the BI solution within the SharePoint site.
Creating a Reporting Services Report with Report Builder 3.0
Report Builder 3.0 is a user-friendly tool for developing reports. It is a component that was released along with SQL Server 2008 R2 and is available for download from the SQL Server 2008 R2 Feature Pack website. A report developed with Report Builder 3.0 can be rendered on a PerformancePoint Services dashboard. This is a convenient way of reusing existing reports while packaging them up as a component within a dashboard. To create a report from scratch using Report Builder 3.0, follow these steps:
- Create a data source, which defines where the data for the report will be retrieved (for example, a SQL Server Analysis Services cube or a SQL Server relational database).
- Create a dataset, which defines the query used to retrieve the report data from the data source.
- Create a report that renders the dataset.
This section covers creating a report from scratch with Report Builder 3.0. The report is then rendered in a PerformancePoint Services dashboard within SharePoint. Figure 14.6 shows the sample report layout.

The report shows quarterly sales by product category for a given year. In addition, the report includes a sparkline that shows the sales figures in a line chart within a single cell. The sparkline is one of the new visualizations available in SQL Server Reporting Services 2008 R2.
Create a Data Source
It is a best practice to create shared data sources; that is, define a data source, store it in a SharePoint library, and then reference the data source from multiple reports. A data source can also be defined within a report, but then it is available only to that report. Follow these steps to create a shared data source:
- Navigate to a SharePoint library.
- Click the Documents tab under Library Tools and then click the New Document icon on the ribbon bar, as shown in Figure 14.7.
Figure 14.7. Create a data source.

- Select Report Data Source from the drop-down menu. See the “Add Content Types to a Document Library” section in Chapter 3 for the configuration required to see Report Data Source in the New Document drop-down menu.
- Fill in the data source Properties dialog, as shown in Figure 14.8. As an example, this data source is for a SQL Server Analysis Services cube. In the following example, SharePoint2010 is the name of the server running Analysis Services. The connection string must be entered as text; there is no help available that prompts for the individual components of the connection string.
Figure 14.8. Data source properties.

- Click the Test Connection button to make sure that it works.
- Check Enable This Data Source to make the data source available for use.
Because there is no built-in support for locating your data sources, your Information Systems staff should create the shared data sources in the appropriate SharePoint library.
Create a Dataset
A dataset is simply a query that retrieves information from a data source. The query includes the data columns that you want to render on your report. It is a best practice to create shared datasets. As the name implies, a shared dataset can be used in multiple reports. Follow these steps to create a shared dataset:
- Launch Report Builder 3.0 and click New Dataset on the Getting Started dialog, as shown in Figure 14.9.
Figure 14.9. Report Builder Getting Started dialog.

- Choose a data source from the available list, as shown in Figure 14.10. To browse for a data source, click the Browse Other Data Sources hyperlink and then navigate to a document library that contains data sources. Click the Create button after selecting a data source.
- After you select a data source, the query designer is displayed, as shown in Figure 14.11.

- Choose the query parameters to filter the dataset.
- Choose the measures and dimensions and add them to the query fields.

Figure 14.11 has the following annotations:
• Select Cube: Click the ellipsis button to select the cube for the query. An Analysis Services database can contain one or more cubes.
• Query Fields: Drag and drop fields from the Measures and Dimensions onto this area. These fields will be returned in the query results.
• Query Parameters: Drag and drop fields from the Measures and Dimensions onto this area to filter the query.
Figure 14.12 shows the query designer completed for the sample report along with a portion of the query results.
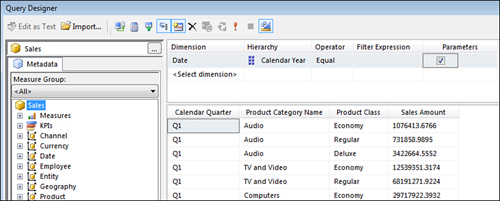
Save the shared dataset by clicking the disk icon near the top left of the window shown in Figure 14.12. Specify SalesByCategory as the name of the query. This query will be used in the next section to create the report.
Create a Report
After creating a data source and a dataset, you are now ready to create a report. Report Builder 3.0 provides wizards and a WYSIWYG designer that makes the report authoring process very easy. You should have Report Builder 3.0 already open from the prior steps; if not then open it from the Microsoft SQL Server 2008 R2 Report Builder program group. Follow these steps to create a report:
- Select New Report from the Getting Started dialog.
- Select Table or Matrix Wizard, as shown in Figure 14.13. The wizard is launched and will guide you through the remaining steps to create your report.
- Choose a dataset as shown in Figure 14.14. The options are to choose an existing dataset, click the Browse button to navigate to a shared dataset in a SharePoint library, or create a dataset. Creating a dataset will store the dataset definition in the report, and it will not be available to any other report. Choose the SalesByCategory dataset from the list of datasets or click Browse to navigate to the SharePoint library that contains your dataset.
Figure 14.14. Choose a dataset.

- Specify row groups, column groups, and values on the Arrange Fields page of the wizard as shown in Figure 14.15. Drag and drop the available fields into the row group, column group, or value as appropriate.

- Select a layout from one of the available options on the Choose the Layout page of the wizard, as shown in Figure 14.16.
Figure 14.16. Choose a layout.

- Select a style from one of the available options on the Choose a Style page of the wizard, as shown in Figure 14.17.


The Getting Started dialog is displayed when you open Report Builder 3.0 if the option show the getting started dialog on startup is checked. If you do not see the Getting Started dialog, click the icon in the top left corner of the Report Builder window and select New to display it. You can also click the icon in the top left corner of the Report Builder window and click the Options button to change the show the getting started dialog on startup setting.
After you complete the New Table or Matrix Wizard, the report layout will look like Figure 14.18.

At this point the tabular section of the report is complete. Let’s add a sparkline to the report which will render a chart of the quarterly sales figures in a column within each row. Follow these steps to add the sparkline to the report:
- Right-click the Total column and then select Insert Column, Right from the drop-down menu to add a column to the report.
- Click the Insert tab and then click the sparkline icon on the ribbon bar, as shown in Figure 14.19.
Figure 14.19. Insert a sparkline.

- Click the middle row of the report layout in the column just added to place the sparkline there. Select the sparkline type from the dialog, as shown in Figure 14.20.
Figure 14.20. Select a sparkline type.

- Figure 14.21 shows the final report layout.
Figure 14.21. Final report layout.

- Click in the cell that contains the sparkline and then fill in the chart data, as shown in Figure 14.22.
Figure 14.22. Sparkline settings.
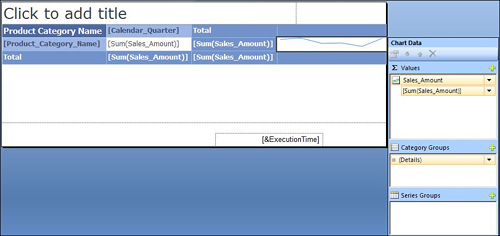
This completes the report layout; the sparkline will plot the sales total for each calendar quarter.
Creating PerformancePoint Content
Using the Dashboard Designer, the following PerformancePoint Services objects are created for use in the solution:
• Analysis Services data connections
• Key performance indicators (KPIs)
• Scorecards
• Analytic chart reports
• SQL Server Reporting Services reports
• Filters
For help in starting the Dashboard Designer, refer to Chapter 7, “PerformancePoint Services Development.”
Creating the Analysis Services Data Connection
Before creating any of the additional PerformancePoint Services content items, you create an Analysis Services data connection.
To create an Analysis Services data connection, follow these steps:
- Click the Data Connections folder within Dashboard Designer and select the Create tab.
- Click the data source icon and select the Analysis Services template and click OK.
- Enter the server name.
- Select SSAS Database from the Database drop-down.
- Select SSAS Cube from the Cube drop-down.
For this solution, we are going to use the unattended service account that was configured for PerformancePoint Services in Chapter 6, “PerformancePoint Services Configuration.”
- Click the Test Data Source button.
Figure 14.23 displays the populated values on the Editor tab.
Figure 14.23. SSAS Data Connection Editor tab.

- Click the Properties tab and supply a name for the data connection.
Creating the Scorecard and KPIs
Sales and Returns KPIs are going to be created for the solution comparing total dollars to expected dollars and comparing total quantities to expected quantities. Objective KPIs are created for organizing Sales and Returns information. After the KPIs are developed, you create a scorecard as the container for the KPIs. The following processes show how to create these objects for the BI solution.
To create the Sales Amount KPI, follow these steps:
- Click the PerformancePoint Content folder within Dashboard Designer and select the Create tab.
- Click the KPI icon and select Blank KPI and click OK.
- On the Actual line, click the 1 (Fixed Values) link under the Data Mappings column.
- Click the Change Source button.
- Select SSAS Data Connection and click OK.
- Select Sales Amount from the list of measures and click OK.
- Click the Default link under the Calculation column.
- On the Calculation screen, select Data from the list and click OK.
- Click the (Default) link in the Number Format column.
- Select Currency from the list and click OK.
- On the Target line, click the 1 (Fixed Values) link under the Data Mappings column.
- Click the Change Source button.
- Select SSAS Data Connection and click OK.
- Select Adjusted Sales Quota from the list of measures and click OK.
- Click the (Default) link in the Number Format column.
- Select Currency from the list and click OK.
- Click the Set Scoring Pattern and Indicator button.
- Select the default of Increasing Is Better as the scoring pattern and Band by Normalized Value of ActualTarget as the banding method and click Next.
- Select the Stoplight indicator and click Next.
- Enter the worst value of 0 and click Finish.
- Update the thresholds as shown in Figure 14.24.
Figure 14.24. Sales Amount KPI.

- Click the Properties tab and supply a name for the KPI: Sales Amount.
- Click Save.
To create the Sales Quantity KPI, follow these steps:
- Click the PerformancePoint Content folder within Dashboard Designer and select the Create tab.
- Click the KPI icon and select Blank KPI and click OK.
- On the Actual line, click the 1 (Fixed Values) link under the Data Mappings column.
- Click the Change Source button.
- Select SSAS Data Connection and click OK.
- Select Sales Quantity from the list of measures and click OK.
- Click the Default link under the Calculation column.
- On the Calculation screen, select Data from the list and click OK.
- Click the (Default) link in the Number Format column.
- Select Number from the list and click OK.
- On the Target line, click the 1 (Fixed Values) link under the Data Mappings column.
- Click the Change Source button.
- Select SSAS Data Connection and click OK.
- Select Adjusted Sales Quota Quantity from the list of measures and click OK.
- Click the (Default) link in the Number Format column.
- Select Number from the list and click OK.
- Click the Set Scoring Pattern and Indicator button.
- Select the default of Increasing Is Better as the scoring pattern and Band by Normalized Value of ActualTarget as the banding method and click Next.
- Select the Stoplight indicator and click Next.
- Enter the worst value of 0 and click Finish.
- Update the thresholds as shown in Figure 14.25.
Figure 14.25. Sales Quantity KPI.

- Click the Properties tab and supply a name for the KPI: Sales Quantity.
- Click Save.
To create the Return Amount KPI, follow these steps:
- Click the PerformancePoint Content folder within Dashboard Designer and select the Create tab.
- Click the KPI icon, select Blank KPI, and click OK.
- On the Actual line, click the 1 (Fixed Values) link under the Data Mappings column.
- Click the Change Source button.
- Select SSAS Data Connection and click OK.
- Select Sales Return Amount from the list of measures and click OK.
- Click the Default link under the Calculation column.
- On the Calculation screen, select Data from the list and click OK.
- Click the (Default) link in the Number Format column.
- Select Currency from the list and click OK.
- On the Target line, click the 1 (Fixed Values) link under the Data Mappings column.
- Click the Change Source button.
- Select SSAS Data Connection and click OK.
- Select Return Quota Amount from the list of measures and click OK.
- Click the (Default) link in the Number Format column.
- Select Currency from the list and click OK.
- Click Set Scoring Pattern and the Indicator button.
- Select Decreasing Is Better as the scoring pattern and Band by Stated Score (Advanced) as the banding method and click Next.
- Select the Stoplight indicator and click Next.
- Click the Specify Data Mapping button.
- Click the Change Source button.
- Select SSAS Data Connection and click OK.
- Select the Return Amount Variance measure from the list of measures and click OK.
- Click the Finish button.
- Update the thresholds as shown in Figure 14.26.
Figure 14.26. Return Amount KPI.

- Click the Properties tab and supply a name for the KPI: Return Amount.
- Click Save.
To create the Return Quantity KPI, follow these steps:
- Click the PerformancePoint Content folder within Dashboard Designer and select the Create tab.
- Click the KPI icon, select Blank KPI, and click OK.
- On the Actual line, click the 1 (Fixed Values) link under the Data Mappings column.
- Click the Change Source button.
- Select SSAS Data Connection and click OK.
- Select Sales Return Quantity from the list of measures and click OK.
- Click the Default link under the Calculation column.
- On the Calculation screen, select Data from the list and click OK.
- Click the (Default) link in the Number Format column.
- Select Number from the list and click OK.
- On the Target line, click the 1 (Fixed Values) link under the Data Mappings column.
- Click the Change Source button.
- Select SSAS Data Connection and click OK.
- Select Return Quota Quantity from the list of measures and click OK.
- Click the (Default) link in the Number Format column.
- Select Number from the list and click OK.
- Click the Set Scoring Pattern and Indicator button.
- Select Decreasing Is Better as the scoring pattern and Band By Stated Score (Advanced) as the banding method and click Next.
- Select the Stoplight indicator and click Next.
- Click the Specify Data Mapping button.
- Click the Change Source button.
- Select SSAS Data Connection and click OK.
- Select the Return Quantity Variance measure from the list of measures and click OK.
- Click the Finish button.
- Update the thresholds as shown in Figure 14.27.
Figure 14.27. Return Quantity KPI.

- Click the Properties tab and supply a name for the KPI: Return Quantity.
- Click Save.
To create the Company Sales Objective KPI, follow these steps:
- Click the PerformancePoint Content folder within Dashboard Designer and select the Create tab.
- Click the KPI icon and select Objective KPI and click OK.
- Supply a name for the KPI: Company Sales.
- Click Save.
To create the Company Returns Objective KPI, follow these steps:
- Click the PerformancePoint Content folder within Dashboard Designer and select the Create tab.
- Click the KPI icon, select Objective KPI, and click OK.
- Supply a name for the KPI: Company Returns.
- Click Save.
After creating the KPIs, create the PerformancePoint scorecard, as follows:
- Click the PerformancePoint Content folder within Dashboard Designer and select the Create tab and click the Scorecard icon.
- Click the Microsoft Category and Analysis Services template and click OK.
- Click the Analysis Services data source to use for the scorecard and click Next.
- On the Select a KPI Source screen, keep the default of Create KPIs from SQL Server Analysis Services Measures and click Next.
- Click the Select KPI button to import KPIs from the workspace or SharePoint site.
- Select each KPI to import (Sales Amount, Sales Quantity, Return Amount, Return Quantity, Company Sales, and Company Returns), click OK, and then click the Next button.
- No Measure filters will be added. Click the Next button.
- No Column Members will be selected. Click Finish.
- Supply a name for the scorecard: Yearly Company Sales and Returns.
The initial wizard brings over the KPIs in a nonformatted order. So, now you must format the scorecard to assign the numeric KPIs to the object KPIs.
- Click the Edit tab.
- Click the Company Sales KPI, and in the Header section of the Edit tab, click the Up arrow until the Company Sales KPI is on top.
- Click the Sales Amount KPI and move the KPI using the same method for the Company Sales KPI until it is below the Company Sales KPI.
- Click the Sales Quantity KPI and move the KPI until it is below the Sales Amount KPI.
- Highlight both the Sales Amount and Sales Quantity KPIs, and then click the Increase Indent icon in the Header section of the Edit menu to move the KPIs as belonging to the Company Sales KPI. The Company Sales KPI should now have a plus sign because a tree has now been created.
- Perform the same steps for the Company Returns, Return Amount, and Return Quantities KPIs, making the Return Amount and Return Quantity KPIs belong to the Company Returns KPI.
- Click the Update icon in the View section of the Edit menu to see the data for the KPIs come across in the scorecard.
- Click Save.
Figure 14.28 displays the newly created scorecard.
Figure 14.28. Yearly Company Sales and Returns scorecard.

Creating Reports
For the BI solution, two types of reports are going to be created in PerformancePoint Services: analytic charts and Reporting Services reports. The analytic chart is created from scratch by dragging dimensions and measures onto a new report. The Reporting Services report references a SharePoint integrated Reporting Services report.
To create an analytic chart report, follow these steps:
- Click the PerformancePoint Content folder within Dashboard Designer and select the Create tab.
- Click the Analytic Chart icon.
- Select SSAS Data Connection and click Finish.
- Type in the name of the report: Category Product Returns.
- Expand the Dimensions and Geography dimension on the right side in the Details section and drag the Continent Name field into the Series area of the report.
- Expand the Product dimension and drag the Category Name field into the Bottom Axis area of the report.
- Expand the Measures section and drag the Sales Return Amount field into the Background area of the report.
- Expand the Date dimension and drag the Calendar Year field into the Background area of the report. The Calendar Year field is going to be used for a filter but not displayed within the report.
- For the solution, the report type is going to use the Stacked Bar Chart. Click the Edit tab and click the Report Type icon and select Stacked Bar Chart from the list.
The report should populate with data automatically. The report is displayed in Figure 14.29.
Figure 14.29. Category Product Returns report.

- Click Save.
To connect to the Reporting Services report, follow these steps:
- Click the PerformancePoint Content folder within Dashboard Designer and select the Create tab.
- Click the Reporting Services icon.
Dashboard Designer within SharePoint 2010 requires the Microsoft Report Viewer 2008. If you do not have Microsoft Report Viewer 2008 installed you will be prompted as such. Use the link in the message box to download and install Microsoft Report Viewer 2008. Restarting Dashboard Designer after installation allows the report form to be opened.
- Select SharePoint Integrated from the Server Mode drop-down.
- In the Report Server URL textbox, type in the report server URL.
- In the Report URL textbox, type in the report URL pointing to the Quarterly Sales by Category and Year.rdl path.
- Uncheck the Show Toolbar and Show Parameters icons.
- Select 75 for the Zoom value.
The DateCalendarYear parameter of the report should be shown in the Parameters list.
- For reports that require a default value in the parameter in order to display the report, update the Report parameters section to add a default value for each parameter in the report. Click the Edit button to change the default value. For the report, the default value is Year 2007.
- Click the Preview button.
The report will display in the Preview section.
- Click the Properties tab and type in the name of the report: Quarterly Sales by Category.
- Click Save.
Figure 14.30 shows the configuration of the report.
Figure 14.30. Quarterly Sales by Category Reporting Services report.

Creating the Filter
Filters provide the ability for a user to interact with the dashboard. The dashboard is set up to connect each of the dashboard’s report items to the filter itself; this creates a similar view of data across the different analytical components of the dashboard.
To create a filter, follow these steps:
- Click the PerformancePoint Content folder within Dashboard Designer and select the Create tab.
- Click the Filter icon and select the Member Selection template and click OK.
- Select SSAS Data Connection and click Next.
- Click the Select Dimension button.
- Select Date.Calendar Year and click OK.
- Click the Select Members button.
- Right-click the All Date member and choose Select Children from the menu and click OK and then click Next.
- Click Multi-Select Tree and click Finish.
- Click the Properties tab and add a name to the Name textbox. For this filter, type in Date Calendar Year Filter.
- Click Save.
Building and Deploying the PerformancePoint Dashboard
After building the components that make up the dashboard, you then develop them by creating multiple zones for the dashboard, dragging the content items into the zones, and then connecting the filters to the items for user interaction.
To build the dashboard, follow these steps:
- Click the PerformancePoint Content folder within Dashboard Designer and select the Create tab.
- Click the Dashboard icon and select the 3 Rows template and click OK.
- Provide a name for the Dashboard: BI End to End Solution.
- In the Pages section, provide a name for the page: BIEndtoEnd.
- Expand the Filters tree and drag the Date Calendar Year Filter into the Top Row zone.
- Expand the Scorecards tree and drag the Yearly Company Sales and Returns scorecard into the Center Row zone.
- Expand the Reports tree and drag the Category Product Returns report into the Center Row zone to the right of the Yearly Company Sales scorecard.
- From the Reports tree, drag the Quarterly Sales by Category report to the Bottom Row zone.
- Now that the items have been created onto the dashboard, connect the content items to the Date Calendar Year filter.
- Click the drop-down arrow for the Yearly Company Sales and Returns scorecard in the Center Row zone and select Create Connection, as shown in Figure 14.31.
- On the Items tab, select the Get Values From as the Top Row – (1) Date Calendar Year filter.
- Click the Values tab and leave the default Page in the Connect To field.
- Select Source Value as the member unique name and click OK.
The Values tab should be configured as shown in Figure 14.32.
Figure 14.32. Connection Values tab.

- Click the drop-down arrow for the Category Product Returns item in the Center Row zone and select Create Connection.
- On the Items tab, select the Get Values From as the Top Row – (1) Date Calendar Year filter.
- Click the Values tab and select Date.Calendar Year from the Connect to drop-down.
- Select Source Value as the member unique name and click OK.
- Click the drop-down arrow for the Quarterly Sales by Category report in the Bottom zone and select Create Connection.
- On the Items tab, select the Get Values From as the Top Row – (1) Date Calendar Year filter.
- Click the Values tab and the DateCalendarYear parameter is selected in the Connect To drop-down.
- Select Source Value as the member unique name and click OK.
As shown in Figure 14.33, all items within the dashboard should now have a connection item pointing to the Date Calendar Year filter.
Figure 14.33. Dashboard layout.

- Click the Properties tab and click the Browse button on the Document Library entry and select the Dashboard library.
- For the Master Page drop-down, select the Minimal master page.
- Click Save.

After building the dashboard, the dashboard is ready for deployment. To deploy the dashboard, just click the Office icon in the upper-left of the Dashboard Designer and select Deploy from the menu, as shown in Figure 14.34.
Figure 14.34. Dashboard deployment.

An Internet Explorer window displays the BI Solution dashboard within the SharePoint site.
Interacting with the BI Dashboard
After you deploy the BI End to End Solution dashboard, users can interact with its data.
The initial interaction is to apply a different date value from the Date Calendar Year filter than is on the dashboard. When the filter is being applied, all items that are connected to the filter display an Updating message, as shown in Figure 14.35.
Figure 14.35. Dashboard filter updates.

Because the dashboard contains an analytic chart, users can right-click a chart item and select Decomposition Tree from the menu, as shown in Figure 14.36.
Figure 14.36. Decomposition Tree menu.

The Show Details and Decomposition Tree menu items are only available if you are using a measure that is not a calculated measure in the cube. If the measure is calculated, Show Details is disabled and the Decomposition Tree menu item will not appear.
Clicking Decomposition Tree from the menu brings up a new window that enables users to interact with the data by clicking through different dimensions within the cube and following the trail from the original view of the data to the details that are making up the aggregated values. Figure 14.37 shows a sample Decomposition Tree interaction with the Contoso Retail cube.
Figure 14.37. Decomposition Tree window.

In the Yearly Company Sales and Returns scorecard, the KPIs that were developed earlier in this chapter changed the calculation from Default to Data Value. By changing the KPI’s calculation property in the design, users interacting with the KPI in a dashboard can then drill into the aggregated value using the Decomposition Tree menu item or by viewing the details by right-clicking the value and selecting the Show Details in the menu. Figure 14.38 displays sales amount detail from the Contoso Retail cube.
Figure 14.38. Scorecard value details.

In addition to the previous examples, users can change the analytic chart type to a different report type, add additional measures to the chart, filter values within the scorecard, export report values to Excel, and perform many other PerformancePoint actions that come with the PerformancePoint toolset.
Summary
This chapter stepped through the end-to-end process of creating and deploying a management dashboard console. The process detailed the initial creation of a SharePoint site, the development of a Reporting Services report using Report Builder, the building of PerformancePoint content, the connecting of all content items on a dashboard via a filter and how a user interacts with the solution. The solution utilizes PerformancePoint Services and Reporting Services within SharePoint 2010 to provide a visualization of business performance using the Microsoft Business Intelligence toolset.
Best Practices
The following are best practices from this chapter:
• Typically, creating pages for the functional areas within the BI site collection should suffice. Subsites add additional overhead and might not be warranted based on requirements.
• The navigation of the BI site collection should be customized to provide a friendlier interface.
• Create shared data sources and shared datasets instead of embedding these in reports. Doing so frees business users from having to deal with these details and enables them to make some changes without editing individual reports.
• Out of the box, a minimal PerformancePoint master page is available to use for the dashboard formatting. In order to customize the look and feel of the dashboard to conform with the rest of the site, create custom master pages and apply that master page during the deployment of the dashboard.