
3. A Primer on Financial Time Series Analysis
This chapter serves two purposes: First, it gives a very brief refresher on the basic concepts in probability and statistics, and introduces the bivariate linear regression model. Second, it gives an introduction to time series analysis with a focus on the models most relevant for financial risk management. An important goal of the second part of the chapter is to ensure that the reader avoids some common pitfalls encountered by risk managers working with time series data such as prices and returns. These pitfalls can be summarized as: (1) Spurious detection of mean-reversion, (2) spurious significance in regressions, and (3) spurious detection of causality.
Keywords: Probability, distributions, moments, regression, ARMA, maximum likelihood, VAR.
1. Chapter Overview
This chapter serves two purposes: First, it gives a very brief refresher on the basic concepts in probability and statistics, and introduces the bivariate linear regression model. Second, it gives an introduction to time series analysis with a focus on the models most relevant for financial risk management. The chapter can be skipped by readers who have recently taken a course in time series analysis or in financial econometrics.
The material in the chapter is organized in the following four sections:
1. Probability Distributions and Moments
2. The Linear Model
3. Univariate Time Series Models
4. Multivariate Time Series Models
The chapter thus tries to cover a broad range of material that really would take several books to do justice. The section “Further Resources” at the end of the chapter therefore suggests books that can be consulted for readers who need to build a stronger foundation in statistics and econometrics and also for readers who are curious to tackle more advanced topics in time series analysis.
An important goal of the financial time series analysis part of the chapter is to ensure that the reader avoids some common pitfalls encountered by risk managers working with time series data such as prices and returns. These pitfalls can be summarized as
• Spurious detection of mean-reversion; that is, erroneously finding that a variable is mean-reverting when it is truly a random walk
• Spurious regression; that is, erroneously finding that a variable x is significant in a regression of y on x
• Spurious detection of causality; that is, erroneously finding that the current value of x causes (helps determine) future values of y when in reality it cannot
Before proceeding to these important topics in financial time series analysis we first provide a quick refresher on basic probability and statistics.
2. Probability Distributions and Moments
The probability distribution of a discrete random variable, x, describes the probability of each possible outcome of x. Even if an asset price in reality can only take on discrete values (for example $14.55) and not a continuum of values (for example $14.55555.....) we usually use continuous densities rather than discrete distributions to describe probability of various outcomes. Continuous probability densities are more analytically tractable and they approximate well the discrete probability distributions relevant for risk management.
2.1. Univariate Probability Distributions
Let the function F(x) denote the cumulative probability distribution function of the random variable x so that the probability of x being less than the value a is given by
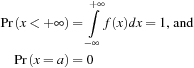
The expected value or mean of x captures the average outcome of a draw from the distribution and it is defined as the probability weighted average of x
Variance is a measure of the expected variation of variable around its mean. It is defined by
Note that

From this note, if we define a variable  and if the mean of x is zero and the variance of x is one then
Mean and variance are the first two central moments. The third and fourth central moments, also known as skewness and kurtosis, are defined by:

As an example consider the normal distribution with parameters  and
and  . It is defined by

2.2. Bivariate Distributions
When considering two random variables x and y we can define the bivariate density f(x, y) so that
Covariance is the most common measure of linear dependence between two variables. It is defined by
From the covariance and variance definitions we can define correlation by
A perfect positive linear relationship between x and y would exist if  , in which case
2.3. Conditional Distributions
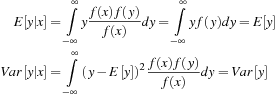
Risk managers often want to describe a variable y using information on another variable x. From the joint distribution of x and y we can denote the conditional distribution of y given x, f(y|x). It must be the case that

If x and y are independent then  and so
  and we have that the conditional moments
2.4. Sample Moments
We now introduce the standard methods for estimating the moments introduced earlier.
Consider a sample of T observations of the variable x, namely  . We can estimate the mean using the sample average

The sample covariances between two random variables can be estimated via
3. The Linear Model
Risk managers often rely on linear models of the type
In the linear model the unconditional expectations of x and y are linked via
We also have that
Consider observation t in the linear model
3.1. The Importance of Data Plots
While the linear model is useful in many cases, an apparent linear relationship between two variables can be deceiving. Consider the four (artificial) data sets in Table 3.1, which are known as Anscombe's quartet, named after their creator. All four data sets have 11 observations.
Consider now the moments of the data included at the bottom of the observations in Table 3.1. While the observations in the four data sets are clearly different from each other, the mean and variance of the x and y variables is exactly the same across the four data sets. Furthermore, the correlation between x and y are also the same across the four pairs of variables. Finally, the last two rows of Table 3.1 show that when regressing y on x using the linear model
Figure 3.1 scatter plots y against x in the four data sets with the regression line included in each case. Figure 3.1 is clearly much more revealing than the moments and the regression results.
 |
| Figure 3.1 |
We conclude that moments and regressions can be useful for summarizing variables and relationships between them but whenever possible it is crucial to complement the analysis with figures. When plotting your data you may discover:
• A genuine linear relationship as in the top-left panel of Figure 3.1
• A genuine nonlinear relationship as in the top-right panel
• A biased estimate of the slope driven by an outlier observation as in the bottom-left panel
• A trivial relationship, which appears as a linear relationship again due to an outlier as in the bottom-right panel of Figure 3.1
Remember: Always plot your variables before beginning a statistical analysis of them.
4. Univariate Time Series Models
Univariate time series analysis studies the behavior of a single random variable observed over time. Risk managers are interested in how prices and risk factors move over time; therefore time series models are useful for risk managers. Forecasting the future values of a variable using past and current observations on the same variable is a key topic in univariate time series analysis.
4.1. Autocorrelation
Correlation measures the linear dependence between two variables and autocorrelation measures the linear dependence between the current value of a time series variable and the past value of the same variable. Autocorrelation is a crucial tool for detecting linear dynamics in time series analysis.
The autocorrelation for lag τ is defined as
Consider a data set on an asset return,  . The sample autocorrelation at lag τ measures the linear dependence between today's return,
  , and the return τ days ago,
  . Using the autocorrelation definition, we can write the sample autocorrelation as
In order to detect dynamics in a time series, it is very useful to first plot the autocorrelation function (ACF), which plots  on the vertical axis against τ on the horizontal axis.
The statistical significance of a set of autocorrelations can be formally tested using the Ljung-Box statistic. It tests the null hypothesis that the autocorrelation for lags 1 through m are all jointly zero via
The critical value of  corresponding to the probability p can be found for example by using the CHIINV function in Excel. If p = 0.95 and m = 20, then the formula CHIINV(0.95,20) in Excel returns the value 10.85. If the test statistic LB(20) computed using the first 20 autocorrelations is larger than 10.85 then we reject the hypothesis that the first 20 autocorrelations are zero at the 5% significance level.
Clearly, the maximum number of lags, m, must be chosen in order to implement the test. Often the application at hand will give some guidance. For example if we are looking to detect intramonth dynamics in a daily return, we use m = 21 corresponding to 21 trading days in a month. When no such guidance is available, setting m = ln(T) has been found to work well in simulation studies.
4.2. Autoregressive (AR) Models
Once a pattern has been found in the autocorrelations then we want to build forecasting models that can match the pattern in the autocorrelation function.
The simplest and most used model for this purpose is the autoregressive model of order 1, AR(1), which is defined as

If  then the (unconditional) mean of the model can be denoted by

The unconditional variance is similarly

Just as time series data can be characterized by the ACF then so can linear time series models. To derive the ACF for the AR(1) model assume without loss of generality that μ = 0. Then

The lag order τ appears in the exponent of  and we therefore say that the ACF of an AR(1) model decays exponentially to zero as τ increases. The case when
  is close to 1 but not quite 1 is important in financial economics. We refer to this as a highly persistent series.
Figure 3.2 shows examples of the ACF in AR(1) models with four different (positive) values of  . When
  then the ACF decays to zero exponentially. Clearly the decay is much slower when
  than when it is 0.5 or 0.1. When
  then the ACF is flat at 1. This is the case of a random walk, which we will study further later.
 |
| Figure 3.2 |
Figure 3.3 shows the ACF of an AR(1) when  . Notice the drastically different ACF pattern compared with Figure 3.2. When
  then the ACF oscillates around zero but it still decays to zero as the lag order increases. The ACFs in Figure 3.2 are much more common in financial risk management than are the ACFs in Figure 3.3.
 |
| Figure 3.3 |
The autocorrelation function of the AR(2) is
In order to derive the first-order autocorrelation note first that the ACF is symmetric around τ = 0 meaning that
The general AR(p) model is defined by
The one-step ahead forecast in the AR(p) model is simply
The τ day ahead forecast can be built using
The partial autocorrelation function (PACF) gives the marginal contribution of an additional lagged term in AR models of increasing order. First estimate a series of AR models of increasing order:
The optimal lag order p in the AR(p) can be chosen as the largest p such that  is significant in the PACF. For example, an AR(3) will have a significant
  but it will have a
  close to zero.
Note that in AR models the ACF decays exponentially whereas the PACF decays abruptly. This is why the PACF is useful for AR model order selection.
The AR(p) models can be easily estimated using simple OLS regression on observations  through T. A useful diagnostic test of the model is to plot the ACF of residuals from the model and perform a Ljung-Box test on the residuals using
  degrees of freedom.
4.3. Moving Average (MA) Models
In AR models the ACF dies off exponentially, however, certain dynamic features such as bid-ask bounces or measurement errors die off abruptly and require a different type of model. Consider the MA(1) model in which
In order to derive the ACF of the MA(1) assume without loss of generality that  . We then have


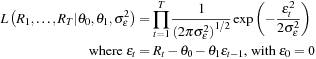
Unlike AR models, the MA(1) model must be estimated by numerical optimization of the likelihood function. We proceed as follows. First, set the unobserved  , which is its expected value. Second, set parameter starting values (initial guesses) for
  ,
,  , and
, and  . We can use the average of
  for
for  use 0 for
  , and use the sample variance of
  for
for  . Now we can compute the time series of residuals via
We are now ready to estimate the parameters by maximizing the likelihood function that we must first define. Let us first assume that  is normally distributed, then
The maximum likelihood estimation method chooses parameters to maximize the probability of the estimated model (in this case MA(1)) having generated the observed data set (in this case the set of  s).
s).
In the MA(1) model we must perform an iterative search (using for example Solver in Excel) over the parameters  :
:
Once the parameters have been estimated we can use the model for forecasting. In the MA(1) model the conditional mean forecast is
The general MA(q) model is defined by
Note that MA models are easily identified using the ACF. If the ACF of a data series dies off to zero abruptly after the first four (nonzero) lags then an MA(4) is likely to provide a good fit of the data.
4.4. Combining AR and MA into ARMA Models
Parameter parsimony is key in forecasting, and combining AR and MA models into ARMA models often enables us to model dynamics with fewer parameters.
Consider the ARMA(1,1) model, which includes one lag of  and one lag of
  :
:
Using the fact that  we can get the variance from
The first-order autocorrelation is given from
The general ARMA(p, q) model is
Because of the MA term, ARMA models just as MA models must be estimated using maximum likelihood estimation (MLE). Diagnostics on the residuals can be done via Ljung-Box tests with degrees of freedom equal to  .
.
4.5. Random Walks, Units Roots, and ARIMA Models
The random walk model is a key benchmark in financial forecasting. It is often used to model speculative prices in logs. Let  be the closing price of an asset and let
  so that log returns are immediately defined by
  .
.
The random walk (or martingale) model for log prices is now defined by

In the random walk model, the conditional mean and variance forecasts for the log price are
Equity returns typically have a small positive mean corresponding to a small drift in the log price. This motivates the random walk with drift model
A time series,  , follows an ARIMA(p, 1, q) model if the first differences,
  , follow a mean-reverting ARMA(p, q) model. In this case we say that
  has a unit root. The random walk model has a unit root as well because in that model
4.6. Pitfall 1: Spurious Mean-Reversion
Consider the AR(1) model again:
If  is estimated in a small sample of asset prices to be 0.85 then it implies that the underlying asset price is predictable and market timing thus feasible. However, the true value may in fact be 1, which means that the price is a random walk and so unpredictable.
The aim of technical trading analysis is to find dynamic patterns in asset prices. Econometricians are very skeptical about this type of analysis exactly because it attempts to find dynamic patterns in prices and not returns. Asset prices are likely to have a  very close to 1, which in turn is likely to be estimated to be somewhat lower than 1, which in turn suggests predictability. Asset returns have a
  close to zero and the estimate of an AR(1) on returns does not suffer from bias. Looking for dynamic patterns in asset returns is much less likely to produce false evidence of predictability than is looking for dynamic patterns in asset returns. Risk managers ought to err on the side of prudence and thus consider dynamic models of asset returns and not asset prices.
4.7. Testing for Unit Roots
Asset prices often have a  very close to 1. But we are very interested in knowing whether
  or 1 because the two values have very different implications for longer term forecasting as indicated by Figure 3.2.
  implies that the asset price is predictable so that market timing is possible whereas
  implies it is not. Consider again the AR(1) model with and without a constant term:
This looks like a standard t-test in a regression but it is crucial that when the null hypothesis  is true, so that
  , the unit root test does not have the usual normal distribution even when T is large. If you estimate
  using OLS and test that
  using the usual t-test with critical values from the normal distribution then you are likely to reject the null hypothesis much more often than you should. This means that you are likely to spuriously find evidence of mean-reversion, that is, predictability.
5. Multivariate Time Series Models
Multivariate time series analysis is relevant for risk management because we often consider risk models with multiple related risk factors or models with many assets. This section will briefly introduce the following important topics: time series regressions, spurious relationships, cointegration, cross correlations, vector autoregressions, and spurious causality.
5.1. Time Series Regression
The relationship between two (or more) time series can be assessed applying the usual regression analysis. But in time series analysis the regression errors must be scrutinized carefully.
Consider a simple bivariate regression of two highly persistent series, for example, the spot and futures price of an asset
The first step in diagnosing such a time series regression model is to plot the ACF of the regression errors,  .
.
If ACF dies off only very slowly (the Hurwitz bias will make the ACF look like it dies off faster to zero than it really does) then it is good practice to first-difference each series and run the regression
Now the ACF can be used on the residuals of the new regression and the ACF can be checked for dynamics. The AR, MA, or ARMA models can be used to model any dynamics in  . After modeling and estimating the parameters in the residual time series,
  , the entire regression model including a and b can be reestimated using MLE.
5.2. Pitfall 2: Spurious Regression
Checking the ACF of the error term in time series regressions is particularly important due to the so-called spurious regression phenomenon: Two completely unrelated times series—each with a unit root—are likely to appear related in a regression that has a significant b coefficient.
Fortunately, as noted earlier, the ACF comes to the rescue for detecting spurious regression. If the relationship between  and
and  is spurious then the error term,
  will have a highly persistent ACF and the regression in first differences
5.3. Cointegration
Relationships between variables with unit roots are of course not always spurious. A variable with a unit root, for example a random walk, is also called integrated, and if two variables that are both integrated have a linear combination with no unit root then we say they are cointegrated.
Examples of cointegrated variables could be long-run consumption and production in an economy, or the spot and the futures price of an asset that are related via a no-arbitrage condition. Similarly, consider the pairs trading strategy that consists of finding two stocks whose prices tend to move together. If prices diverge then we buy the temporarily cheap stock and short sell the temporarily expensive stock and wait for the typical relationship between the prices to return. Such a strategy hinges on the stock prices being cointegrated.
Consider a simple bivariate model where
The cointegration model can be used to preserve the relationship between the variables in the long-term forecasts
The concept of cointegration was developed by Rob Engle and Clive Granger. They together received the Nobel Prize in Economics in 2003 for this and many other contributions to financial time series analysis.
5.4. Cross-Correlations
Consider again two financial time series,  and
and  . They can be dependent in three possible ways:
  can lead
  (e.g.,
  ),
),  can lag
  (e.g.,
  ), and they can be contemporaneously related (e.g.,
  ). We need a tool to detect all these possible dynamic relationships.
The sample cross-correlation matrices are the multivariate analogues of the ACF function and provide the tool we need. For a bivariate time series, the cross-covariance matrix for lag τ is
In the general case of a k-dimensional time series, we have
Detecting lead and lag effects is important, for example when relating an illiquid stock to a liquid market factor. The illiquidity of the stock implies price observations that are often stale, which in turn will have a spuriously low correlation with the liquid market factor. The stale equity price will be correlated with the lagged market factor and this lagged relationship can be used to compute a liquidity-corrected measure of the dependence between the stock and the market.
5.5. Vector Autoregressions (VAR)
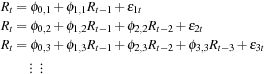
The vector autoregression model (VAR), which is not to be confused with Value-at-Risk (VaR), is arguably the simplest and most often used multivariate time series model for forecasting. Consider a first-order VAR, call it VAR(1)

Note that in the VAR,  and
and  are contemporaneously related via their covariance
  . But just as in the AR model, the VAR only depends on lagged variables so that it is immediately useful in forecasting.
If the variables included on the right-hand-side of each equation in the VAR are the same (as they are above) then the VAR is called unrestricted and OLS can be used equation-by-equation to estimate the parameters.
5.6. Pitfall 3: Spurious Causality
We may sometimes be interested to see if the lagged value of  , namely
  , is causal for the current value of
  , in which case it can be used in forecasting. To this end a simple regression of the form
In order to truly assess if  causes
  (or vice versa), we should ask the question: Is past
  useful for forecasting current
  once the past
  has been accounted for? This question can be answered by running a VAR model:
•  is said to Granger cause
  if
if 
•  is said to Granger cause
  if
if 
In some cases several lags of  may be needed on the right-hand side of the equation for
  and similarly we may need more lags of
  in the equation for
  .
.
6. Summary
The financial asset prices and portfolio values typically studied by risk managers can be viewed as examples of very persistent time series. An important goal of this chapter is therefore to ensure that the risk manager avoids some common pitfalls that arise because of the persistence in prices. The three most important issues are
• Spurious detection of mean-reversion; that is, erroneously finding that a variable is mean-reverting when it is truly a random walk
• Spurious regression; that is, erroneously finding that a variable x is significant when regressing y on x
• Spurious detection of causality; that is, erroneously finding that the current value of x causes (helps determine) future values of y when in reality it cannot
Several more advanced topics have been left out of the chapter including long memory models and models of seasonality. Long memory models give more flexibility in modeling the autocorrelation function (ACF) than do the traditional ARIMA and ARMA models studied in this chapter. In particular long-memory models allow for the ACF to go to zero more slowly than the AR(1) model, which decays to zero at an exponential decay as we saw earlier. Seasonal models are useful, for example, for the analysis of agricultural commodity prices where seasonal patterns in supply cause seasonal patterns in prices, in expected returns, and in volatility. These topics can be studied using the resources suggested next.
Further Resources
For a basic introduction to financial data analysis, see Koop (2006) and for an introduction to probability theory see Paollela (2006). Wooldridge (2002) and Stock and Watson (2010) provide a broad introduction to econometrics. Anscombe (1973) contains the data in Table 3.1 and Figure 3.1.
The univariate and multivariate time series material in this chapter is based on Chapters 2 and 8 in Tsay (2002), which should be consulted for various extensions including seasonality and long memory. See also Taylor (2005) for an excellent treatment of financial time series analysis focusing on volatility modeling.
Diebold (2004) gives a thorough introduction to forecasting in economics. Granger and Newbold (1986) is the classic text for the more advanced reader. Christoffersen and Diebold (1998) analyze long-horizon forecasting in cointegrated systems.
The classic references on the key time series topics in this chapter are Hurwitz (1950) on the bias in the AR(1) coefficient, Granger and Newbold (1974) on spurious regression in economics, Engle and Granger (1987) on cointegration, Granger (1969) on Granger causality, and Dickey and Fuller (1979) on unit root testing. Hamilton (1994) provides an authoritative treatment of economic time series analysis.
Tables with critical values for unit root tests can be found in MacKinnon, 1996 and MacKinnon, 2010. See also Chapter 14 in Davidson and MacKinnon (2004).
Anscombe, F.J., Graphs in statistical analysis, Am. Stat. 27 (1973) 17–21.
Christoffersen, P.; Diebold, F., Cointegration and long horizon forecasting, J. Bus. Econ. Stat. 16 (1998) 450–458.
Davidson, R.; MacKinnon, J.G., Econometric Theory and Methods. (2004) Oxford University Press, New York, NY.
Dickey, D.A.; Fuller, W.A., Distribution of the estimators for autoregressive time series with a unit root, J. Am. Stat. Assoc. 74 (1979) 427–431.
Diebold, F.X., Elements of Forecasting. third ed (2004) Thomson South-Western, Cincinnati, Ohio.
Engle, R.F.; Granger, C.W.J., Co-integration and error correction: Representation, estimation and testing, Econometrica 55 (1987) 251–276.
Granger, C.W.J., Investigating causal relations by econometric models and cross-spectral methods, Econometrica 37 (1969) 424–438.
Granger, C.W.J.; Newbold, P., Spurious regressions in econometrics, J. Econom. 2 (1974) 111–120.
Granger, C.W.J.; Newbold, P., Forecasting Economic Time Series. second ed (1986) Academic Press, Orlando, FL.
Hamilton, J.D., Time Series Analysis. (1994) Princeton University Press, Princeton, NJ.
Hurwitz, L., Least squares bias in time series, In: (Editor: Koopmans, T.C.) Statistical Inference in Econometric Models (1950) Wiley, New York, NY.
Koop, G., Analysis of Financial Data. (2006) Wiley, Chichester, West Sussex, England.
MacKinnon, J.G., Numerical distribution functions for unit root and cointegration tests, J. Appl. Econom. 11 (1996) 601–618.
MacKinnon, J.G., 2010. Critical Values for Cointegration Tests, Queen's Economics Department. Working Paper no 1227. http://ideas.repec.org/p/qed/wpaper/1227.html.
Paollela, M., Fundamental Probability. (2006) Wiley, Chichester, West Sussex, England.
Stock, J.; Watson, M., Introduction to Econometrics. second ed (2010) Pearson Addison Wesley.
Taylor, S.J., Asset Price Dynamics, Volatility and Prediction. (2005) Princeton University Press, Princeton, NJ.
Tsay, R., Analysis of Financial Time Series. (2002) Wiley Interscience, Hoboken, NJ.
Wooldridge, J., Introductory Econometrics: A Modern Approach. Second Edition (2002) South-Western College Publishing, Mason, Ohio.
Open the Chapter3Data.xlsx file from the web site.
1. Using the data in the worksheet named Question 3.1 reproduce the moments and regression coefficients at the bottom of Table 3.1.
2. Reproduce Figure 3.1.
3. Reproduce Figure 3.2.
4. Using the data sets in the worksheet named Question 3.4, estimate an AR(1) model on each of the 100 columns of data. (Excel hint: Use the LINEST function.) Plot the histogram of the 100  estimates you have obtained. The true value of
  is one in all the columns. What does the histogram tell you?
5. Using the data set in the worksheet named Question 3.4, estimate an MA(1) model using maximum likelihood. Use the starting values suggested in the text. Use Solver in Excel to maximize the likelihood function.
Answers to these exercises can be found on the companion site.
For more information see the companion site at http://www.elsevierdirect.com/companions/9780123744487
..................Content has been hidden....................
You can't read the all page of ebook, please click here login for view all page.