


Administration: Summary tab
This chapter gives you an overview of the Summary tab of the IBM System Storage DS (Subsystem Management) window.
The following topics are described:
•How to monitor the basic status of your storage subsystem
•How to get a basic overview of your installed hardware components
•How to get a basic information about the current logical configuration
6.1 DS Storage Manager: Summary tab
The first tab of the Subsystem Management window is the Summary tab. Figure 6-1 shows an IBM System Storage DCS3700 storage subsystem that is running in an optimal status.

Figure 6-1 IBM System Storage DS Storage Manager Summary tab
The Summary tab is divided into seven panes, which are described in the following sections:
6.2 Monitor
The first pane is the Monitor section, which displays the basic status of your storage subsystem (Figure 6-2).

Figure 6-2 Monitor
6.2.1 Storage subsystem status
The first link in the Monitor pane shows the current subsystem status. If the status is green, as shown in Figure 6-2, the subsystem is running in an optimal status. If there is any problem with the subsystem, the status icon changes to red (Figure 6-3). Click Storage Subsystem Needs Attention to open the Recovery Guru. For more information about how to troubleshoot and recover from problems, see Chapter 13, “Administration: Monitor” on page 385. The same red icon is also visible in upper part of the Subsystem Manager window, close to the name of subsystem, and the Recovery Guru icon in the toolbar is flashing.

Figure 6-3 Monitor box - Storage Subsystem Needs Attention
The next two lines inform you about the installed Management and Controller Versions.
6.2.2 Storage Subsystem communication error
If the management connection from the management station to the storage subsystem is lost, the subsystem icon and text is changed to notify you of this communication error (Figure 6-4). If only the management connection is lost, the attached hosts can still access data on the disks, but you cannot manage your subsystem or receive alerts. The Subsystem Management window then displays the last known state of the subsystem only, and you cannot perform any administrative operations.

Figure 6-4 Storage Subsystem communication error
6.2.3 Operations in Progress
The second link shows operations that are in progress (Figure 6-5). If there is at least one operation in progress, you can click the link to open a window with more detailed information (Figure 6-6). You can find more information about operations in progress in Chapter 8, “Administration: Storage & Copy Services tab” on page 225.

Figure 6-5 Operations in Progress

Figure 6-6 Detailed View Operations in Progress
6.2.4 View Firmware Inventory
This window informs you about all the firmware levels of the system. The window in Figure 6-7 on page 191 and Figure 6-8 on page 191 show examples of the View Firmware
Inventory pane.
Inventory pane.

Figure 6-7 View Firmware Inventory - 1

Figure 6-8 View Firmware Inventory - 2
6.2.5 View Storage Subsystem Profile
Configuring a storage server can be a complex task. It is essential to document the initial configuration and every later configuration change. The configuration documentation can be saved in a text file that is known as a subsystem profile. This profile stores information (properties) about the controllers, attached drives, enclosures, microcode levels, arrays, logical drives, storage partitioning, and so on.
To generate and open the subsystem profile, click View Storage Subsystem Profile in the Monitor box (Figure 6-2 on page 189). The information is gathered from the various components and the profile window opens (Figure 6-9). The various tabs show the properties of various objects in storage subsystem. Click Save As to save the whole profile locally to disk to help document a change history of your storage subsystem. It is saved as a text file. You can look at this file later, or send it to somebody who has no direct access to your storage subsystem to analyze it. For more information about the profile, see Chapter 13, “Administration: Monitor” on page 385.

Figure 6-9 Storage Subsystem Profile window
|
Note: You should save a new version of the profile (or collect all support data (CASD) as described in Chapter 13, “Administration: Monitor” on page 385) and store it securely whenever the configuration changes. Even if there is a complete configuration loss, your data on disks might not be affected, and you can restore the arrays and logical drives configuration and the mappings for the storage partitioning. The profile should be stored locally, and also can be included in any offsite disaster recovery documentation.
|
6.2.6 View Event Log
Use the Event Log Viewer to show a detailed list of events that occur in a storage subsystem. The Event Log is stored on reserved areas on the storage subsystem disks. It records configuration events and storage subsystem component failures. The Event Log stores approximately 8000 events before it replaces an event with a new event. If you want to keep the events, you may save them, and clear them from the Event Log. The Event Log window shows two types of event views. The first window displays only the event summary in table form, as shown in Figure 6-10.

Figure 6-10 Event summary in table form
When you select the View Details check box (see Figure 6-11), the window splits into two sections views. The summary of a highlighted event is displayed, as shown in Figure 6-11. To resize the panes, select the splitter bar between the two views, and move it up or down.

Figure 6-11 Detailed event view
6.2.7 Collect Support Data
Use the Collect Support Data link to gather various types of inventory, status, and performance data that can help troubleshoot any problems with your storage subsystem. All of the files that are gathered are compressed into a single archive in a compressed file format. Then, you can forward the archive file to your IBM Technical Support representative for troubleshooting and further analysis.
|
Attention: Use this option only under the guidance of your IBM Technical
Support representative! Note: If your enclosure contains drawers, the diagnostic data for that enclosure is archived in a separate compressed file named EnclosureComponentsStateCapture_<user-defined>.zip in the same location that is specified for the support data file.
|
Figure 6-12 shows the collection of Support Data.

Figure 6-12 Collect Support Data
6.3 Capacity
The Capacity pane is at the lower left and is shown in Figure 6-13. It displays the overall capacity of your subsystem, that is, the total capacity of the installed disk drives. A darker green color is used to show configured capacity in logical volumes, and a light green color is used to show the capacity that can be used for the configuration of new logical drives. A gray color shows the space on unconfigured disks that are available on the system.

Figure 6-13 Capacity - configured, free, and unconfigured capacity
6.3.1 Create Storage
The Create Storage link allows for administration of the storage subsystem. Figure 6-14 shows the different possibilities. For more information about how to use the Automatic or Manual Configuration, see Chapter 8, “Administration: Storage & Copy Services tab” on page 225.

Figure 6-14 Create Storage
The following automatic configurations are possible:
Create Disk Pools A set of drives that is logically grouped. A disk pool provides the overall capacity that is needed to create one or more logical drives. A disk pool is similar to an array, with the following differences. The data in a disk pool is stored randomly on all of the drives in the disk pool, unlike data in an array, which is stored on the same set of drives. You do not specify a RAID level for a disk pool. A disk pool does not use hot spare drives. And, a disk pool allows a many drives to be grouped.
Create Arrays A set of drives that is logically grouped and assigned a RAID level. Each array that is created provides the overall capacity that is needed to create one or more logical drives.
The following manual configurations are possible:
Create Disk Pools A set of drives that is logically grouped. A disk pool provides the overall capacity that is needed to create one or more logical drives. A disk pool is similar to an array, with the following differences. The data in a disk pool is stored randomly on all of the drives in the disk pool, unlike data in an array, which is stored on the same set of drives. You do not specify a RAID level for a disk pool. A disk pool does not use hot spare drives. And, a disk pool allows many drives to be grouped.
Configure hot spares (arrays only) A spare drive that contains no data and that acts as a standby in case a drive fails in a Redundant Array of Independent Disks (RAID) 1, RAID 3, RAID 5, or RAID 6 logical drive. The hot spare drive can replace the failed drive in the logical drive. Hot spare drives are used only in arrays, not disk pools.
Create arrays A set of drives that is logically grouped and assigned a RAID level. Each array that is created provides the overall capacity that is needed to create one or more logical drives.
6.3.2 Create Logical Drive
In the Create Logical Drive window (see Figure 6-15), logical components are created for the host in order to access storage on the storage subsystem. A logical drive (LUN) is created from the capacity that is available on a disk pool or an array. Although a logical drive might consist of more than one drive, a logical drive appears as one logical component to the host.
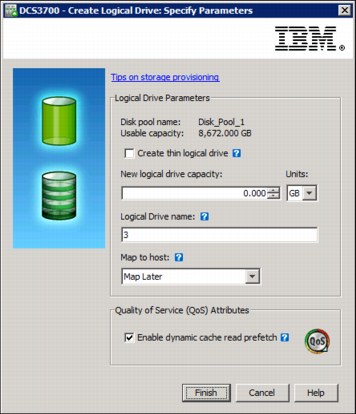
Figure 6-15 Create Logical Drive
6.4 Storage & Copy Services
The overview that is shown in Figure 6-16 provides information about the availability of
Premium Features.
Premium Features.

Figure 6-16 Storage & Copy Services
6.5 Host Mappings
An overview of your Hosts & Mappings pane is shown in Figure 6-17.

Figure 6-17 Host Mappings
Hosts are single server systems that can be mapped to a drive. This means that a host is a system that accesses the logical drive through the attached technology (SAS or Fibre Channel). If multiple hosts access one or a group of logical drives, they all have equal access to these drives. Because most operating systems (without clustering software) do not usually allow shared access to the same logical drives, you must create storage partitions. Do this by mapping specific logical drives to the host ports of the host systems. Configuring host access is described in Chapter 10, “Administration: Mappings tab” on page 327.
6.5.1 Host-to-Logical Drive Mappings
Host-to-Logical Drive Mappings is the second link in this box. Next to the link you see the number of logical drives that are mapped, which means the number of logical drives that are allowed to be seen by a specific host. Clicking the link displays a more detailed view (Figure 6-18).
In this window, the Logical Drive Name is displayed next to the mapped host (Accessible By column), so it is easy to discover which host is allowed to access which logical drive. The window also includes the LUN Number, the Logical Drive Capacity, and the Type. More information about drive mappings is provided in Chapter 10, “Administration: Mappings tab” on page 327.

Figure 6-18 Host-to-Logical Drive Mappings
6.6 Premium Features
This pane display the Number of Trial or activated Premium Features, as shown in Figure 6-19.

Figure 6-19 Overview Premium Features
6.6.1 Manage Premium Features
To manage the Premium Features, click Manage Premium Features. The window that is shown in Figure 6-20 opens.

Figure 6-20 Manage Premium Features
More information about Premium Features is provided in 2.5, “Planning for Premium Features” on page 74 and “Premium Features” on page 205.
6.7 Hardware
The Hardware pane gives an overview of the Hardware Components (see Figure 6-21 on page 201) that are physically installed in this storage subsystem. The upper part of the pane shows the number of installed controllers and the number of connected enclosures (one in this case). The lower part of the pane shows information about installed hard disk drives (assigned and unassigned), media and number of drives, the drive type, and an overview of the hot spare drives.

Figure 6-21 Hardware Overview
For more information about this pane, see Chapter 9, “Administration: Hardware tab” on page 305.
6.8 Information Center
At the right bottom edge of the Summary tab is the Information Center pane (Figure 6-22). It includes several links to help you understand and set up your storage subsystem, and answer any questions that you might have.
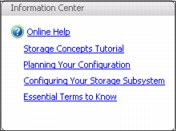
Figure 6-22 Information Center
Each of the five links opens the same Help application window but with different content. Click one of the links to navigate in the online help directly to the related content:
•Online Help
•Storage Concepts Tutorial
•Planning your Configuration
•Configuring Your Storage Subsystem
•Essential Terms to Know
As shown in Figure 6-23, topics about how to configure your DCS3700 storage subsystem are displayed if you click Storage Concepts Tutorial.

Figure 6-23 Information Center - Storage Concepts Tutorial
..................Content has been hidden....................
You can't read the all page of ebook, please click here login for view all page.