
CONTENTS OF THIS CHAPTER
This chapter covers the following topics:
- what is modelling?
- rationale for modelling;
- the need for multiple models and views;
- commonly used modelling techniques;
- cross-referencing models and views;
- documentation and specification;
- references and further reading.
There are many modelling notations and frameworks in use and this chapter does not attempt to describe them in detail. It does, however, discuss some theoretical issues of modelling, with examples, that will allow readers to understand and assess alternative approaches with the aim of being able to select and apply models appropriate to the problem presented by the specific solution requirements.
WHAT IS MODELLING?
A model is a representation of a subject. Typically that subject is a real-world object or system that either already exists or may exist in the future. There are also models of imagined subjects, for example a science fiction space craft being rendered in CGI for a film or to be flown by the player of a computer game; but these are not the concern of this book.
This chapter focuses on modelling systems, in particular business and IT systems that are employed by organisations to support their operating model. This loose definition of a system that focuses on more than just the IT allows for systems to exist within other systems at different levels of granularity and in different contexts.
In order to be able to describe any such system we need to understand that:
- A system has a boundary outside of which are external entities (people or other systems) that interact with the system in focus.
- Within this system are components (systems, people) that implement that system’s behaviour.
- These interactions and internal system behaviours involve data being exchanged, transformed and stored.
- Any system exists within a broader context that needs to be understood and the system should be defined in terms of how it delivers functionality and services within this context, usually in the form of requirements.
Modelling is the act of producing appropriate models of these systems through the fundamental act of abstraction that allows all these issues to be examined, explored and refined prior to development of the system elements.
Abstraction
In philosophical terminology, abstraction is the thought process wherein ideas are distanced from objects. In system modelling, abstraction is the process of removing anything unnecessary or irrelevant from a system model (or the view of that model) depending on its purpose.
Different system models tend to focus on specific facets1 of the system, for example its functionality or implementation. A single model is therefore an incomplete abstraction of the real thing but a combination of models can between them provide a more complete description, providing they are consistent with each other.
‘The model is not the reality, but the best models are the ones that stick very close to reality.’ (Booch, et al., 2005)
‘All models are wrong’
Any model, as an incomplete abstraction, is therefore imperfect. As George Box, a renowned twentieth-century industrial statistician put it:
Remember that all models are wrong; the practical question is – how wrong do they have to be to not be useful?
(Box and Draper, 1987)
Usefulness is the key, although intangible, measure of the value of any model. Usefulness can be increased by abstracting out details irrelevant to the facet being focused on, providing that what remains in that model is effective in communicating or describing that facet to the appropriate level. What is appropriate and effective usually depends on the nature of the intended audience. A representation that works effectively for a technical developer is unlikely to be equally useful for a business stakeholder and vice versa.
Probably the best known form of abstraction in system modelling is creating a Logical model of a physical system where anything to do with the ‘how’ (technology), ‘who’ (specific people or organisational units) or ‘where’ (location), is removed leaving a Logical model that focusses on the ‘what?’, ‘when?’, logical ‘who?’ and encourages consideration of the most important ‘why’.
Creating a Logical model of something physical is known as idealisation; just one of a number of forms of abstraction typically used in system modelling that are explained later in the chapter. Given these different forms, there are several words used to describe the opposite of abstraction such as:
- specification;
- specialisation;
- realisation;
- reification.
In modelling, we can work in both directions; typically we abstract to understand and analyse; whereas design activities take us back towards the finished specific, physical model.
Structure over words
The alternative to modelling, visually or otherwise, is to attempt to explain these complex systems using textual descriptions. Modelling does not need to be visual, although as the saying goes ‘a picture paints a thousand words’. System modelling typically involves a combination of visual representations (diagrams) and structured textual descriptions of:
- model elements; for example, tasks in a process model, classes or entities in a data model;
- links and dependencies between elements; for example, arrows that show the sequence of tasks or lines that represent some semantic dependency between classes or entities.
Diagrams and models
A diagram by itself is not typically the whole model; it may have insufficient detail to provide the necessary information to its intended audience. Many modelling notations and languages treat diagrams as views onto the model, where the model is a structured set of model element objects (data) that each describe a single model element, link or dependency within that system.
The underlying element objects are represented visually in diagrams and, by using appropriate tools, can be manipulated through those diagrams. For example, adding a visual element to a diagram creates a new element object in the underlying model and when its name or other characteristic is specified on the diagram, that is captured in the element object. A single element object can then be represented in a number of diagrams and changing any of its characteristics in one diagram is captured in the underlying model element, so all diagram instances of that object are automatically updated. However, each diagram may show or hide different features to create a view suitable for a particular audience. This multiple views of the same model principle supports the fact that different audiences find value in different abstractions. The use of such tools is described in more detail in Chapter 14.
As-Is and To-Be
When using modelling in any form of development process, it is critical that it is clear just what needs to be developed. Often there are existing elements to the solution, some of which may remain intact, others changed and some discarded or replaced. To help understand these differences, it is useful to produce at least two versions of each model; one representing the current system and another the proposed system. The world of system modelling often refers to the ‘As-Is’ and ‘To-Be’ models; architects tend to refer to ‘Baseline’ and ‘Target’ models.
In order to compare these two temporal versions, it is essential that equivalent views of them conform to similar standards in terms of:
- notation used;
- levels of abstraction.
Consistent views are more easily compared to identify the differences between the models that represent the development needed (gap analysis).
Views and viewpoints
Views and viewpoints are terms used in systems and software engineering and architecture. It is sensible to employ a framework that defines a coherent set of viewpoints that define views to be used in the description and construction of a system. Viewpoints are designed to meet the concerns of a particular group of stakeholders and support the ‘multiple views of the same model’ principle described above.
Using this terminology, a viewpoint can be considered a template for a view; each view (for example the As-Is and To-Be views) conforms to that viewpoint template.
The U-curve process pattern
Many early development methods such as SSADM followed a process that combines the concepts of Logical/Physical and As-Is/To-Be in a basic matrix often referred to as the U-curve (see Figure 7.1).
The basic process reflected in Figure 7.1 is:
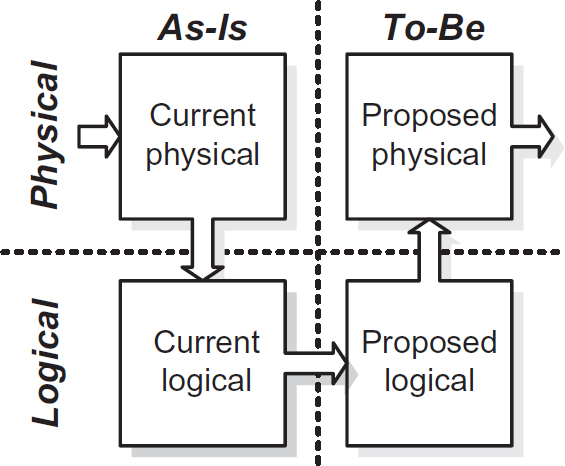
- Document/model the current system (Physical As-Is).
- Abstract out the physical details of the current system (Logical As-Is).
- Incorporate the logical business requirements, including questioning the ongoing value of any existing elements and removing them if appropriate (Logical To-Be).
- Specify and design the physical implementation details of the proposed system, which may involve a different technology set to the previous model (Physical To-Be).
In the early days of solution development, there was often little IT involved in the existing system, so jumping straight across from the Physical As-Is to the Physical To-Be risked potentially missing important new business requirements, while carrying forward redundant legacy features. This pattern is still applicable today, particularly when migrating solution components to new technologies. Ongoing maintenance activities may often skip across the physical level but doing so is not without risk.
RATIONALE FOR MODELLING
Modelling is employed in many disciplines for many reasons, for example:
- Building architects commission three-dimensional models of new structures that allow the client to get an early vision of what the finished structure will look like.
- Engineers produce structural models that allow them to perform various calculations that validate the integrity of the structure.
- Economists produce dynamic models of the economy that allow them to run various scenarios in an attempt to predict likely outcomes.
- Formula One car designers produce scale models of body components that can be placed in wind tunnels to test their aerodynamics and to refine the shapes until the finished version is produced and used on the actual car.
One can relate each of these examples to how modelling can be employed within solution development with the ultimate aim of developing a solution which meets key stakeholder requirements; in other words a quality solution.
What does modelling facilitate?
Modelling is more than simply producing a model in place of documentation to hand over as part of a process; when appropriate useful models are produced, they facilitate a range of development activities that assist the aim of developing a high-quality solution.
Communication and understanding
At the most fundamental level, a model is not useful if it does not capture and communicate a level of understanding of the system. Such communication can occur during collaborative modelling activities, for example developing models during workshops; or through models as deliverable artefacts, for example at development stage handovers.
Experimentation
Within modelling activities, the models can be experimented with, supporting exploration of alternative designs and different ‘what-if?’ scenarios – including risk assessment. The model can often act as an early prototype allowing stakeholders to review, challenge and consider. Misunderstandings and other defects revealed in the model should be corrected in the model and re-examined until correct.
Validation
Hopefully, the outcome of the review and experimentation activities just discussed enable key stakeholders to confirm the quality of the understanding of requirements and suitability of solutions before considerable cost and effort is expended in further development.
Gap analysis
The U-curve described earlier in this chapter, together with the concepts of consistent views based on defined viewpoints, provides an ideal basis to perform gap-analysis that compares the As-Is and To-Be models to reveal:
- new elements required in the system to meet requirements;
- existing elements that need to be changed or replaced to meet new requirements;
- existing elements that are no longer required;
- existing elements that will remain unchanged, but may need to be regressively tested to ensure they have not been compromised by changes to other linked or inter-dependant elements.
These ‘gaps’ can then support the planning of design, build, test and implementation activities; either as a single change or as a number of incremental changes.
Limitations of modelling
As discussed earlier, but in a shorter form, ‘all models are wrong, but some are useful’ (Box and Draper, 1987). The key to the activities facilitated by modelling is that appropriate, useful models and views are discovered and employed. Every development project is unique, with different facets needing more attention than others compared to previous projects; so a rigid approach that ‘locks down’ what models and views the development team may or must produce can often be counter-productive.
Modelling will not, by itself, ensure a high-quality solution, but it can usually identify and remove a significant number of defects earlier in the project than its absence would.
The value of modelling
Earlier in the chapter, we introduced the concept of ‘usefulness’ as a primary measure of the value of modelling. Producing models takes time and effort, incurring cost in the development process; clearly the value of modelling needs to offset this. How can this value be accrued?
Value from the act of modelling
The very act of modelling, such as in the collaborative experimentation and validation activities mentioned above, can produce significant value. Barry Boehm and others have demonstrated that the costs of fixing defects increase through a project due to the amount of re-work required the later they are discovered, so fixing them in an early model can save time and effort later in the process.
Defects include incorrect model elements derived from misunderstandings and incorrect assumptions that are included in the model; defects also exist where model elements are missing. The structure of models and their visual, diagrammatic representations makes these missing elements more obvious to identify and rectify than from a structured list of requirements or specifications.
Value of the delivered model
‘A picture is worth a thousand words’ is a phrase of indeterminate origin that we often use to explain how a single diagram, with the appropriate syntax and content, can explain a situation more accurately and succinctly than a large amount of descriptive text. It is not, however, just the visual representation of the model that we need to consider; it is also the structured nature of the whole underlying model that has value.
The formality of a structured model – and the benefit of standardised visual syntax being less prone to ambiguity – have led us towards a world where models can be interpreted by humans and development tools alike, with automation of model development increasingly possible.
An example of automated model generation is using a tool to analyse and reverse engineer those elements from the existing IT system. Forward engineering is also possible; Model Driven Architecture (MDA) employing and evolving Unified Modelling Language (UML) models has been in existence since 2001 when it was launched by the Object Management Group (OMG). The underlying process is to evolve from a computation-independent model (CIM) to a platform-independent model (PIM) to a platform-specific model (PSM) at which point little coding is left to perform. The MDA process mimics and automates what is often performed through a manual Model Driven Software Engineering process.
A significant risk of an automated model transformation approach to development is that most of the development effort may go into the tool-interpreted models at the cost of a lack of other stakeholder relevant views that allow them to analyse and validate the quality of those models.
MULTIPLE MODELS AND VIEWS
Models and diagrammatic views of those models work best when they focus on a limited subset of the facets of a system. From the early days of IT, developers have recognised the need for a range of models and documentation that between them cover enough facets to be confident that nothing important has been overlooked. This issue is well summarised in this quotation:
‘No single model is sufficient to cover all aspects of software development. We need multiple models to address different concerns. These models must be coordinated carefully to ensure that they are consistent and not too redundant.’
(Kruchten, 2001)
The three-view approach
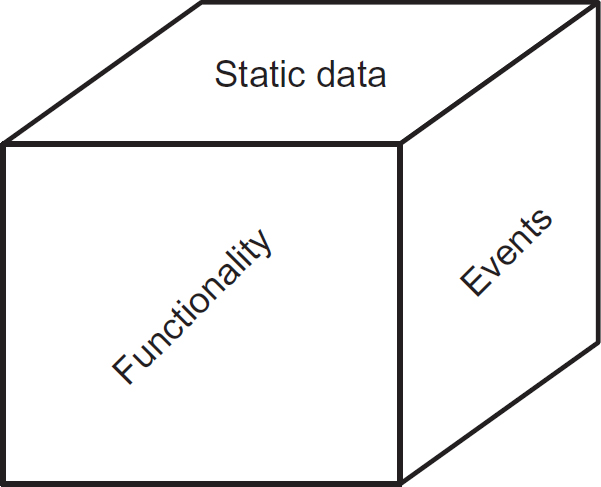
The three-view approach is a framework focused on three particular views of a system, which has been used since the early days of data processing. It involves:
- Functionality: What the system does or is required to do, typically, to process data. This often incorporates the ‘who?’ – which people or systems need to interact with the system as external entities or perform this behaviour as internal agents. This could be described logically or physically and from an internal or external angle (see ‘opaqueness’ later in this chapter).
- Static data: The system is typically required to manage the input, manipulation, storage and output of data. At run-time, the system processes a number of dynamic data objects that are created, manipulated and eventually deleted from the system. Static data is an abstract representation of the types of data objects and their structures that can be defined during analysis and design. As well as structure, the static data view can capture the semantics of the data, such as the meaning of the data and any related integrity rules. There can be many representations of the static data employing all forms of abstraction discussed later in the chapter.
- Events: Systems are driven by events, in other words the triggers to which the system has to react, typically by processing data in some predetermined manner. It is key that all these potential events are identified so that the functionality triggered by each event can be defined (see Figure 7.2).
Between these three views, questions such as ‘who?’, ‘what?’, ‘how?’, ‘when?’ and ‘where?’ can be addressed. This assumes that the underlying requirements represent the ‘why?’ Combinations of diagram types typically cover these three facets.
Figure 7.2 The three-view model of a system
PRE-UML MODELLING TECHNIQUES
At this point, it is worthwhile looking at the range of techniques available to system modellers and to provide tangible examples of how they can represent different views of systems.
In conventional or traditional modelling approaches (in this context, non-UML), there is a wide range of diagram types and modelling notations available, some defined in specific methods (such as SSADM), others as standards (for example iDEF); yet others are generically used in a variety of forms: The examples given here all relate to an imaginary bookseller, BookStack Mountain Ltd.
Functionality
Examples of functional diagram types include:
- data flow diagram (DFD);
- flow chart (including variants such as swimlane diagrams);
- Jackson structure chart.
Figure 7.3 is an example of a DFD that shows how functionality, in the form of processes, handles inputs and outputs, shown as data flows. The endpoints of these data flows include external entities (users or other systems), data stores and processes. There should always be at least one process involved in each data flow at one end or the other.
Static data
Examples of static data model notations include:
- entity relationship diagram (ERD), also known as a Logical data model;
- hierarchical tree diagram;
- bubble diagram.

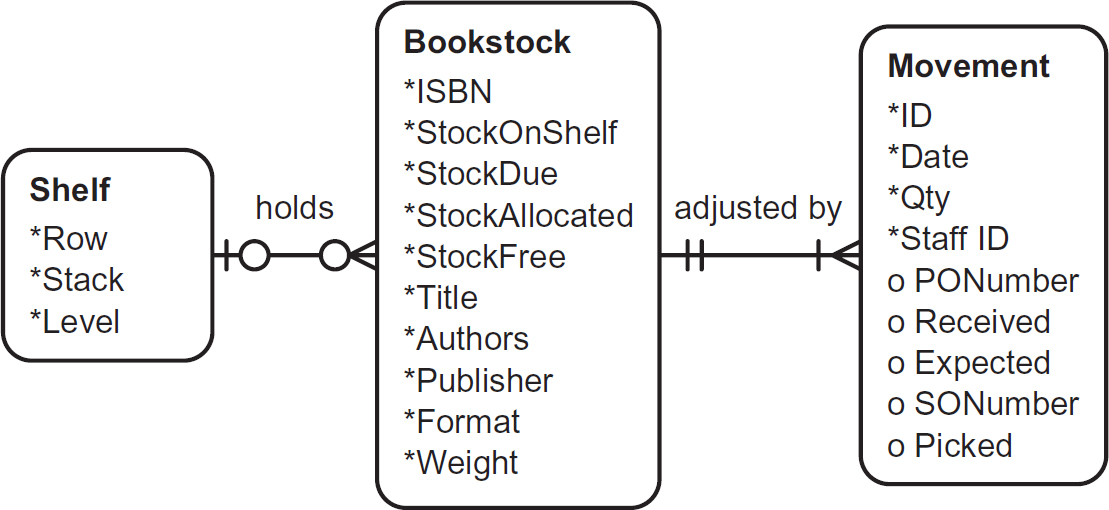
Although ERDs (see Figure 7.4) have been prominent for the last couple of decades, reflecting the prevalence of relational databases, other structure types remain relevant for modelling data held in other ways, such as hierarchical data held by some mainframes. With ‘NO-SQL’ database systems, in other words non-relational systems, becoming popular to support trends such as Big-Data, these alternative structures are becoming increasingly relevant again.
Figure 7.4 Entity relationship diagram (Everest’s ‘crows foot’ notation)
Events
Examples of techniques used to model events include:
- Entity Life History (ELH), for example using Jackson structures;
- Statechart, for example those promoted by Harel pre-UML (see Figure 7.5).

There are other diagram types that relate to multiple models such as an effect correspondence diagram (ECD), which provides a dynamic view of what data entities are traversed in response to an event (to be performed by a function).
THE UNIFIED MODELLING LANGUAGE (UML)
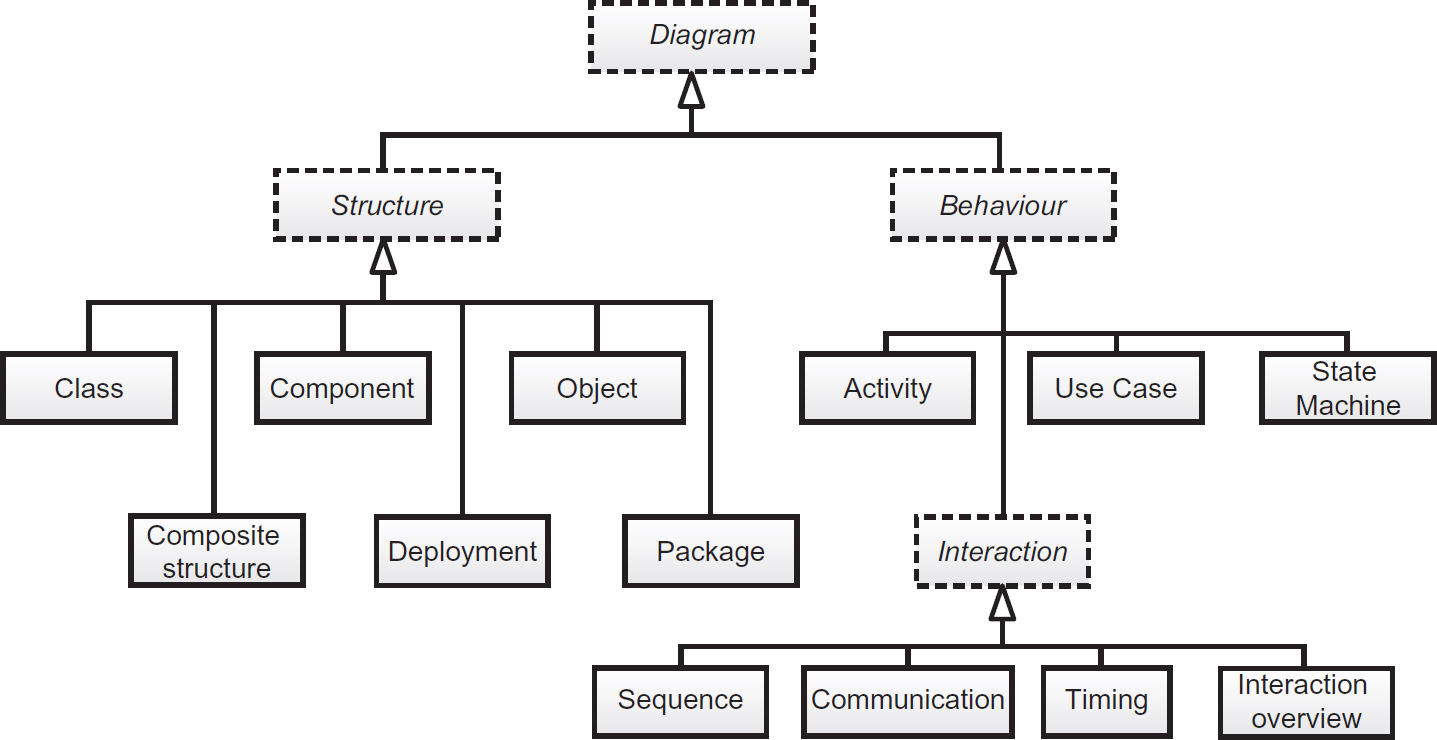
The Unified Modelling Language has emerged as the predominant standard for model and diagram notation since its standardisation in 1997. UML is particularly effective in the twenty-first century, as it is based upon the ‘multiple views of a single model’ principle described earlier and it was designed to model modern object-oriented, component based, event-driven system architectures. It is purely a notation standard independent of any specific method technology or approach. UML 2.4 specifies 13 diagram types:
UML classifies the diagram types into either ‘Behavioural’ or ‘Structural’; these diagram types can also be mapped to the three-view types. In Figure 7.6, italicised text shows an abstract grouping of diagram types rather than a diagram type itself.
Functionality
The following behavioural diagram types are each useful at different levels of abstraction:
- use case diagram;
- activity diagram;
- interaction diagrams:
- sequence diagram
- communication diagram
- timing diagram
- interaction overview diagram.
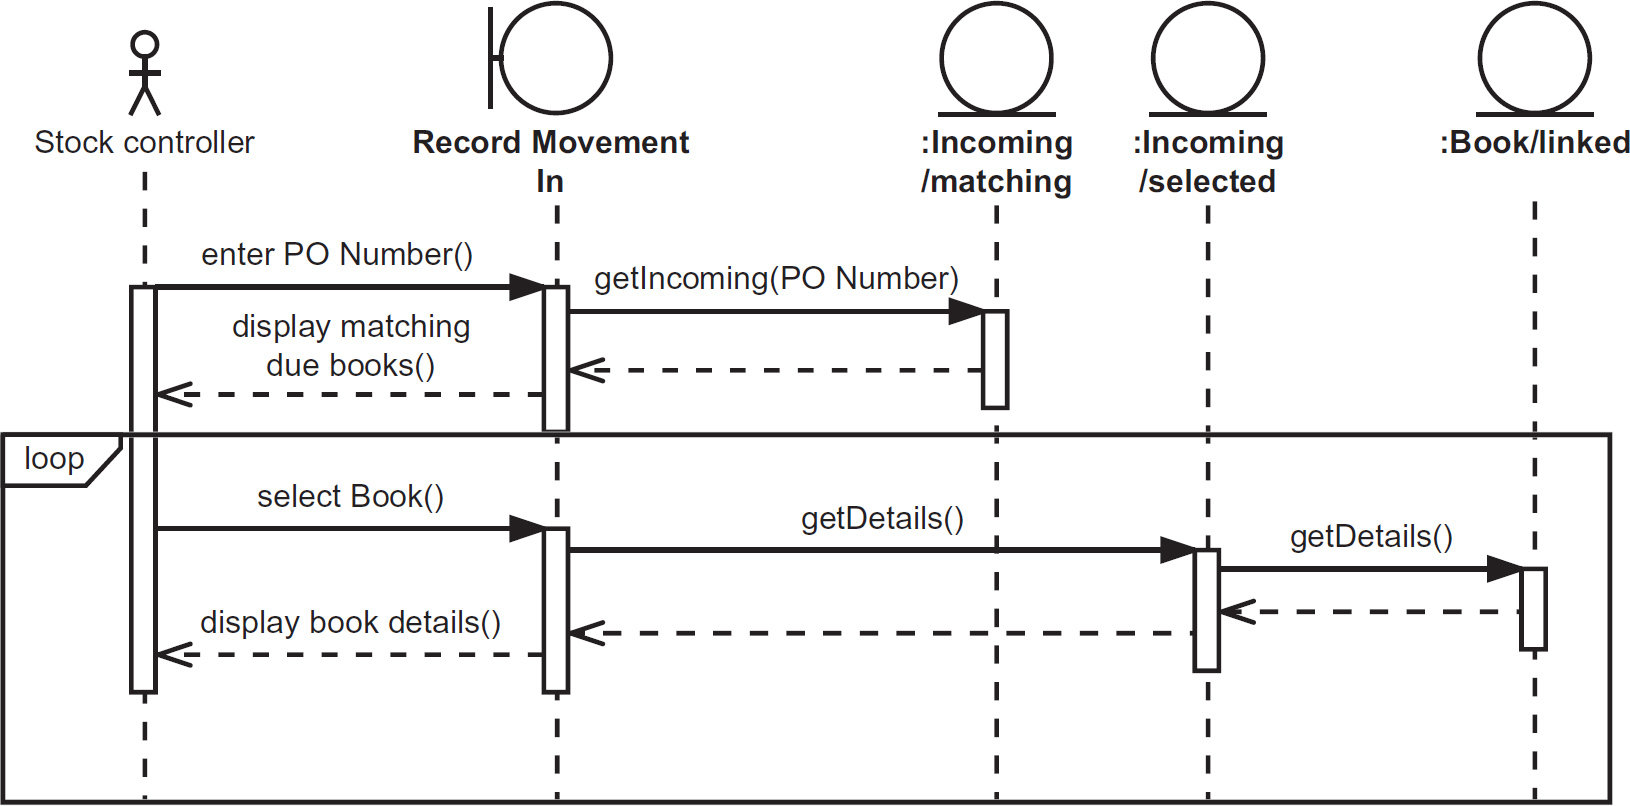
Figures 7.7 to 7.9 include a use case diagram that shows the functional scope of a system or application, an activity diagram representing the flow through the ‘order book’ use case and finally an extract from a sequence diagram that shows how that same use case can be realised by a series of internal interactions between components.
Figure 7.7 BookStack Mountain stock management system – use case diagram

Figure 7.8 Activity diagram for ‘record movement’ in use case

Figure 7.9 Sequence diagram (incomplete)
Static data
The class diagram (see Figure 7.10) may be used to model static data, while abstracting out any behavioural facet to the class. Many data modellers are nervous of using UML for this purpose, as they regard it as being too object-oriented and concerned with developing executable code. The syntax can be adapted to do what any data modelling syntax can do. David C. Hay’s book, UML and data modeling: a reconciliation (2011) is an excellent guide to doing this effectively.
Figure 7.10 Class diagram used purely to model static data
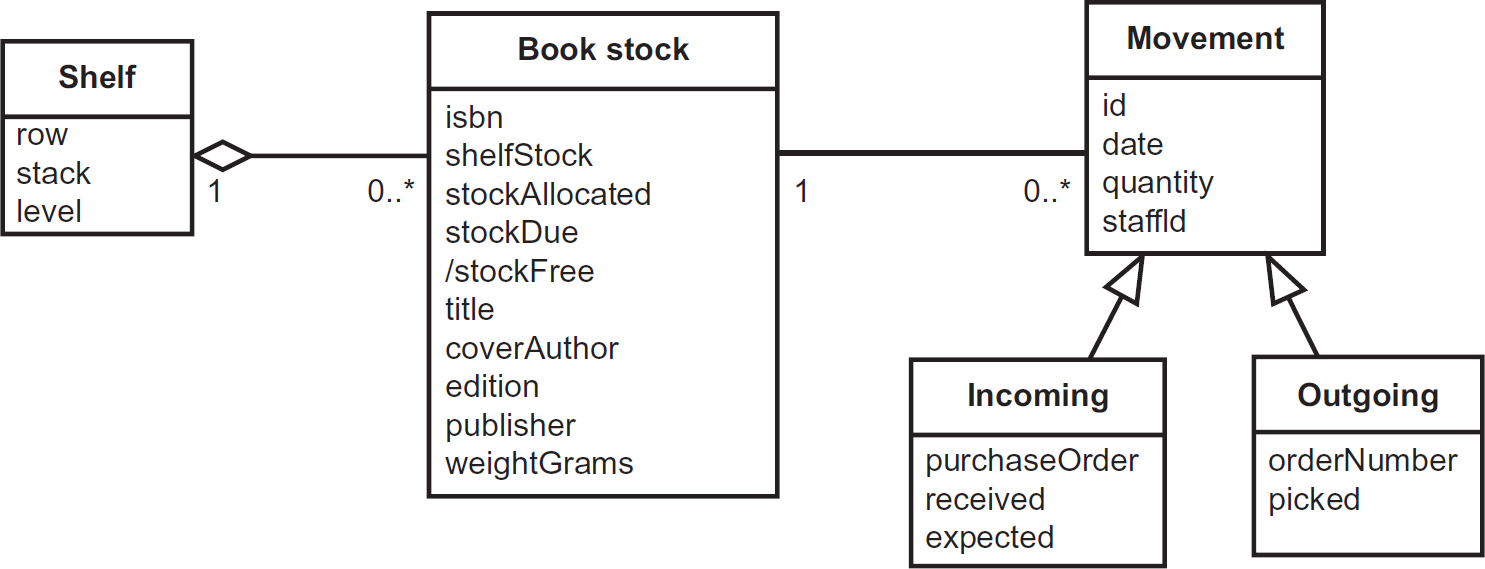
In Figure 7.10, the level of abstraction is such that this is modelling the business view of data and related semantics.
Events
The State machine in UML is an evolution from Harel’s Statechart mentioned earlier, and previously called state transition diagram in earlier versions of UML (see Figure 7.11).
Figure 7.11 State machine for a BookStock instance

ABSTRACTION, LEVELLING AND SCOPE
At the beginning of this chapter, we described modelling as ‘the act of producing appropriate models of these systems through the fundamental act of abstraction’. The consideration of various forms of abstraction were mentioned, so what are these forms of abstraction?
Classification
This fundamental form of abstraction is a very natural device that we, as humans, employ all the time; it is fundamental to our thought processes wherein ideas are distanced from objects. You are currently reading this book, possibly by holding a physical copy of it or viewing an electronic version through another physical device. We must even consider that some readers are in fact listeners having the book read to them either by choice or necessity. We will revisit these physical issues later.
A ‘book’ is a relatively universal concept that we use to classify the idea of a collection of words and/or pictures, such as this specific object that you are currently interacting with. This is one of a number of such objects that you will interact with in your lifetime; there are many more books that you won’t have time for or interest in. Once we have classified such a group of similar objects then we can begin to analyse what they mean as a concept.
A book means a collection of words and/or pictures assembled by an author (or collection of authors as in this instance), usually given a title, associated with a publisher and potentially allocated an ISBN number. A bookshop would know and use this information even if they didn’t have any physical copies in stock.
Classification of, and defining the structure of, a class is the basic abstraction form that is performed during static data modelling. It is not only data that can be classified; for example, user or actor type and component type are elements of other models that we classify.
In entity relationship diagrams, these object types are referred to as ‘entities’, whereas in class diagrams (for example in UML) they are called ‘classes’. These different model forms are described earlier in this chapter.
Generalisation
Generalisation extends the classification abstraction form by recognising that we don’t just group objects into a single class. Objects can be classified at various levels. For example we’ve identified that the ‘book’ class discussed above can come in many different formats; such as printed, electronic or audio book. The content and the author(s) remain the same but there may be different publishers and ISBN numbers for each format. Although the data has a similar structure in this instance, that we may not reflect in an entity relationship diagram, we may wish to identify these specialised types in a class diagram, as they are interacted with in different ways; in other words they exhibit different behaviour.
Figure 7.12 shows an entity relationship diagram and a class diagram for these book types. This class diagram has a different focus to the example in Figure 7.10, as it incorporates behaviour (operations) and so specialises out the formats as they have different ways of being ‘read’ or listened to; whereas the ERD is more concerned with how the data for these various formats can be stored in a single database table.
Figure 7.12 Generalisation and specialisation in class diagram and Barker Ellis ERD form

Generalisation is therefore a means of simplifying a model by grouping a number of classes or entities together, based on their common characteristics. Specialisation is the opposite, where the differences are important and need to be modelled. The general type, or super-type, can describe the common structure and semantics and the specialised types focus on these specific differences. Multiple views of the model, for different stakeholders, may choose to show different levels of specialism.
Composition
Composition is a form of abstraction that recognises that when a number of objects of various types are assembled together, they may form a new kind of object; some stakeholders may only be interested in this composite object, whereas others will need to see its component parts.
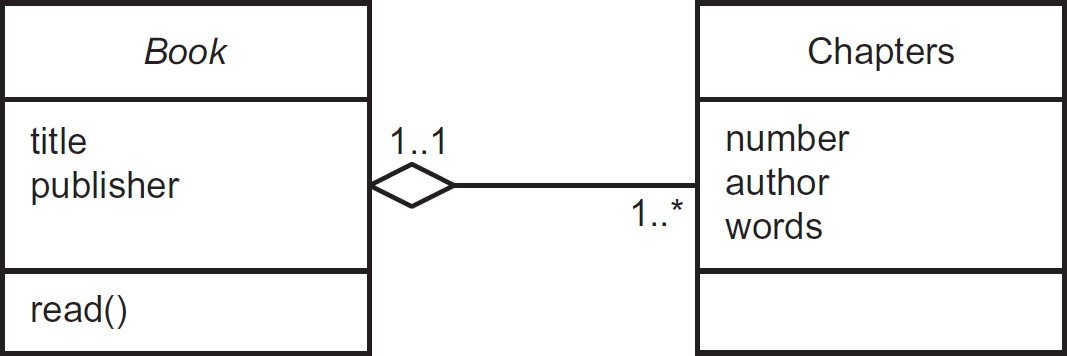
A bookshop system is unlikely to be interested in how this book is a composition of several chapters, each written by a particular author, but the editor’s and publisher’s systems will be. So, whereas the decomposition of a book down to chapters is worth modelling for certain systems, other systems are only interested in the composite ‘book’ (see Figure 7.13).
Figure 7.13 Books composed of chapters (UML)
It is not only data modelling that uses composition; other model elements can also be composed into coarser-grained composite units. For example, in a use case model, a number of related use cases can be organised into a package that represents a broader set of functionality. In software architecture, functional classes can be combined into components, components assembled to form sub-systems and sub-systems assembled into a larger system. Examples of this can be found in Chapter 10. Similarly, a workforce will typically be organised into composite units such as departments or teams, which in turn can be combined into organisations.
Idealisation
The last form of abstraction is idealisation, which was briefly discussed at the start of the chapter. There are various levels of model in addition to Logical and Physical already referred to:
- Contextual model: typically, an unstructured representation that helps to outline the scope and purpose of an element or system. It provides the background for the other levels. It should not be confused with a context diagram which is a black-box, composite view (see below for black-box).
- Conceptual model: a structured description and high-level detail about the element without regard to implementation, for example a business process or data structure. Conceptual models are often incomplete or not structurally robust. When analysing requirements, there are usually multiple Conceptual models presented by different stakeholders based upon their level of understanding or world view; these typically need to be resolved into a single consistent model. This level is extremely useful for modelling business semantics.
- Logical model: Logical models should be more complete and structurally robust while still ignoring implementation issues; this may be the single consistent model resolved from multiple Conceptual models. Logical models can be evolved or ‘designed’. For example, a logical entity relationship diagram can be normalised to be consistent with the mathematically-based rules of relational database design. Functional components can be defined by the services they provide and how they can be assembled in a logical software architecture.
- Physical model: the Physical model considers implementation issues, such as technology-specific details, physical location details and so forth. For example a Logical data model (entity relationship diagram) can be converted into a platform-specific database schema. Functional components can be designed for the technology-specific issues such as the programming language and runtime platform. Usually these models should be described to a point where the solution can be built.
The order and descriptions of the idealisation levels just presented suggest how we can evolve models from an idealised state to a physical state. This can work the other way, by analysing a current physical system and deriving Logical or even Conceptual models from there; see the description of the U-curve process pattern earlier in this chapter.
OPAQUENESS OF MODEL ELEMENTS
As was mentioned earlier, systems are often composed of other systems or components at various levels of granularity. Composition is the form of abstraction that we can use to represent these systems at each level. There are models where we need to show how a system is de-composed down to its component parts and other models where we are only interested in representing the composite, particularly when seeing how it is assembled with other composite elements to deliver a larger system.
Black-box elements
The term ‘black-box’ is used in a number of disciplines to refer to a view of an element (system, component etc.) in a model where we are not concerned about its inner workings, but only concerned with it as a whole and its links and dependencies on other elements. Composition abstraction is key to this, hiding the detail of the next level down. This could be at any level of idealisation (Conceptual, Logical or Physical).
Context diagram
A context diagram is a good example of a black-box view of a whole system. Figure 7.14 is a context diagram for the BookStack Mountain Stock Management system.
In this context diagram, the system is an application represented by a boundary within which there are no details. We can, however, see how this application will need to interact with various external entities (actors), including users such as customers and staff together with other systems such as the accounts system and wholesalers. The nature and detail of these interactions is not defined, so at best this is a conceptual model.
Figure 7.14 BookStack Mountain – context diagram

We can evolve this to a logical, black-box view if we begin to define the nature of these interactions as services this application will provide to some actors, and services this application will consume from others. The use case diagram presented earlier and repeated in Figure 7.15 is an example of this.
Figure 7.15 BookStack Mountain – system use case diagram

The term ‘service’ is deliberately chosen at this stage, not only as it suits a service-oriented approach to developing systems.
A functional component of a system can be described in this service-oriented, black-box fashion allowing the developers choices as to how that component is implemented. This is a key feature of architecture, as discussed in Chapter 10.
White-box views
One stakeholder’s black box is usually another’s white box (where we are interested in its internal workings), whoever is responsible for implementing the functionality specified by the black-box view. This is effectively a decomposition of the functionality.
Black- and white-box testing
Once a black-box element has been defined, tests can be prepared that will test this element independently of how it is implemented. It will pass this black-box test if it does everything it was specified to do and we do not need to examine or even understand its inner workings to perform this type of test.
White-box testing is usually performed by developers and testers to identify where defects are occurring. For example, if a black-box test on a component reveals issues, then white-box testing allows the relevant developer to view its inner workings to find out where the defect exists and hopefully fix it.
See Chapter 11 for more information on the difference between black- and white-box testing.
Service-oriented analysis and design models
The term ‘service’ effectively refers to a logical, black-box view of the functionality of a component or system where its interface in terms of functional calls and their inputs and outputs is defined, but not the internal implementation. This provides a means of defining the system or component’s functional requirements; for example, a system use case description typically details the interaction between the actor and a system from the actor’s external perspective without detailing how the system will perform the interaction; so it is effectively a black-box description of what the service is. See more about service-oriented architecture in Chapter 10.
LEVELS OF MODELS AND MODEL ELEMENTS
Throughout this chapter, the concept of layers or levels of models keeps appearing, representing different forms of abstraction (idealisation, composition and generalisation). There are many ways of levelling and layering based upon the forms of abstraction. A common approach with functional models is decomposition of high-level behaviour into more detailed behaviour through levels of complexity.
As a general rule of thumb, diagrams as views of models work best if they attempt to represent a shallow set of model elements; mixing too many levels in one diagram tends to make it confusing to understand. A hierarchy of separate, stepped diagrams is preferred.
Business process levels
A good example of functional decomposition is Business Process Modelling. Starting from the top, an organisation’s value chain can be presented as a process model, where each element is a high-level business process. Each of those business processes can in turn be decomposed to processes or sub-processes until we reach task level, and tasks can in turn be decomposed to steps. There are many alternative opinions as to how many levels are required; that tends to depend on the complexity of the organisation’s processes!
Functional decomposition
IT systems can be decomposed into similar levels and, at each level, a set of functional units (processes or tasks) can be identified. There is a point at which decomposing the functionality in one diagram form becomes less useful and a different diagram form is more appropriate. An example of this would be to consider each process on the data flow diagram in Figure 7.3 and produce a more detailed data flow diagram for each. When these have reached a certain level, then either a flow chart or a Jackson structure would be more appropriate to model the detail.
Cockburn use case levels
Use cases are an important concept in UML, although their invention and use by Ivar Jacobson pre-dates UML considerably and they are still frequently used in non-UML approaches as a means of modelling requirements.
One important thing to note is that UML only specifies how to draw a use case diagram; it does not specify what use cases represent or how they should be documented. There are many applied uses of use cases in organisations and they can be shaped to whatever people desire them to be; and there often lies a problem of inconsistency and confusion as to what a use case is describing.
The definition we will employ for a use case is:
A description of a required interaction between an actor (user or other system) and the system in focus which is of value to the actor as it helps them achieve a goal. It incorporates multiple scenarios, each telling a whole story, some of which describe the actor succeeding in their goal while others show them falling, usually by not meeting rule based conditions.
But what do we mean by ‘system’ and what are these actor goals?
In his book, Writing Effective Use Cases (Cockburn, 2001), Alistair Cockburn provides two scales by which to classify different types of use case. He also provides a generic template for use case descriptions, from which thousands of organisation-specific templates have been created and within which these scales are used to define the type of use case being described.
The two scales Cockburn provides are:
- Design Scope;
- Goal Level.
Cockburn employs icons in the book to represent these which he has made available to the public domain under the Creative Commons license and are available at his website http://alistair.cockburn.us. These icons are used in the next few pages.
Design scope
This defines what type of system the boundary, if drawn, represents. This also, by implication, defines the type of actor and the nature of their interaction with that system. A couple of the scopes have black- and white-box versions. Cockburn distinguishes between:
- Organisation: effectively a business system which includes all its manual and IT functionality. A business actor is a person (or system) outside that organisation, who interacts with that organisation in the manner described in the use case description.
 Black-box: the internal business functions, IT systems, departments and organisation staff are not specified in the description.
 White-box: the internal elements are referred to in the description.
- System: effectively an IT system or application. A system actor is typically a user or a distinctly separate IT system or application, which interacts with that system in the manner described in the use case description.
 Black-box: the internal components, sub-systems and system architecture are not revealed or discussed in the description.
 White-box: the internal architecture is revealed, to a degree, in the description.
 Component: the system is one of the architectural elements revealed in the white-box, system use case. Its actors will be other components within that architecture.
If we relate these to our forms of abstraction, we can see aspects of idealisation where black box is conceptual or logical, and white box is logical or physical depending on how specific the descriptions are.
Goal level
Across these different system scopes, actors have different goals. These goals should not be to use part of a system, but to what end are they using the system as a means. For example, a system use case called ‘Record new order on the system’ does not represent the real-world goal that an actor would want to achieve; their goal is to ‘Create new order’ and the system will aid them in achieving this. So ‘Create new order’ is the better name as the first example is too focused on the system itself.
Across these system scopes, different actor types can have goals at different levels, which Cockburn refers to as:
 Summary Goal (kite-level): typically equivalent to an end-to-end business process goal, which will take place over an extended period (typically hours, weeks or even months) and involve a number of people and systems to perform distinct activities, each of which can be described at the next level.
 User Goal (sea-level): equivalent to a task, performed by a single person or application, in one place at one time (seconds or minutes at worst). This goal is a complete, meaningful objective akin to a transaction.
 Sub-goal (fish level): not a meaningful goal in its own right, so only decomposed if it is a significant interaction to be reused within several user-goal use cases.
Use cases at sea level and above are typically focusing on requirements and the ‘why?’; whereas below sea-level they begin to describe the ‘how?’
Cockburn also defines a higher level, ![]() ‘very high level’ or cloud level, but this is too strategic a level to be useful to model with use cases. Relating this to other concepts, this level is equivalent to the complete business process value chain, where strategic goals are measured with key performance indicators and critical success factors.
‘very high level’ or cloud level, but this is too strategic a level to be useful to model with use cases. Relating this to other concepts, this level is equivalent to the complete business process value chain, where strategic goals are measured with key performance indicators and critical success factors.
There is also at least one lower level, ![]() ‘too low’ or clam/sea-bed level. Some have even alluded to lower levels such as worm-level. This is where we may find lines of executable code! These levels are certainly too low to model with use cases.
‘too low’ or clam/sea-bed level. Some have even alluded to lower levels such as worm-level. This is where we may find lines of executable code! These levels are certainly too low to model with use cases.
Cockburn’s Writing effective use cases (2001) provides many examples of use cases of various types and suggests employing a variety of use cases in any project.
Functional model map
A grid to classify functional modelling elements
This author has successfully utilised the scales defined by Cockburn, and described above, to define a framework for classifying functional models including use cases. Alternative equivalent scales can be utilised if they are a better fit to how the organisation currently models or intends to in the future.
The functional model map (FMM) is used to select which model types a team should employ at which levels in order to provide a mappable, traceable route from high-level business requirements to low-level technical design. Figure 7.16 presents the basic grid these levels (including those defined but not used by Cockburn). The black-/white-box sub-columns can be removed if desired.
Figure 7.16 The Functional model map and development activities
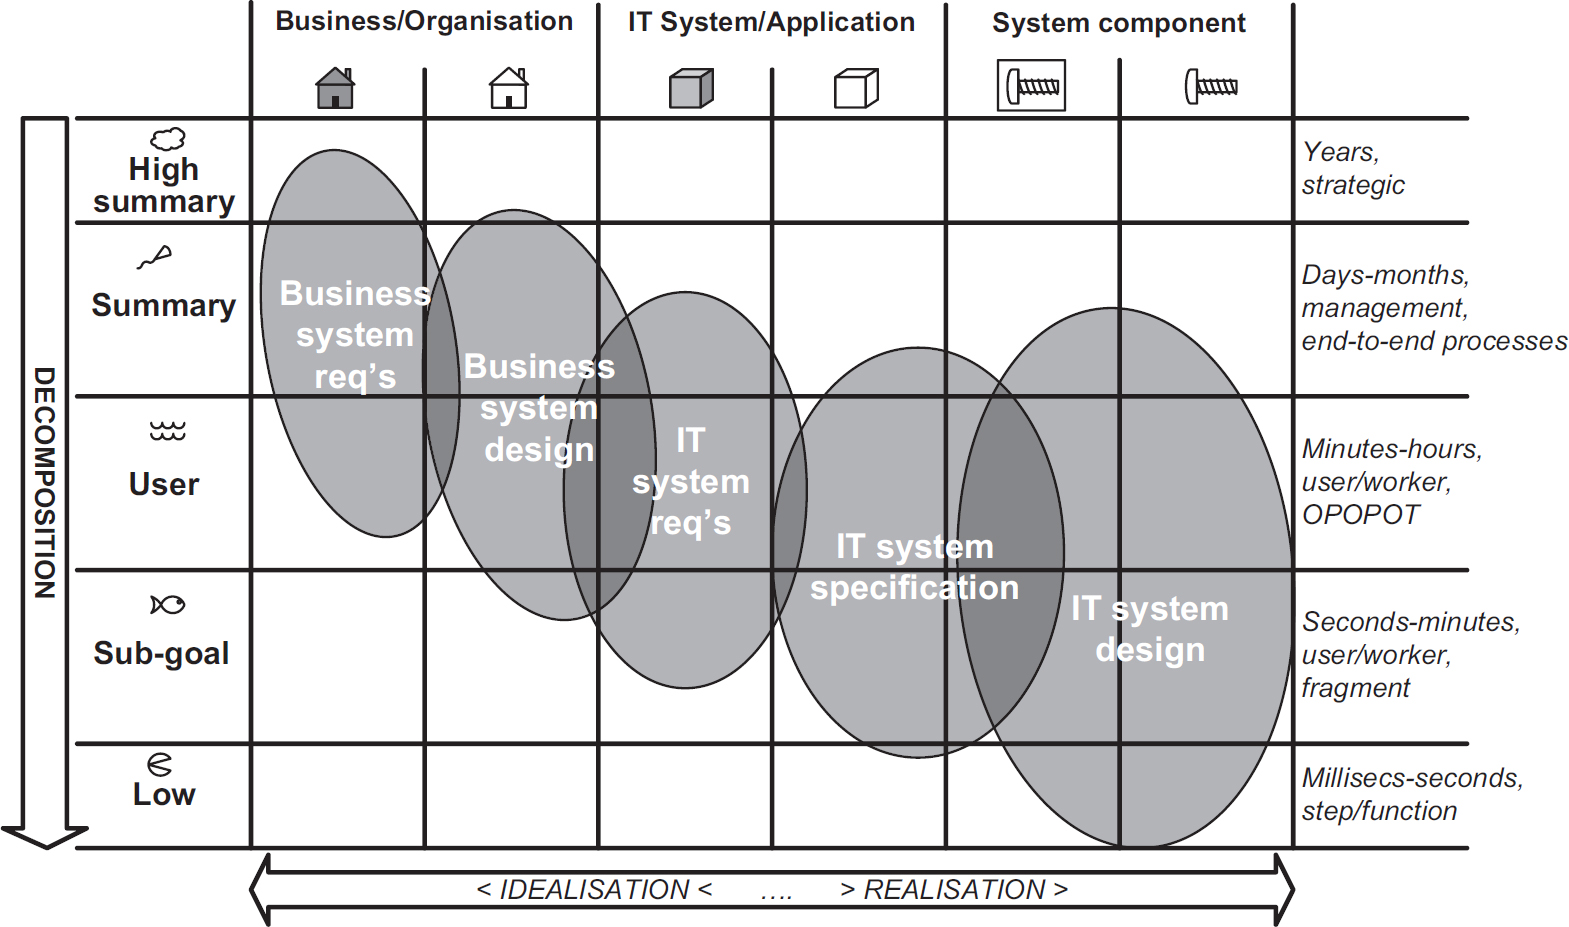
The general trend in most solution development processes is to start with high-level business objectives and to end up with a delivered solution, including – but not exclusively – IT. In the functional model map, this means plotting a route from top left to bottom right.
Models and techniques to explore those requirements and to define changes to business processes are explored down the business system column levels (Cockburn’s organisation).
Some of these changes to the business model will involve the use of IT systems, which is where the system black-box column is useful to define the requirements of IT, in the form of applications and application services, to support the business.
As one moves into the system, white-box column and the component columns, then IT system specification, system architecture and design become the focus.
It is not the aim that every cell of this grid is populated with a functional model or technique. Rather, the aim is to identify and employ a set of techniques that will allow the team to map a route from business requirements and models to detailed design without any large leaps.
One could employ use cases of various types to traverse the grid; the following grid shows the use of use case types referred to as business use cases (BUCs), system use cases (SUCs) and design use cases (DUCs) (see Figure 7.17).
Figure 7.17 Functional model map, populated with typical use case types
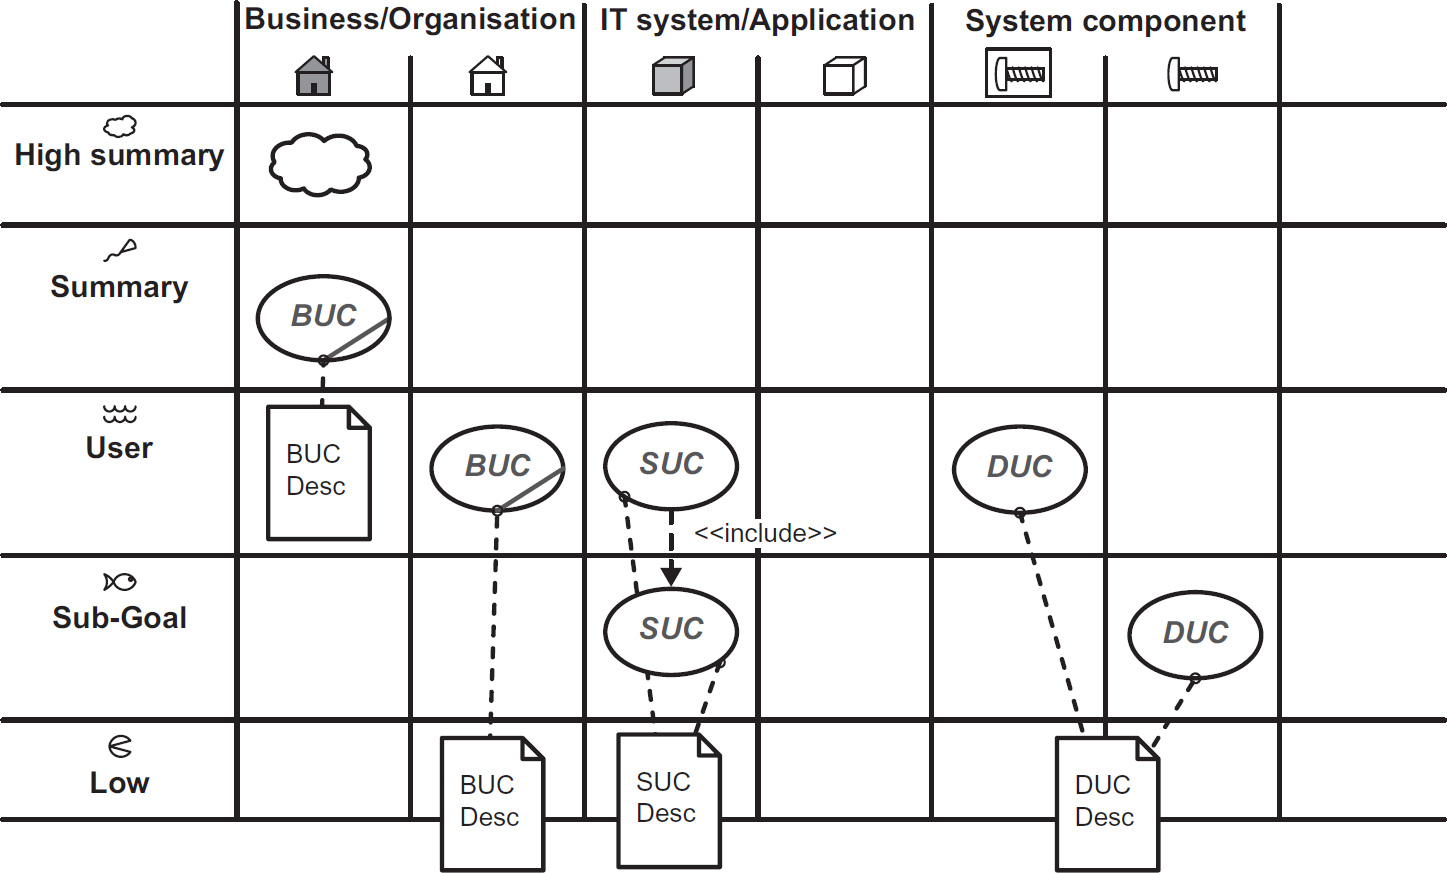
There are, as already discussed, other functional models that can be employed to populate the model. In Figure 7.18, the business use cases have been replaced with business processes, decomposing from the value-chain (cloud-level) down to business tasks (sea-level). In the system columns, system use cases remain the ideal choice. Detailed technical design with use case descriptions is possible but not recommended. There are many alternatives, such as activity diagrams, but interaction diagrams (usually sequence diagrams) are especially useful to capture the detail of sub-systems, components or classes interacting with each other via service or function calls to perform logical or physical design.
Figure 7.18 Functional model map, populated with diagram types selected for a specific project

At sea-level, interaction diagrams that model the steps of a system use case are often referred to as ‘use case realisations’. In the Unified Process, these are represented by dotted ellipses to reflect this link. The participants in this interaction are the top-level architectural sub-systems and components that will be reflected in software architecture (covered in Chapter 10). Below this level, the internal mechanisms of each component can be designed (black boxes in black boxes) until functions/methods and source code-level are reached.
The pivotal role for system use cases
What this framework reveals all too clearly is how, without the system column(s), we are left with a gap in understanding between business and IT. Business models are designed to be understood by business stakeholders, but usually lack sufficient detail for the developers to understand the businesses requirements of the IT system as components of their solution. Similarly the technical models with all the logical and physical IT design elements are too detailed to reveal to the business stakeholders what the IT solution will do for them.
System use cases, even lightweight versions, bridge this gap when employed correctly; that is their role and there are few, if any, alternative modelling techniques that perform this task as well as they do. They tend to find a place at the heart of this framework.
CROSS-REFERENCING MODELS, FACETS, PERSPECTIVES AND TRACEABILITY
Producing a number of models is all well and good, but in order to be effective they need to be consistent with each other in terms of:
- validating that model elements can be traced back to underlying business requirements;
- cross-referencing elements in one view or model to related elements in other models where there is some dependency; for example, certain events can be mapped to use cases, which in turn are mapped to the static data they manipulate;
- ensuring different views are modelling consistent system scopes;
- checking that models and views conform to the same semantics; i.e. calculations and conditions in Physical models correctly implement business rules defined in Conceptual and Logical models.
Maintaining and checking these cross-references and mappings is essential to ensure quality:
- Traceability from business requirements to deliverables via intervening models can reveal the following:
- Links between models and views can reveal:
- structural inconsistencies due to misinterpreted requirements and poor assumptions;
- consequential impact from changes to elements in one model or view on which other elements have some dependency; the second dimension of impact analysis.
Maintaining cross-references and mappings requires effort and is where true modelling tools (rather than just diagramming tools) earn their keep.
Matrices
A common way to maintain and view these dependencies is in the form of matrices, where the set of one element type is reflected in the rows and a set of related element types is reflected in the columns. Each cell can be annotated to indicate some relationship between the row and column element in a manner suitable to the relationship type.
Examples of such matrices include:
- Mapping functional business requirements to system use case: this reveals which requirements have and, more importantly, have not been incorporated into the system functional model.
- Mapping entities in a Conceptual data model to those in the Logical data model or on to physical database tables: at the first level, this is done to ensure that all the data entities have been incorporated; then to indicate where the data semantics (meaning and rules) need to be checked for consistency.
- Mapping external entities of a system (actors) to the services they require from the system: this can be done as a matrix, but a commonly used graphical alternative is a use case diagram.
- Mapping events to the functional elements that are triggered.
- Mapping functional elements to static data elements at any level of idealisation: a commonly used example of this is referred to as the CRUD matrix (see below).
- Mapping events to the data elements that are likely to be effected can also be shown in a CRUD matrix.
These last three reflect the triangular dependency between the main three views: events, functionality and static data.
CRUD matrix
The name of this matrix reflects the annotations that are made in the cells, where for every function or event mapped to a static data type whether an instance of that data type is:
- Created: a new entity instance or object is created in the system usually capturing some input.
- Read: an existing entity instance or object has its data read, either for internal processing purposes or to produce output.
- Updated: an existing entity instance or object has its data changed based upon some input or to reflect a change of status.
- Deleted: an entity instance or object is removed from the system, deleting the data contained.
The actual elements on each axis depends on the nature of the models. Commonly, this is one of the following:
- functions or processes mapped to entities in an entity relationship diagram;
- use cases mapped to classes representing data (see Figure 7.19 for an example);
- business trigger events mapped to either entities or classes depending on which notation is used.
Figure 7.19 CRUD matrix – mapping use cases to classes

A cursory analysis of Figure 7.19 reveals that the use case model is probably missing use cases that delete any of the class instances and a use case to create shelf instances.
Functional model map
The functional model map, described earlier, provides a route showing where paths traverse models across two dimensions of abstraction. Vertical paths indicate where composition/decomposition needs to be managed and horizontal paths where idealisation/realisation is being performed. Figure 7.20 shows where these paths can be combined to provide traceability from high-level business objectives through the models previously chosen in Figure 7.18 to low-level technical design artefacts.
Figure 7.20 Functional model map, overlaid with traceability paths from requirements to code

DOCUMENTATION AND SPECIFICATION WITH MODELS
Models are representations of systems, and a picture may well paint a thousand words. There are, however, circumstances when models have to be combined with other artefacts and words to create documentation. Different development lifecycles tend towards different styles of documentation; these exist along a continuum from Waterfall lifecycles to Agile approaches through various incremental processes.
Waterfall lifecycle documentation
A Waterfall or linear development lifecycle typically progresses on the basis of producing a series of documents as products of each stage that can be thoroughly reviewed and signed off before acting as input to subsequent stages:
- business case and feasibility study;
- requirements document;
- system specification document;
- system design document;
- test documentation;
- implemented system documentation:
- operations manual
- user documentation
- training materials.
Note the distinction between the requirements document and a system specification. These are different documents to different levels of abstraction, especially idealisation, although many combine them to either the detriment of the requirements or the specification.
There will also exist a set of related management documentation, such as project plans.
Agile documentation
There are some who believe that an Agile approach requires no documentation; beware of such snake-oil sellers. An Agile approach certainly does not require all the documents listed above in that form, but there usually needs to be:
- a business case defining scope and providing the project justification with which to control the project;
- evidence of testing and quality control;
- documentation for the released product (ops manual, user documentation and training materials).
An issue within Agile approaches is determining what documentation is maintained about the requirements, specification and design activities. The Agile Manifesto (discussed in Chapters 2 and 6) states that the authors have come to value ‘Working software over comprehensive documentation’, but that still means that some is required. Requirements may typically be in the form of user stories written on cards (Cohn, 2004) or on sticky notes on a kanban board.
One of the Agile Manifesto’s 12 principles is ‘The most efficient and effective method of conveying information to and within a development team is face-to-face conversation.’ The act of modelling on whiteboards and within suitable tools as an activity is wholly consistent with this, so as much of the documentation as possible should take the form of these models.
Earlier in this chapter, we indicated that the value of modelling can be accrued from both the act of modelling and the finished model as a deliverable. Take a picture of the whiteboard after the conversation and store it for future reference at least!
Incremental approaches
There are many Incremental processes with different patterns; these distinguish themselves from ‘pure’ Agile approaches in that they tend towards developing a certain level of requirements and architecture design up front.
These approaches are different from ‘Big Analysis Up Front’ approaches that can lead to ‘analysis paralysis’ (the inability to move out of analysis as things keep changing) or ‘Big Design Up Front’ that tends to inhibit re-factoring the architecture at a later stage when issues arise.
In these approaches, high-level requirements and logical design decisions are reached in an initial phase, then a series of Incremental stages perform detailed analysis and design of that part of the system before developing, testing and potentially delivering the increment to the end user. In this situation, the requirements, specification, design and test documentation will not be complete until the end of the project. An example of this is the 4 + 1 architecture approach of the Unified Process.
Unified Process
The Unified Process is a development process evolved as a generic version of the original Rational Unified Process (RUP). RUP was originally developed alongside UML, which provided the modelling notation while RUP described the process.
The Unified Process 4 + 1 view model of architecture (Kruchten, 1995) considers five views of a system that start empty but ‘fill up’ at different rates through the project; all will be full when the project is completed (see Figure 7.21).
Figure 7.21 Unified Process 4 + 1 architecture
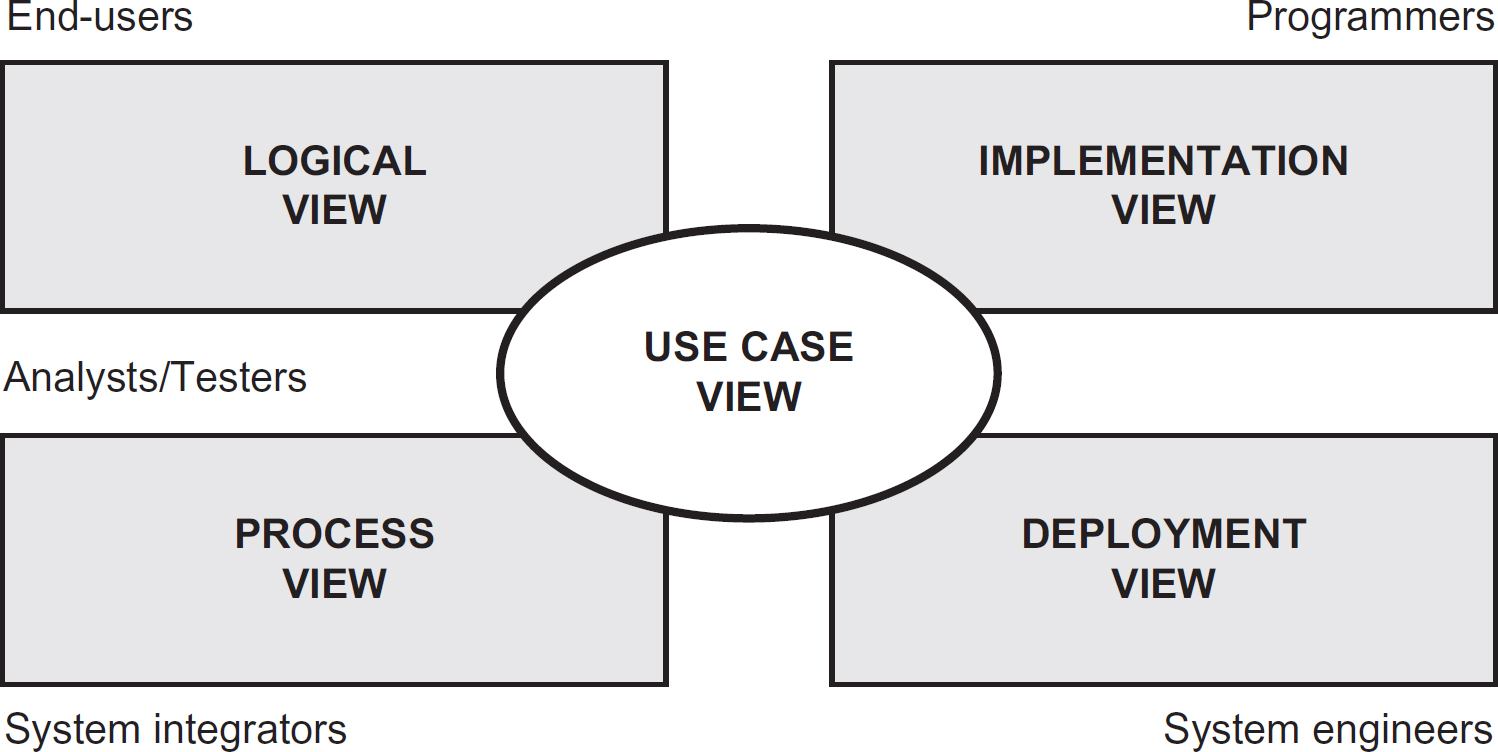
The 4 + 1 views are:
- Logical view: the functional requirements of the system.
- Implementation view: the organisation of static software modules, data files, components and so forth that implement the system.
- Process view: the behaviour of the system at run-time.
- Deployment view: how executable and other run-time components are deployed onto platforms on a network.
- Use case view: the means of chunking the system into bite-size deliverables that can drive the planning of the iterations (stages) and all the activities therein. This is the + 1 in the model.
CONCLUSION
With so many alternative lifecycles, methods, frameworks and notations – or whatever pick-and-mix of these you adopt as an approach to developing business solutions incorporating IT – modelling is likely to be a key activity. This chapter, indeed this whole book, would be unable to describe all of the alternative models and diagrams that the twenty-first-century development team have on offer; it does, however, aim to provide readers with the ability to understand why there are so many choices and enable them to understand the value of selecting a set of appropriate models for any given project.
A significant factor in these choices will be practical ones such as:
- what modelling skills team members possess;
- what tools, whether pen and paper, diagramming software or modelling software are available to the team;
- what standards are adopted within the organisation or even industry.
Even if the selection is mandated, most of the techniques mentioned can be used in a number of contexts, so the team needs to determine what each diagram or model should mean in terms of:
- What is its purpose and at what part of a process?
- Who is its audience and what are their concerns?
- What level of abstraction(s) are therefore suitable?
Most important of all, before spending time and effort modelling each artefact:
- Is it or will it be useful?
REFERENCES
AgileManifesto.org (2001) Manifesto for Agile Software Development. www.agilemanifesto.org (accessed 4 June 2014).
Booch, G., Rumbaugh, J. and Jacobson, I. (2005) The unified modeling language user guide (2nd edition). Addison Wesley, Upper Saddle River, NJ.
Box, G. E. and Draper, N. R. (1987) Empirical model-building and response surfaces. Wiley, Upper Saddle River, NJ.
CCTA (2000a) Behaviour and process modelling. TSO, Norwich.
CCTA (2000b) Data modelling. TSO, Norwich.
CCTA (2000c) Database and physical process design. TSO, Norwich.
CCTA (2000d) SSADM foundation. TSO, Norwich.
Cockburn, A. (2001) Writing effective use cases. Addison-Wesley, Boston, MA.
Cohn, M. (2004) User stories applied: for Agile software development. Addison-Wesley, Boston, MA.
Date, C. J. (2000) An introduction to database systems (7th edition). Addison-Wesley, Boston, MA.
Hay, D. C. (2011) UML & data modeling: a reconciliation. Technics Publications, Westfield, NJ.
Jacobson, I. (1992) Object oriented software engineering. Addison-Wesley, Boston, MA.
Kruchten, P. (1995) ‘The 4+1 view of architecture’. IEEE Software, November 12, 6, 45–50.
Kruchten, P. (2001) The rational unified process, an introduction (2nd edition). Addison-Wesley, Boston, MA.
Larman, C. (2005) Applying UML and patterns (3rd edition). Prentice Hall, Indianapolis, IN.
Martin, J. (1977) Computer data-base organization. Prentice Hall, Indianapolis, IN.
Podeswa, H. (2010) UML for the IT business analyst. Course Technology, Boston, MA.
Skidmore, S. and Eva, M. (2004) Introducing systems development. Palgrave MacMillan, Basingstoke.