19
Technological, Monetary and Financial Crashes
19.1. Yet another view to complexity
The world, as a living organism, is submitted to an evolution that is not mandatorily linked with a pre-defined strategy. Here, we will only recall two main interconnection architectures used in interconnected networks: the hypercube and feedback loops. Both provide advantages which have been described elsewhere [MAS 17b]:
- 1) let us denote by “n” the connectivity (number of edges issued from a vertex in a network). A hypercube is an n-dimensional analogue of a square (n = 2), a cube (n = 3), a hypergraph (n = 4), etc. It is a closed, compact, convex geometrical structure, with each 1-skeleton (node) consisting of groups of opposite parallel line arrows aligned in each of the space’s dimensions, orthogonal to each other, and of the same length. The unit hypercube’s longest diagonal in n dimension is equal to
 , which is of key importance to optimize the global connectivity, in interconnected systems (communication);

Figure 19.1. Hypercube whose corners (or vertices) are the 2n points in Rn
- 2) feedback loops: as shown in Figure 19.2.
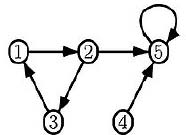
Figure 19.2. Feedback loops (source: http://www.businessdictionary.com/definition/feedback-loop.html)
Feedback loops represent a reaction embedded in a system: it is a channel or pathway formed by an “effect” returning to its “cause” and generating more or less the same effect. A dialogue is an example of a feedback loop. Feedback can depict either an amplification (positive) or attenuation (negative) nonlinearly.
Also, feedback loops can include several concepts (or vertices) in an interconnected graph, thus resulting in amplified effects (global trends) that can impact a society and stagger it [MAS 06].
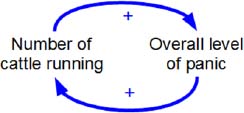
Figure 19.4. The positive feedback loop of population growth
This creates nonlinear amplifications or attenuations, which cause strong deviation in the process evolution, and then instabilities so that we cannot predict the occurrence.
19.1.1. Global complexity of economy
When considering a holistic view of the economy, we can quote, hereafter, the complete graph used in the WEF (World Economic Forum) held every year in Davos (Switzerland). This figure increases the risks in economy [GEO 14].
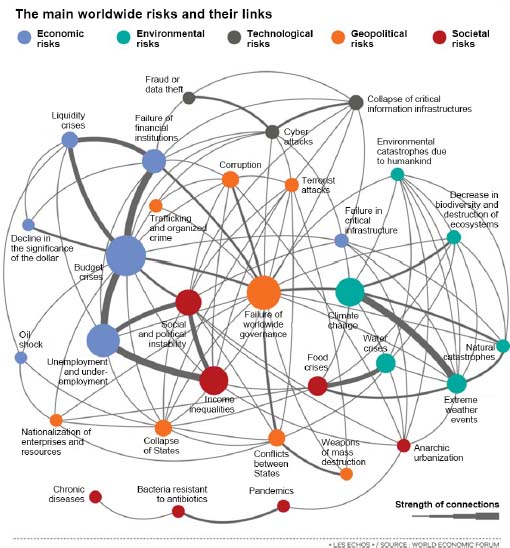
Figure 19.5. The main worldwide risks and their links. For color versions of the figures in this book, see www.iste.co.uk/massotte/complex.zip
Several comments and difficulties can be expressed:
1) Predictability
As shown in Figure 19.5, two basic mechanisms are present in the structure of an interconnected system. Therefore, many emerging phenomena exist, which we cannot control.
In the field of risk management, we can quote the work of Berthoz and Debru [BER 15]. Any complex system is based on truths existing in Nature.
The fundamental properties of the living beings, as well as anticipation and prediction capabilities are at the heart of our lives and each of our actions: they include how we can calculate the chances that a politician will be elected or re-elected, the risks that the airplane might crash, as well as the chances that we will benefit from a favorable weather forecast during our holidays.
We must take into account a great deal of data and economic constraints, as well as consider the psychological and neurobiological mechanisms involved in our capability for anticipation.
In fact, when we can no longer predict, we must at least anticipate the risks and dangers that we will have to face.
How can we project ourselves into the future? What logic, emotions, morals and consciences should we choose? How does man react to situations that force him to adapt or to drastically reconfigure his existence?
Here, we must consider multi-disciplinary and interdisciplinary approaches as defined at the Interscience Center of the EMA (Ecole des Mines d’Ales) [MAS 04].
2) The plausible economic and technical risks
The WEF (World Economic Forum – Davos) has classified the plausible economic risks into three categories:
- 2.1) risks of most concern, such as budgetary crises, unemployment and underemployment, water crises, income inequalities and climate change;
- 2.2) most plausible risks, such as income inequalities, extreme weather events, unemployment and underemployment, climate change and cyberattacks;
- 2.3) risks likely to have the greatest impact, such as budgetary crises, climate change, water crises, unemployment and underemployment, collapse of critical information infrastructures.
On the other hand, if we try to point out disruptive paradigms, we will observe that all these above risks are known as being “usual” causes of deviances. Nothing original is noted as “monetary” risk! If we try to anticipate new situations, it is perhaps advisable to be more imaginative in assuming that unpredictable causes will arise. Indeed, monetary causes will take precedence over budgetary, then economic crisis.
3) Interconnected risks
In the face of increasingly interconnected risks, the weakness of global governance could have very serious consequences in the next decades. This is stated either by experts, during the World Economic Forum, or by data scientists evolving within the Big Data environment.
Most studies, in the WEF, focus on five risk categories (economic, environmental, technological, societal and geopolitical), but this seems incomplete and has to be completed (Gödel’s incompleteness theorem).
Today, topics related to the economy and climate often come first. However, in view of the financial crises, and the problems encountered worldwide, such as the high level of unemployment and underemployment, and the increase in income inequalities, what is the major disaster to be taken into account? Is it only climate change and water-related crises that affect one part of the planet?
The way in which the systemic risks are involved in interconnected systems shows that some risks interacting, positively or negatively, with each other are able to collapse the entire systems. Thus, any risk considered could lead to a worldwide and disruptive failure. However, it is their interconnection that poses the greatest danger: hence, the K-connectivity within the network system is very important as it significantly changes the model and processes used in diagnosing, managing and correcting the complex systems.
4) The “Gödel” paradigm: incompleteness and lack of consistency
Here, we can quote two main characteristics of the so-called Gödel incompleteness theorems.
They consist of two theorems of mathematical logic that demonstrate the inherent limitations of every formal and axiomatic system able to model basic arithmetic [Kurt Gödel – 1931]. They also define the main principle of evolution in Nature:
- – The first incompleteness theorem states that no consistent system of axioms whose theorems can be listed by an effective procedure, or algorithm, can prove all truths about the arithmetic of the natural numbers. For any such consistent formal system, there will always be statements about the natural numbers that are true but unproven within the system.
- – The second incompleteness theorem, an extension of the first, shows that the system cannot always demonstrate its own consistency and converge towards a lack of reasoning.
Indeed, in systems based on knowledge or reasoning, the more we want to explain a phenomenon, the more, as we have known for a long time, we increase its complexity and the more it “digs its own grave”. Similarly, the more we seek to perfectly represent an organism, the more it becomes diversified and the more it is exploded until it can no longer be fully described (incompleteness) or there is a contradictory case (inconsistency or incoherence) which blocks its model.
Similarly, with regard to the dissipative structures of Progogine, a machine is equipped with reflexes, but no thinking. It cannot detect unexpected feedback loops (not previously programmed by the designer) or ensure the repetition of unforeseen structures already experienced in the past of this machine. This problem may be considered as the “dual” problem of Gödel: it expresses the limits about the formal logic and on the “consciousness” for feedback loops existing in a machine.
5) The folding effect in the society: the wild individualism
Using Figure 19.5 related to the economic interconnections, we can explain the failure of global governance bodies to deal with the challenges facing our world (e.g. the sub-prime crisis in 2008). The explosion of debt and the slowdown in emerging countries, which followed the 2008 crisis, have accelerated the trend of countries to fall back into themselves and to challenge (or formulate criticism against) international institutions. When an individual is in a state of crisis, it is always difficult to mobilize him or her in favor of a global governance because, in Nature, it is first the resilience of each individual that takes precedence, to the detriment of the general sustainability of the system.
In fact, every day, we can see how much each one is acting on his or her own interests. This is natural because every living organism is evolving in a prey–predator system: this, however, fuels that we call “individualism” at all levels.
Hence, such a situation can explain the difficulty of each country in acting together, as for the climate (with the global warming effect), and the reluctance of the world community in adopting agreements at the international level. This is also valid for health, financial regulation or energy resources.
Impacts on finance and banking: if international institutions do not challenge their strategy, by acting faster and more efficiently, and if governments are not able to assign enough efforts and/or resources to meet such big challenges, then Nature will do it for us.
19.2. The reference financial systems are continuously changing
19.2.1. The US Dollar and Chinese Yuan
As an example, to compare the influence of dollars and Chinese renminbi, we can detail the following: in Q1 2018, the total global foreign exchange reserves, including all currencies, worldwide, rose 6.3% year-over-year, up to $11.59 trillion. For reporting and comparison purposes, the IMF (International Monetary Fund) converts all currency balances into US dollars. The US-dollar-denominated assets continue to dominate among all the foreign exchange reserves (62.5% of “allocated” reserves) [POP 15].
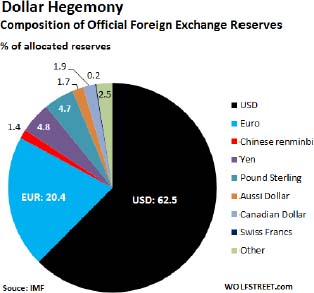
Figure 19.6. Dollar hegemony. For color versions of the figures in this book, see www.iste.co.uk/massotte/complex.zip
Similarly, the SDR (Special Drawing Rights) also evolves over time. Below is an example to show how we spent from 1976 to 2016.
- – Following the collapse of the gold standard, commonly known as the Bretton Woods agreements, in 1973, the SDR was redefined as a basket of currencies, which today includes the euro, Japanese yen, British pound and the US dollar.
- – Now, China wants to compete against the “exorbitant privilege” of the US dollar, making it just another currency. This explains China’s massive gold purchases, especially since 2008. The Chinese Yuan was effectively added to the SDR basket on October 1st 2016.

Figure 19.7. The IMF Special Drawing Rights basket of reserve currencies. For color versions of the figures in this book, see www.iste.co.uk/massotte/complex.zip
Considering the evolution of the SDR, we can think that the Yuan will not be the only one to be added? Will Russia, India and Brazil agree, or will they ask for their currencies to be taken into account as well? Could gold be part of a form of SDR?
Revisiting the structure of SDR is not a sustainable solution. This will only delay the inevitable collapse of the current international monetary system, based on beliefs, desires, intents and promises. Politically, it is always easier to get a consensus for printing more SDR, spending more than cuts in spending. Therefore, there is a much more probable risk of a monetary crack.
I therefore expect the problems we are currently experiencing with the US dollar to persist, if not worsen, with a fiduciary SDR.
19.2.2. Lifetime of a currency. Importance of gold?
Analyses of the currencies that were used in the past give an average lifetime of only 27 years. Thus, it takes a delay of only 27 years to get one currency dethroned by another one and to make it disappear (the euro, which was created in 1999, will follow the same evolution). On the other hand, in all cases, we observe that gold is the best money that passes through the uncertainties of our world. In Figure 19.8, we see that no currency could keep its status forever.

Figure 19.8. Reserve currency status
The end of the dollar, as for the euro, as the main currency reserve, is inevitable. Hence, China and many other major countries are pushing for the need for a big monetary reform and are already working to define an international reserve currency.
For economic and societal reasons, all countries are weakening their currency: a less valuable currency reduces the burden of debt, increases the number of exported products and finances public debts.
Statistically, since 1999, the US dollar, which is the current national reserve currency, has lost nearly 80% of its purchasing power compared to gold. In fact, all the currencies such as euro and dollar are losing their purchasing power. This is due to the short-term management from governments, which, as only solution to their problems, print banknotes.
Similarly, it should be noted that in the long term, gold does not take more value: it simply remains stable over time. When the price of gold varies, this is because there are short-term activities that will have little impact on the stability of gold. For instance, between 2001 and 2011, the gold price performance was 600%. The price of one ounce of gold has to be multiplied by five over this period. Hence, gold is a safe haven: at present, emerging countries such as Russia and China are increasing their reserves at a rate never seen before.
19.2.3. Distribution of GDP around the world
We are coming to the end of a 70-year economic cycle, after World War II and the so-called decolonization: several great European countries have a diminishing economic dynamism. Moreover, around 2032, China could become a world’s leading country in front of the United States. Finally, the BRICS (Brazil, Russia, India, China and South Africa) are also developing rapidly. This is the kind of upheaval with which we will be faced.
Indeed, our so-called developed countries (sometimes in a relatively sluggish state, with some advanced development) are competing with new countries that are the size of a continent, like China or India, able to innovate and to produce at a lower cost. They are no longer developing nations (not to say poor countries) because they developed high-skilled universities (education) and control advanced technologies. These countries are growing rapidly, with double-digit growth rates. Gradually, these nations have the same needs as ours, they consume more energy and so on: they are no longer emerging countries. They want to benefit from their share of the pie, make choices in quality of life and claim themselves as leaders.
19.2.4. In terms of economical and overtime evolution
The International Monetary Fund (IMF) estimated the global GDP at US $79,865 billion in 2017. That is, for a global population of 7.44 billion in 2016, the average GDP per capita was $10,152.
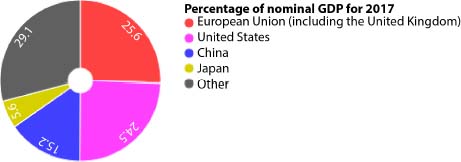
Figure 19.9. Nominal GDP for 2017. For color versions of the figures in this book, see www.iste.co.uk/massotte/complex.zip
The list of world countries by nominal GDP is the non-exhaustive classification of the nominal gross domestic product, i.e. at current prices of the countries and certain autonomous territories.
GDP values, in dollars, are calculated using official exchange rates.
For more details, we can detail each performance as follows:
| Rank | Country or territory | GDP (in billions of dollars) |
| 1 | 19,390,60 | |
| – | 17,308,861 | |
| 2 | 12,014,61 | |
| 3 | 4,872,14 | |
| 4 | 3,684,82 | |
| 5 | 2,624,53 | |
| 6 | 2,611,01 | |
| 7 | 2,583,56 | |
| 8 | 2,054,97 | |
| 9 | 1,937,89 | |
| 10 | 1,652,41 | |
| 11 | 1,538,03 | |
| 12 | 1,527,47 |
These data from the IMF show that the United States is still in a dominant position with 25% of the global GDP. Then, Europe and China are following up this leadership.
Note that for the sake of consistency, we talk about GDP. As a reminder, the gross domestic product (GDP) is the sum of the added values provided by all the companies (national or international) located in a country. GDP should not be confused with GNP (Gross National Product), which accounts for all activities (goods and services) produced in a country.
19.3. Conclusive discussion
There are numerous “hotspots” between East Asia and Central Asia, including Korea, South China Sea, Afghanistan, Syria, Iraq, Iran, Ukraine, Libya, now Venezuela (through the problem of Presidential elections), etc. All these countries are linked to a single factor: to resist the strategy provided by a declining major leadership of the Western America which is trying to prevent the emergence of new economic and social competitors [DIN 17].
This strategy (regardless of the societies and periods of time) is always associated with military forces and their political influence. For example, we can quote the US military pressure in the South China Sea, the US/NATO support in Ukraine or the subsequent confrontation with Russia.
19.3.1. Problem of gold and rare earth materials
The United States has not had a real surplus in their budget for almost 60 years and has been running a balance of payment deficits every year since 1975.
However, they could avoid bankruptcy thanks to their economy (25% of the world PIB), world’s reserve currency and military power.
On the other hand, Russia and China know that any indebted country will not be able to solve its debt problem by issuing more debt. Hence, Russia, China and India buy most of the world’s gold production every year. In May 2018, Russia added nearly 20 tons of gold to its financial reserves. Since January 2018, the US debt has risen 6% (e.g. 1.1 trillion), reaching about $21 trillion. Meanwhile, Russia bought an additional 9 million ounces of gold (300 tons), which increased its reserves up to $80 billion.
Similarly, China has invested heavily in the resource sector in most parts of the world. China knows that commodities are heavily undervalued relative to the bubble equity markets. Today, China is a predominant supplier of the 17 rare-earth elements: cerium (Ce), dysprosium (Dy), erbium (Er), europium (Eu), gadolinium (Gd), holmium (Ho), lanthanum (La), lutetium (Lu), neodymium (Nd), praseodymium (Pr), promethium (Pm), samarium (Sm), scandium (Sc), terbium (Tb), thulium (Tm), ytterbium (Yb) and yttrium (Y).
In addition, these elements are more prevalent in production in the renewable energy technology industry, military equipment industry, glass making and metallurgy. At the same time, China has purchased a significant percentage of the annual gold production since 2008, bringing the country’s total purchases to 16,000 tons.
Except for gold, all currencies have lost 97–99% of their value in the last 100 years, and it is therefore extremely likely that this will continue. Hence, there is no predominant currency, and this will change continuously.
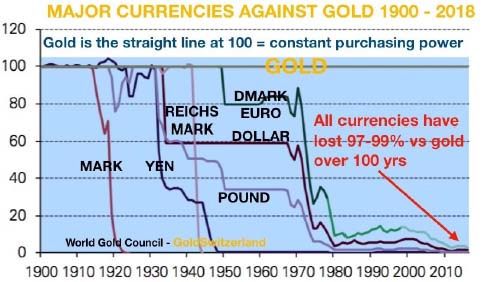
Figure 19.10. Major currencies against gold 1900–2018. For color versions of the figures in this book, see www.iste.co.uk/massotte/complex.zip
19.3.2. Summary and main conclusions
The dollar still dominates world currencies, but China has become the second largest economic power on the planet; but its currency is virtually non-existent in world reserves. As a reminder, global financial transactions are mostly realized in dollars (about 60%), about 20% in euros and only a few percents in yuan.
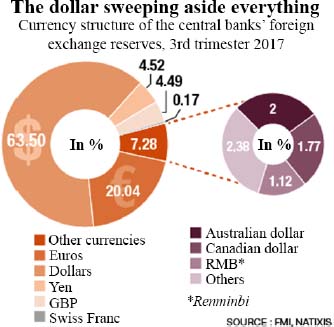
Figure 19.11. The dollar sweeping aside everything. For color versions of the figures in this book, see www.iste.co.uk/massotte/complex.zip
However, the Bundesbank and the ECB (European Central Bank) have incorporated yuan into its foreign exchange reserves. Regardless of the amount of conversion (the Chinese currency considered is only equivalent to 500 million euros of some currency holdings), this decision is as technical as political. This was also the case when the IMF decided to include the yuan in the basket of its reserve currencies in autumn 2016. China is opening up to the world: it is internationalizing its financial markets and emerging as a big influencing nation.
China is becoming a major economic partner [MOT 18b]; yuan, however, remains a monetary dwarf in the accounts of central banks. By cons, in this area, the importance of the dollar in the international markets has still increased during the last recent years. Indeed, in the business, a country with a reserve currency has to meet the following three criteria:
- – the nation, or country, must be of great economic power;
- – it must inspire confidence and have a stable economy;
- – it must provide the whole world with assets expressed in its own currency. Thus, regarding China, the reserves do not consist of possessing money stocks in dollars or euros but debts and resources enabling the purchase of Chinese bonds, by non-residents (i.e. 60% of overall Chinese GPD), which is currently achievable.
19.3.3. T-bonds versus Eurobonds and Chinese bonds, etc.
In the United States, on the other hand, the above three constraints are met; the public debt only represents $15 trillion. Moreover, the Central Bank of China with its international trade surpluses and Russia were large foreign holders of these US borrowings/debts ($1200 billion and $800 billion). They were considered as risk-free financial investments which were easily negotiable on the market.
As a result, the risk is that such large creditors such as China (which can support countries whose economy is heavily in debt, such as the United States) are in a position of strength for political-economic negotiations: they may either have a diplomatic influence or play a role in the US interest rates, and hence whipping up the global economic situation of the world.
19.3.4. Application and comments
- 1) With $3.8 trillion in foreign exchange reserves, the People’s Bank of China is by far the richest of the central banks.
- 2) This number can be compared to $1.3 trillion for its next contributor, the Bank of Japan.
- 3) Regarding Europe, on the other hand, the euro has never been able to destabilize the dollar in this role of investment and reserve currency, because Europe comprises 17 different and fragmented markets involved in the European borrowings, each one with its own characteristics and with no shared debts. In addition, the sovereign debt crisis at the beginning of the last decade has created mistrust and reduced the role of the euro as an international currency. Its weight in world reserves, which peaked at 26% a few years ago, dropped to 19% in 2014.
Faced with the above view, the monetary and economic risk does not come from euro or yen, but from yuan! Indeed and additionally, China has been the world’s largest exporter since 2009, and if China’s GDP rises above that of the United States (around 2025, according to some economic experts), the dollar can lose control of financial flows and also control over the economy.
The current monetary risk therefore lies in the fact that the yuan is becoming the great world currency of commerce, thus paving a way for Beijing to shape part of the world in its image.
Faced with such a risk, there is only one currency that stands the test of time: gold. It is the only currency to survive through history: more than 5,000 years. Hence, Russia’s US Treasury assets have declined 89% to about $20 billion today [VON 18]. To defuse such monetary crisis, the possession of gold is a way to reduce the impact of a global reset following a possible disruptive event and to share again the wealth between different countries pretending for economic well-being.