15
On Managing Risk in the Financial Domain
This chapter discusses the modeling of phenomena and uncertainties related to financial events and the approaches that can be implemented. It in part develops a number of ideas originated by Knight and Pretty [KNI 98].
15.1. Taking about disasters – from risks to catastrophes in finance
When we want to describe the dynamic evolution of a system, we cannot ignore the notion of disaster. By disaster, in the theory of the same name [THO 89], we mean a discontinuity that appears in the evolution of these systems: their global evolution is presented as a succession of continuous evolutions separated by sudden and important leaps, of a qualitatively different nature.
In our economy, the pattern is the same: disasters of various origins can occur at any time and change the course of events, sometimes in unpredictable proportions. For example, human tragedies such as the Bhopal gas leak in India in 1984, or environmental damage such as the oil spill caused by the Exxon Valdez shipwreck, with its 50 million liters of crude oil spilled in Prince William Sound, Alaska, in 1989, will be considered. In the agri-food sector, certain crises can have a profound and lasting impact on a company: as mentioned in Chapter 14, following a minor cleaning problem in the 1990s, traces of benzene were detected in Perrier brand bottles of sparkling water, and millions of bottles were recalled, with the irreversible consequences that we know! The crisis of new technologies and the Internet in 2002 manifested itself in the same way.
Sometimes these disasters affecting one or more companies are amplified by the media and are more a collective fear than reality: more recently, the US housing loan crisis of July–August 2007 involved several banks but a mini depression affected the entire financial market, which led to a sharp drop in stock market indices. The important thing is to note that in the stock market, the consequences of a disaster, in the sense we have just described it, are not long in coming and are followed by an excessive reaction.
However, it is the same phenomenon that we observe in the industry, at the planning level: all management systems are based on the same mechanisms, integrated into standard software, and distributed by a few major operators. In addition, these software programs often operate in a network and, by amplifying them, reflect typical human behavior: in the event of an increase in the number of orders, some planners believe it is appropriate to anticipate a change in the situation and will amplify a movement of increasing demand. In the event of a decrease in demand, the opposite phenomenon will be observed and an attempt will be made to anticipate a necessary reduction in buffer stocks. This results in blows that destabilize the production system.
In the analytical environment that permeates so much, theory requires us to try to understand, in a rational way, the reactions of financial markets to disasters. Therefore, companies must measure their risk management strategies in terms of shareholder value. To do this, they have the tendency to skip steps and rely on impact techniques related to a well-identified disaster, without knowing what generated the cause and frequency.
15.2. An interesting approach: financial analysis of losses
Traditional financial analysis of losses is generally limited to financial statements and analysis of the accounting impact of losses. Thus, analysts assess the impact of a claim on a company’s income statement or on the value of lost assets or on its cost in terms of annual profitability.
From the mid-1980s onwards, members of IBM’s Academy Of Technology were invited to the United States for a discussion with the CEO Lou Gerstner and made a surprising discovery. They were introduced to modern financial theories based on the principle that the company’s first customer is the shareholder and the objective that a company should maximize its value and dividends for shareholders. This meant shifting from a long-term strategy, based on assumptions of continued growth or decline, to short-term strategic adaptations, with a stronger focus on catastrophes and transient phenomena. On the contrary, the long-term ability to develop and generate cash flow was ignored.
This raises the question of the extent to which disasters directly or indirectly affect the creation of value for companies. The example given in Chapter 3 on the alleged error made by the Google employee takes on its full value. A disaster affecting a company always represents important information for all those who have dealings with that company.
This information, despite its imbalances, will allow a person to potentially react to these disruptions, to question himself or herself and to work from a new basis. The subsequent recovery plan will allow the cash flow to be restored, adequate investments to be considered, the necessary reorganizations to be implemented and future risks to be reduced. The ability of leaders to manage the consequences of disasters remains, and increasingly, is a key element. Of course, the market as a whole will itself make its own collective opinion about the impact of this disaster and action plans on the value of the company’s assets for its shareholders.
15.3. When the drama occurs
Who can know in advance when a disaster will occur? However, when it occurs, the market reviews its cash flow production expectations very quickly and no less efficiently, as shown by a study conducted on some 15 specific cases. Each catastrophe weighs heavily on the stock market price of the companies concerned. After such a violent reaction, which can lead to a decline of approximately 8%–10%, it takes an average of just over 50 trading sessions for the stocks to return to their initial price level once the crisis is over. It could therefore be assumed that the net impact of these disasters on the company’s share price is negligible; however, the ability to recover shareholder value loss over the longterm varies considerably from one company to another.
In the stock price analyses carried out by B. Mandelbrot [MAN 97], there are always discontinuous leaps and high amplitude fluctuations during the phases of overall price growth and decline. They show that the structure of price changes is fractal. This is an important point that we will discuss later in this chapter, as it allows us to link microscopic phenomena to macroscopic phenomena. This is what we are, in reality, unable to do.
Similarly, after a disaster has occurred, transaction volumes are more than four times higher than normal. On average, it takes about a month for transactions to return to a normal pace. Therefore, and not surprisingly, the initial drop in prices coincides with a period of abnormally high activity on the securities. On the contrary, the rise in prices occurs during a period of traditional trading volume.
More specifically, statistical studies have shown that the stock price of companies affected by disasters falls on average, initially by 5% if it is going to survive and by 11% if it is not. On average, surviving companies record a cumulative gain of at least 5% over 50 trading sessions. The disaster therefore has a net positive impact on their stock market performance! After six months, the market gradually seems to be more interested in the human and financial cost of the disaster, and its judgment is based more on whether or not the company’s liability has been established. Investors’ perception of executive responsibility determines their expectations of the company’s future cash flow generation. Thus, the impact of disasters can be broken down into two phases:
- – first, the immediate estimation of the economic loss. Because, even though it is not possible to predict with certainty what the impact of the disaster will be on cash flow, the market forges its collective opinion and adjusts the price according to this opinion. These direct factors generally have the effect of weighing on share prices, the decline in which can be tempered by the amount of compensation paid by insurers, thus limiting the loss of cash flow;
- – second, the impact of the disaster is determined by the responsiveness of the company’s management. Even though all disasters have an initial negative impact on the share price of the company concerned, they can paradoxically offer managers the opportunity to demonstrate their ability to manage difficult situations. The market, forced by surprise to review its assessment of the company’s management, generally tends to review its position regarding the future production of cash flow in terms of amount, as well as visibility.
Perrier appeared to have failed at times in its global communication and coordination strategy in response to the so-called benzene contamination crisis. Despite initial claims that the contamination was limited to the US market, the company was forced to recall and destroy as many as 160 million bottles of sparkling mineral water that had been shipped to 120 countries. The market sanction was irrevocable: shares lost 40% of value and the company joined the Nestlé Group. In any case, an immediate, honest and exhaustive communication strategy contributes to a bounce in the stock market price.
15.4. How to conduct a risk consequence analysis process?
In this section, we propose a risk impact analysis process, applicable whenever a problem such as those described above is encountered. We can say that everything starts and ends with organization; between the two, there is disruption and risk assessment. Our approach consists of the following 10 steps (Box 15.1):
Did you know that the above approach is based on the results and theory of the French mathematician Louis Bachelier who defended a thesis on March 29, 1900 entitled “La Théorie de la Spéculation?” (“Speculation theory?”). This is a thesis that focused on the study of variations and trends in factors and stock prices in France. The study assumes a high regularity of events, and since it is stipulated that distributions are supposed to follow Gauss’s Law, there is therefore no memory effect and large variations are rare.
Benoît Mandelbrot studied the evolution of the Dow Jones Index on the New York Stock Exchange between 1916 and 2003, a period when the stock market experienced 1001 trading days with variations of more than 3.4%. This is despite the fact that the theory based on conventional statistics only predicts 58! On a more serious note: variations of more than 7% over the same period of time are among the many, including the stock market crashes of 1929 and 1987, not to mention the mini crashes of 2002 and 2007. Another problem is how to integrate certain precursors: a team of physicists from the University of Tokyo showed that on the American Standard & Poors 500 index, in the two months preceding Black Monday in 1987, large fluctuations were as frequent as small fluctuations. It is clear that such results challenge the foundations and assumptions used in so-called “rational” approaches. Conventional statistics are not the right ones!
For these reasons, Mandelbrot had already put forward the idea of using P.L. (Pareto–Lévy) laws and the notions of multifractals in finance. As already written, the purpose is not to explain an event or behavior, but to describe it, to dissect it and to extract the significant detail contained overall, in terms of meaning and/or appearance. The goal here is to first focus on the facts and not on the causes of the disruption.
It is therefore important and urgent that more experimental approaches be used to analyze “disasters” and the detection of disruptions. For example, when we are interested in detecting an earthquake, we focus on weak signs such as those just described. The most important thing is to know how to distinguish irregularities and “subtle details” among warning signs that we will call an envelope or global shape. Only then should decisions be made based on Black-Scholes-type tools, although they have proven their robustness in stationary situations (when the economy is calm) but which in difficult cases can only make a situation worse by making bad decisions.
To avoid thinking wrongly with real models, it is important to vary approaches on two levels:
- – combine contradictory studies with complementary analytical tools to better detect and anticipate disruption phenomena;
- – in the event that uncertainty cannot be felt, protect against unwanted side effects and adverse consequences by diversifying activities or resources.
In IBM Europe’s factories and development laboratories, we were confronted with such situations: we had to react as well as possible to unpredictable changes from our clients. This created many significant disruptions. One solution was to increase the frequency of planning operations, which made no sense since the new production program was already obsolete as soon as it was implemented.
In reality, the technologies at our disposal only made it possible to analyze rational phenomena. However, by nature, our world is fractal, discontinuous, as well as regular, evolving in a chaotic way, between order and disorder. Hence, we set up an international competence center whose objective was to define approaches that were different from the more conventional ones. Thus, and by way of example, we were able to develop dynamic models that predicted chaotic evolutions, inventories, simulate chaotic demands and/or behaviors to study their effects and define appropriate action plans.
In this book, one type of phenomenon has been somewhat described: the appearance of failures in large electronic assemblies. Processes based on Lévy’s jump process have been used, which can incorporate fairly frequent discontinuities into time series and thus better describe phenomena subject to such fluctuations.
15.5. Conservatory measures: risk and diversification
One way to combat the risks inherent in markets or natural disasters is to spread them out, i.e. diversify or relocate some of the existing activities. However, in the name of value creation, industrial empires built in the 1980s on the principle of diversification of activities were divided a decade later. What does the theory say here?
Researchers who have addressed the theme of diversification over the past 50 years have argued that it has the following four advantages:
- – reduction in the variance of the investors’ portfolio;
- – improvement of the company’s debt capacity;
- – reduction of employment risk;
- – better operational efficiency.
These results have a significant impact on companies’ restructuring efforts. Investors can easily acquire shares in different sectors of activity and thus diversify their portfolio between different types of activity with greater ease and lower costs than managers, who bear more transaction costs. In this context, investment in a conglomerate is comparable to investment in a mutual fund in which shareholders pay managers to perform two essential functions: administration and coordination. However, it is unlikely that this mechanism will represent a good use of shareholders’ money.
Indeed, conglomerates pose a practical analytical problem for investors. Analysts tend to specialize in certain areas of activity and, when the company diversifies into multiple sectors, it becomes more difficult to really assess what it is worth. In addition, they tend to estimate each sector according to different criteria, such as cash flow for restaurants or revenue for everyday consumer goods. On the contrary, specialization allows them to better understand the dynamics of a company. This improves the company’s reporting and visibility, and reduces uncertainty.
When, in the past, a conglomerate created value for its shareholders, it was because it was built around a charismatic or highly talented personality, on whom employees and investors alike relied to bring together the disparate elements of the company into a coherent whole. Take the example of the American conglomerate General Electric and the managerial and charismatic talent that its CEO Jack Welch put at its service. However, examples, where the construction of such empires has been a source of value creation for shareholders, are more the exception than the rule.
Of course, any decision to diversify or concentrate depends on the terms of the contract, the premium paid, the cost of the division and the terms of the share exchange. But what we wanted to demonstrate in our presentation is that investors prefer concentration to conglomeration and international distribution to national presence.
15.6. An additional risk: the decline and inversion rate at the stock exchange
Everybody is aware about the recent and continuous slowing down ratio relative to the Dow/gold rate. It is also called the greed/fear ratio and denotes a decline in industry. It is related to performance of large US enterprises, as well as the global industry level of the USA. When the economy is healthy and growing, people buy stocks: the index is generally on the rise. When it is fearful and corrects its mistakes, they buy gold and the index goes down. Any decline in this ratio causes a reversal of the yield curve of the shares, which themselves suggest the stockholders for sale, thus anticipating a possible recession. At the beginning of August 2019, it took 17 ounces of gold to buy Dow shares compared to 40 ounces in 1999 and 22 ounces in 2018. Hence, we have to be very cautious with the inversion of this ratio.
There exists a strong correlation between a recession and the inversion of the yield curve. When the economic environment remains quite “stable”, the yield of bond obligations is generally growing over time because investors ask for a kind of “danger money” due to a possible future risk. And on a long-term horizon (e.g. 10 years), it is difficult to predict what the level of inflation will be. In contrast, when the yield curve happens to be inverted, it is because the uncertainty on a short-time horizon is worse. History shows that, 30 years ago, an inverted yield curve led to an economic and financial crisis.
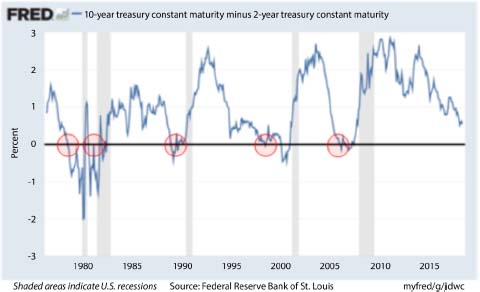
Figure 15.1. Inversion of yield curve over time. The graph shows the potential for recession and crisis. Source: Federal Reserve Bank of St. Louis, 2019. For color versions of the figures in this book, see www.iste.co.uk/massotte/complex.zip
15.7. Concluding with additional risks of the shared economy
A singularity has emerged due to the obvious massive importance of GAFA firms, which harbor leadership, enthusiasm and fragility. These characteristics lead to an odd lack of control and loss of autonomy.
This situation is the polar opposite of 19th and 20th Century great industry leaders who ensured their seal on their achievements, while present GAFA leaders tend to show unprecedented humility and low profile.
They declare themselves attentive to the needs of their users, even soliciting them, in order to collect their tastes and BDIs (Beliefs, Desires and Intentions). This trend calls for technologies directly intended for data mining (i.e. data sciences). Companies keep track of everybody’s personal BDIs and translate them in the form of understanding and BDI aspirations. At the same time, large digital companies become exposed to the moods of public opinion, which cannot be controlled and no longer anticipated.
As suggested by French philosopher Luc Ferry in La révolution transhumaniste (The Transhumanist Revolution) [FER 16], a phenomenon affecting any domain, the collaborative economy breeds fierce rivalry and competition as we have never seen before.