
Chapter 1
Today's Data Analyst
Analytics is at the heart of modern business. Virtually every organization collects large quantities of data about its customers, products, employees, and service offerings. Managers naturally seek to analyze that data and harness the information it contains to improve the efficiency, effectiveness, and profitability of their work.
Data analysts are the professionals who possess the skills and knowledge required to perform this vital work. They understand how the organization can acquire, clean, and transform data to meet the organization's needs. They are able to take that collected information and analyze it using the techniques of statistics and machine learning. They may then create powerful visualizations that display this data to business leaders, managers, and other stakeholders.
Welcome to the World of Analytics
We are fortunate to live in the Golden Age of Analytics. Businesses around the world recognize the vital nature of data to their work and are investing heavily in analytics programs designed to give them a competitive advantage. Organizations have been collecting this data for years, and many of the statistical tools and techniques used in analytics work date back decades. But if that's the case, why are we just now in the early years of this Golden Age? Figure 1.1 shows the three major pillars that have come together at this moment to allow analytics programs to thrive: data, storage, and computing power.
Data
The amount of data the modern world generates on a daily basis is staggering. From the organized tables of spreadsheets to the storage of photos, video, and audio recordings, modern businesses create an almost overwhelming avalanche of data that is ripe for use in analytics programs.
Let's try to quantify the amount of data that exists in the world. We'll begin with an estimate made by Google's then-CEO Eric Schmidt in 2010. At a technology conference, Schmidt estimated that the sum total of all of the stored knowledge created by the world at that point in time was approximately 5 exabytes. To give that a little perspective, the file containing the text of this chapter is around 100 kilobytes. So, Schmidt's estimate is that the world in 2010 had total knowledge that is about the size of 50,000,000,000,000 (that's 50 trillion!) copies of this book chapter. That's a staggering number, but it's only the beginning of our journey.

FIGURE 1.1 Analytics is made possible by modern data, storage, and computing capabilities.
Now fast-forward just two years to 2012. In that year, researchers estimated that the total amount of stored data in the world had grown to 1,000 exabytes (or one zettabyte). Remember, Schmidt's estimate of 5 exabytes was made only two years earlier. In just two years, the total amount of stored data in the world grew by a factor of 200! But we're still not finished!
In the year 2020, IDC estimates that the world created 59 zettabytes (or 59,000 exabytes) of new information. Compare that to Schmidt's estimate of the world having a total of 5 exabytes of stored information in 2010. If you do the math, you'll discover that this means that on any given day in the modern era, the world generates an amount of brand-new data that is approximately 32 times the sum total of all information created from the dawn of civilization until 2010! Now, that is a staggering amount of data!
From an analytics perspective, this trove of data is a gold mine of untapped potential.
Storage
The second key trend driving the growth of analytics programs is the increased availability of storage at rapidly decreasing costs. Table 1.1 shows the cost of storing a gigabyte of data in different years using magnetic hard drives.
TABLE 1.1 Gigabyte storage costs over time
| Year | Cost per GB |
|---|---|
| 1985 | $169,900 |
| 1990 | $53,940 |
| 1995 | $799 |
| 2000 | $17.50 |
| 2005 | $0.62 |
| 2010 | $0.19 |
| 2015 | $0.03 |
| 2020 | $0.01 |
Figure 1.2 shows the same data plotted as a line graph on a logarithmic scale. This visualization clearly demonstrates the fact that storage costs have plummeted to the point where storage is almost free and businesses can afford to retain data for analysis in ways that they never have before.
Computing Power
In 1975, Gordon Moore, one of the co-founders of Intel Corporation, made a prediction that computing technology would continue to advance so quickly that manufacturers would be able to double the number of components placed on an integrated circuit every two years. Remarkably, that prediction has stood the test of time and remains accurate today.
Commonly referred to as Moore's Law, this prediction is often loosely interpreted to mean that we will double the amount of computing power on a single device every two years. That trend has benefited many different technology-enabled fields, among them the world of analytics.
In the early days of analytics, computing power was costly and difficult to come by. Organizations with advanced analytics needs purchased massive supercomputers to analyze their data, but those supercomputers were scarce resources. Analysts fortunate enough to work in an organization that possessed a supercomputer had to justify their requests for small slices of time when they could use the powerful machines.
Today, the effects of Moore's Law have democratized computing. Most employees in an organization now have enough computing power sitting on their desks to perform a wide variety of analytic tasks. If they require more powerful computing resources, cloud services allow them to rent massive banks of computers at very low cost. Even better, those resources are charged at hourly rates, and analysts pay only for the computing time that they actually use.

FIGURE 1.2 Storage costs have decreased over time.
These three trends—the massive volume of data generated by our businesses on a daily basis, the availability of inexpensive storage to retain that data, and the cloud's promise of virtually infinite computing power—come together to create fertile ground for data analytics.
Careers in Analytics
As businesses try to keep up with these trends, hiring managers find themselves struggling to identify, recruit, and retain talented analytics professionals. This presents a supply-and-demand situation that is problematic for businesses but excellent news for job candidates seeking to break into the field.
In their 2020 Global State of Enterprise Analytics survey, the firm MicroStrategy found that 94 percent of firms believe that analytics is crucial to the growth of their businesses and that 65 percent of firms planned to increase their analytics investment in the coming year. This will inevitably lead to increased demand for hiring analytics professionals, a fact that was confirmed by the World Economic Forum in their 2020 Future of Jobs Report. That study listed 10 occupations with the highest demand for professionals. The results, shown in Table 1.2, found that data analysts and scientists are the most in-demand of any career field, closely followed by several other analytics-related fields.
TABLE 1.2 Highest-demand occupations
| Rank | Occupation |
|---|---|
| 1 | Data analysts and scientists |
| 2 | AI and machine learning (ML) specialists |
| 3 | Big Data specialists |
| 4 | Digital marketing and strategy specialists |
| 5 | Process automation specialists |
| 6 | Business development professionals |
| 7 | Digital transformation specialists |
| 8 | Information security analyst |
| 9 | Software and applications developers |
| 10 | Internet of Things (IoT) specialists |
The future is bright. There's no reason to anticipate a reduction in this demand any time soon. It's the right time to enter the exciting field of data analytics!
The Analytics Process
Analysts working with data move through a series of different steps as they seek to gain business value from their organization's data. Figure 1.3 illustrates the process they move through as they acquire new data, clean and manipulate that data, analyze it, create visualizations, and then report and communicate their results to business leaders.

FIGURE 1.3 The analytics process
Data Acquisition
Analysts work with a wide variety of data, using data sources generated by the business itself or obtained from external sources. For example, data analysts might look at their own organization's sales data (an internal source) and augment it with census data (an external source) as they try to identify new potential markets for their firm's products and services.
In Chapter 2, “Understanding Data,” you'll learn about the different data types, data structures, and file formats that analysts might encounter as they carry out data acquisition tasks. In Chapter 3, “Databases and Data Acquisition,” you'll learn about the techniques used to collect this data and integrate it with existing systems as well as the use of relational databases to store, maintain, and query those datasets.
Cleaning and Manipulation
In an ideal world, we'd acquire data from internal and external sources and then simply pull it directly into our analysis. Unfortunately, the world of data is far from ideal, and you'll quickly discover (if you haven't already!) that datasets often contain errors, are missing crucial values, or come in a format that simply makes analysis difficult. Analysts spend a large portion of their time cleaning and manipulating data to get it ready for transformation. In fact, many analytics professionals estimate that cleaning and manipulation work consumes 80 percent of the time spent on most analytics projects!
In Chapter 4, “Data Quality,” you'll learn more about the cleaning and manipulation work performed by data analysts. You'll discover the common reasons for cleansing and profiling datasets and different data manipulation methods. You'll also learn about the importance of data quality control and techniques you can use to improve the quality of your data.
Analysis
Once you have clean datasets in hand, you're ready to begin analyzing your data. This work typically begins with a process known as exploratory data analysis (EDA), which uses simple statistical techniques to summarize a dataset and draw high-level conclusions. EDA creates hypotheses that analysts may further explore using the techniques of machine learning and artificial intelligence.
In Chapter 5, “Data Analysis and Statistics,” you'll learn about the tools and techniques of data analysis. You'll learn how to use descriptive statistics to perform EDA and how to use inferential statistics to test hypotheses. You'll also learn about the processes used to continue analyses, including clarifying business questions, identifying data sources, and applying analytic techniques.
Visualization
The old adage “a picture is worth a thousand words” is as true in the world of analytics as it is in other aspects of life. The human mind excels at processing visual information and isn't so good at handling large quantities of numeric data.
You've already seen this at play once in this chapter. Table 1.1 presented a set of datapoints on the cost of storage. Looking at that table, you could tell that the cost of storage decreased over time, but you probably had to do a little thinking to reach that conclusion. A quick look at the same data visualized in Figure 1.2 likely led you to the same conclusion without all the mental gymnastics.
The storage dataset was fairly simple, however. Figure 1.4 shows you an excerpt from a 51-row dataset containing the average college tuition in each state. Can you quickly get a sense of the trend from state to state by looking at that data? It's probably not so easy for you.
Figure 1.5 presents the same data in a map-based visualization. Darker shades represent higher tuition costs. We'll bet that you can draw conclusions from this visualization much more quickly than you can from the raw data!
In Chapter 7, “Data Visualization with Reports and Dashboards,” you'll learn about different types of data visualizations, including line charts, histograms, infographics, and more. You'll discover how to select a visualization method appropriate for your needs and use it to tell the story of your data.
Reporting and Communication
Although visualizations are very useful, they often can't stand alone. In most cases, you'll need to provide business leaders with multiple visualizations as well as supporting text to help communicate the story of your data. That's where reports and dashboards enter the picture. Reports provide the reader with textual analysis and supporting data in tabular and/or visualization form. They're an extremely common work product in the field of data analytics.

FIGURE 1.4 Table of college tuition data

FIGURE 1.5 Visualization of college tuition data
Reports, however, only present a point-in-time analysis. Business leaders often want to monitor business activities in real time using visualizations. Dashboards provide this real-time look at an organization's data using continuously updated visualizations.
Chapter 7 covers reporting and communication in more detail. You'll see examples of different types of reports and dashboards. You'll discover how to translate business requirements into appropriate reporting tools and how to design effective reports and dashboards.
Analytics Techniques
Analysts use a variety of techniques to draw conclusions from the data at their disposal. To help you understand the purpose of different types of analysis, we often group these techniques into categories based on the purpose of the analysis and/or the nature of the tool. Let's take a look at the major categories of analytics techniques.
Descriptive Analytics
Descriptive analytics uses statistics to describe your data. For example, if you perform descriptive analytics on your customer records, you might ask questions like, what proportion of your customers are female? And how many of them are repeat customers?
You can perform descriptive analytics using very basic analysis tools, including simple descriptive statistics and analytic tools. You'll learn more about the use of statistics in descriptive analytics in Chapter 5.
Predictive Analytics
Predictive analytics seek to use your existing data to predict future events. For example, if you have a dataset on how your customers respond to direct mail, you might use that dataset to build a model that predicts how individual customers will respond to a specific future mailing. That might help you tweak that mailing to improve the response rate by changing the day you send it, altering the content of the message, or even making seemingly minor changes like altering the font size or paper color.
Predictive analytics programs rely on the use of advanced statistical tools and specialized artificial intelligence, machine learning, and deep learning techniques.
Prescriptive Analytics
Prescriptive analytics seek to optimize behavior by simulating many scenarios. For example, if you want to determine the best way to allocate your marketing dollars, you might run different simulations of consumer response and then use algorithms to prescribe your behavior in that context. Similarly, you might use prescriptive analytics to optimize the performance of an automated manufacturing process.
Machine Learning, Artificial Intelligence, and Deep Learning
The work of analytics is intellectually and computationally demanding. Fortunately, you don't always have to do this work yourself; you can rely on automated techniques to help you unlock the hidden value in your data.
Machine learning uses algorithms to discover knowledge in your datasets that you can then apply to help you make informed decisions about the future. That's true regardless of the specific subject matter expertise where you're working, as machine learning has applications across a wide variety of fields. For example, here are some cases where machine learning commonly adds value:
- Segmenting customers and determining the marketing messages that will appeal to different customer groups
- Discovering anomalies in system and application logs that may be indicative of a cybersecurity incident
- Forecasting product sales based on market and environmental conditions
- Recommending the next movie that a customer might wish to watch based on their past activity and the preferences of similar customers
- Setting prices for hotel rooms far in advance based on forecasted demand
Of course, those are just a few examples. Machine learning can bring value to almost every field where discovering previously unknown knowledge is useful—and we challenge you to think of a field where knowledge doesn't offer an advantage!
As we move through the world, we hear the terms artificial intelligence, machine learning, and deep learning being used almost interchangeably to describe any sort of technique where computers are working with data. Now that you're entering the world of data, it's important to have a more precise understanding of these terms.
Artificial intelligence (AI) includes any type of technique where you are attempting to get a computer system to imitate human behavior. As the name implies, you are trying to ask computer systems to artificially behave as if they were intelligent. Now, of course, it's not possible for a modern computer to function at the level of complex reasoning found in the human mind, but you can try to mimic some small portions of human behavior and judgment.
Machine learning (ML) is a subset of AI techniques. ML techniques attempt to apply statistics to data problems in an effort to discover new knowledge. Or, in other terms, ML techniques are AI techniques designed to learn.
Deep learning is a further subdivision of machine learning that uses quite complex techniques, known as neural networks, to discover knowledge in a particular way. It is a highly specialized subfield of machine learning that is most commonly used for image, video, and sound analysis.
Figure 1.6 shows the relationships between these fields.

FIGURE 1.6 The relationship between artificial intelligence, machine learning, and deep learning
Data Governance
In the beginning of this chapter, we discussed the three major forces that have come together to create the Golden Age of Analytics: data, storage, and computing. In Figure 1.1, we illustrated how those three forces support modern analytics programs. However, there is one element of that figure that we haven't yet discussed. Notice that there is a slab of stone that supports the three pillars of analytics. This slab represents the important role of data governance in analytics programs. Without strong governance, analytics programs can't function effectively.
Data governance programs ensure that the organization has high-quality data and is able to effectively control that data. In Chapter 8, “Data Governance,” you'll learn the major concepts of data governance and how organizations use master data management (MDM) programs to maintain and improve the quality of their data.
Analytics Tools
Software helps analysts work through each one of the phases of the analytics process. These tools automate much of the heavy lifting of data analysis, improving the analyst's ability to acquire, clean, manipulate, visualize, and analyze data. They also provide invaluable assistance in reporting and communicating results.
Some of these tools are well known to most computer users. For example, people are generally familiar with spreadsheet tools such as Microsoft Excel or Google Sheets. Figure 1.7 shows an example of the college dataset used to create Figures 1.4 and 1.5 loaded in Excel.
Other analytics tools require more advanced skills. For example, the R programming language is designed to provide analysts with direct access to their data, but it requires learning some basic coding skills. Figure 1.8 shows the RStudio integrated development environment with the code used to create Figure 1.5 loaded.
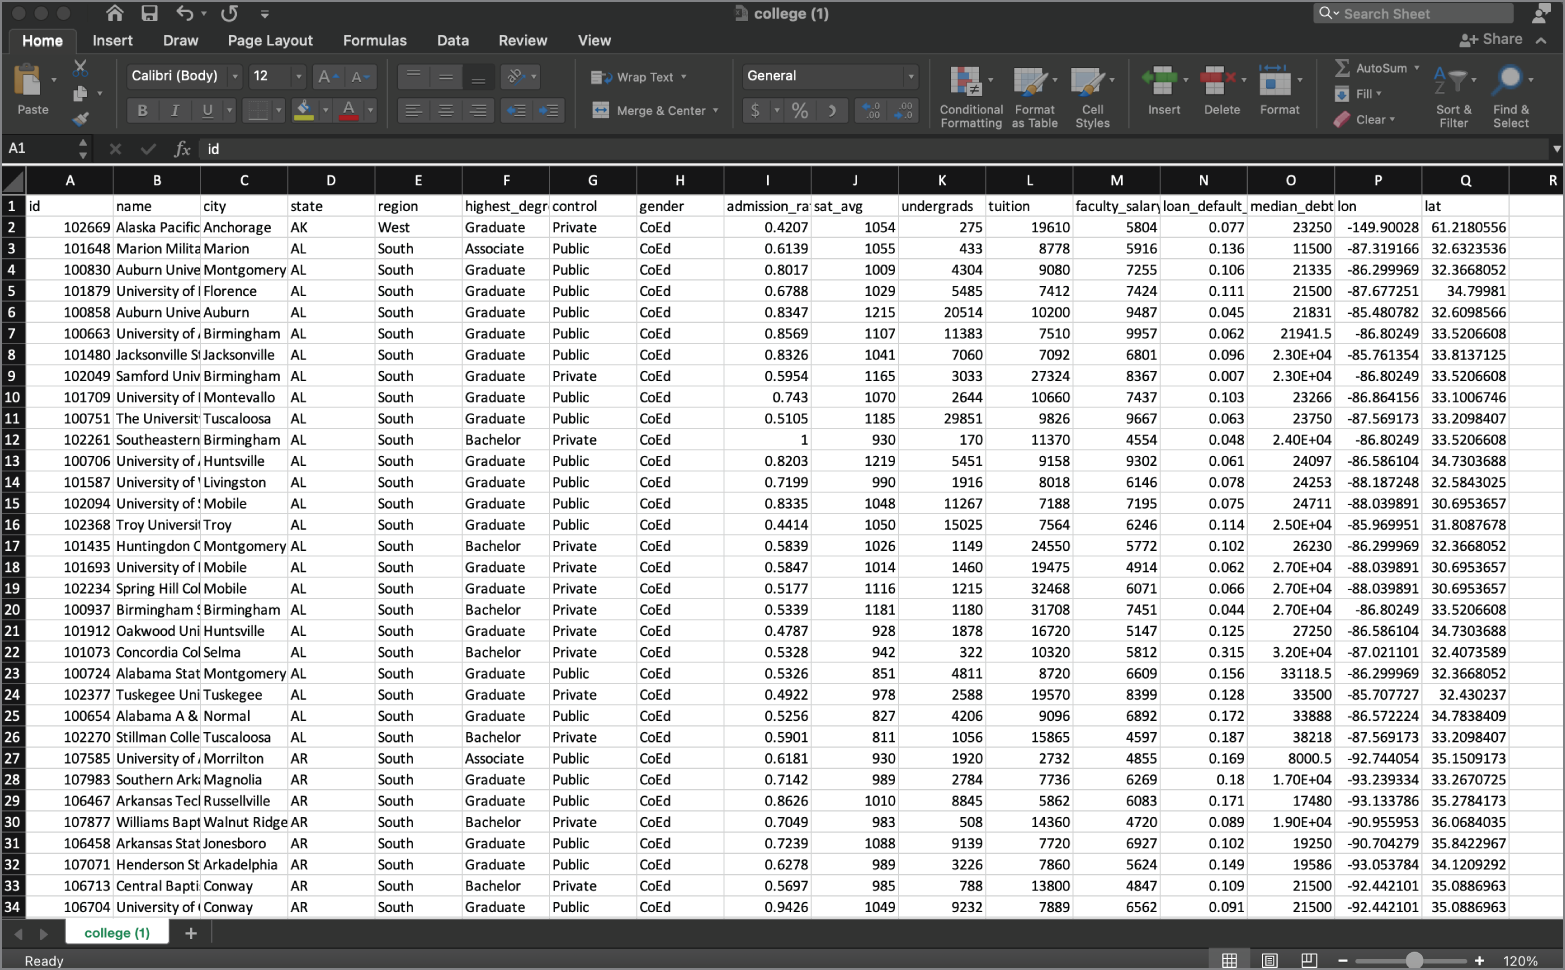
FIGURE 1.7 Data analysis in Microsoft Excel

FIGURE 1.8 Data analysis in RStudio
You'll likely work with several different tools in your work as a data analyst. Your choice of tools will depend on the work at hand, the standards used by your organization, and the software licenses available to you. We'll discuss many common analytics tools in Chapter 6, “Data Analytics Tools.”
Summary
Analytics programs allow businesses to access the untapped value locked within their data. Today, many organizations recognize the potential value of this work but are still in the early stages of developing their analytics programs. These programs, driven by the unprecedented availability of data, the rapidly decreasing cost of storage, and the maturation of cloud computing, promise to create significant opportunities for businesses and, in turn, for data professionals skilled in the tools and techniques of analytics.
As analysts develop analytic work products, they generally move through a series of stages. Their work begins with the acquisition of data from internal and external sources and continues with the cleaning and manipulation of that data. Once data is in a suitable form, data professionals apply analytic techniques to draw conclusions from their data, create visualizations to depict the story of their data, and develop reports and dashboards to effectively communicate the results of their work to business leaders.