
Chapter 1
The Economic Machine
Bridgewater Associates, the largest and most successful hedge fund manager in the world, pioneered most of the concepts that I will present in this book more than 20 years ago. Bridgewater is at the forefront of economic and investment research and has been refining and testing its concepts over the past two decades. The company has a great understanding of what drives economic shifts and how those shifts affect asset class returns. The first chapter is effectively my summary of its unique template for understanding how the economic machine functions. Bridgewater has released a short animated video that explains their template and related research at www.economicprinciples.org, and I encourage you to visit the site. The core principles presented throughout the rest of the book were also developed by this remarkable organization over the past couple of decades. I know of no one in the industry that has a better command of this subject.
In order to fully recognize today's unique economic climate, you first need to better comprehend how the economic machine generally functions. The goal of this first chapter is to arm you with a command of the basic inner workings of this machine to enable a deeper appreciation of why this topic of building a balanced portfolio is so timely. Insight into the economic machine will also lay the required foundation for an improved understanding of the key drivers of asset class returns. I will refer back to this opening chapter throughout the book because it introduces core, fundamental concepts that impact markets, and therefore portfolio returns.
How the Economy Functions
Constructing the appropriate asset allocation is always a challenge, but it is particularly difficult in the current economic environment. The reason is simple: The United States and many other developed world economies are fighting through a deleveraging process that is likely to last for a decade or longer. Deleveraging is a fancy term for debt reduction or lowering leverage. When the amount of debt in any economy gets too high relative to the ability to pay it back, then the debt burden must be reduced. But what does this really mean and why is it so important? To effectively answer this central question, I will start at the most basic level.
The economy functions like a machine. Money flows through the machine from buyers to sellers. Buyers exchange their money for goods, services, and financial assets. This is what money is used for, and it is only worth something because you can exchange it for goods, services, and financial assets. Sellers sell these items because they want money. Buyers buy these things to fill a need. Goods and services help support their lifestyles while financial assets are used to preserve and increase wealth over time. An economy is simply the sum of billions of transactions between buyers and sellers. An economy grows when there are a lot of such transactions and it stagnates when the flow of money slows. At a fundamental level it really is that simple.
The Short-Term Business Cycle
The ability to borrow money slightly complicates the mechanics of the machine. If borrowing were not allowed in the system, then buyers would only buy what they could afford to pay using existing money. There would be no deleveraging because leverage would not exist. The economy could be more stable, although it may operate below its potential because capital would not flow as efficiently. With borrowing, a buyer is able to spend tomorrow's income today. If I want to buy a good, service, or financial asset and do not wish to (or cannot) pay with cash, then I can simply promise to pay for it in the future. I have created credit. This is what typically happens when you buy a house, swipe your credit card at the grocery store, or promise to pay your friend back if he buys you lunch. In each case you have created credit. Your balance sheet has been leveraged, and the amount of debt you owe and your debt service have just increased. A simple way to summarize these concepts is to say spending must be financed either from money or credit (so spending = money + credit).
With leverage an economy can grow more than it would otherwise because buyers can use both money and credit to make purchases. If they don't have enough money, they can use credit to buy what they couldn't afford to pay for with current funds. Because your spending is someone else's income, when you buy more using credit, then others earn more than they would otherwise. Then their increased earnings lead to increased spending and so on. The economy grows because it is simply the sum of all the transactions. Figure 1.1 displays this general cycle.

Figure 1.1 Basic Cycle of Economic Growth
The central bank plays a key role in managing this process. The Federal Reserve (known as the Fed) is the central bank of the United States; other major economies around the globe have their own central banks. The objective of the central bank is to try to smooth out fluctuations in the economy. Fluctuations can be measured in terms of both economic growth and price stability or inflation. The Fed does not want the economy to weaken too much because reduced spending feeds into falling incomes, which begets more spending cuts. The Fed also does not want prices to rise too quickly. If there is too much money chasing too few goods, services, and financial assets, then upward pressure is exerted on prices, which can be harmful to an economy if it goes too far. In short, the Fed seeks the goldilocks economy (moderate growth and low inflation—not too hot, not too cold, just right).
How does the Fed try to maintain economic and price stability? The main policy tool the Fed uses is to control short-term interest rates. Whenever the economy is weakening or inflation is too low, the Fed can stimulate more borrowing by lowering short-term interest rates. When inflation is too high or the economy is growing faster than desired, then the Fed can raise interest rates to curtail borrowing. Recall that total spending must be financed by money or credit. The supply of money is relatively fixed most of the time. However, the supply of credit constantly changes and is largely influenced by interest rates. All else being equal, the lower the interest rate you are being charged the more money you would borrow and the higher the rate the less you would borrow. When credit is cheaper, the growth of credit typically increases and vice versa. When the Fed wants to stimulate more borrowing to support the economy or to increase inflation, it lowers rates to a level that encourages sufficient borrowing to achieve the desired outcome.
This interrelationship is why we have the familiar business cycle: The economy weakens, the Fed lowers rates, credit expands, spending picks up, and the economy improves. Eventually inflation pressures may build and the cycle reverses: The Fed raises rates, credit contracts, spending declines, the economy weakens, and inflation subsides. These cycles typically last three to seven years and are easily recognizable because of both their frequency and the relatively short time frame between inflection points. Investors have seen these cycles so many times that they have a good understanding of the pattern and how they work. Few are surprised when the cycle turns because they have firsthand experience with this dynamic. Figure 1.2 displays the normal business cycle.
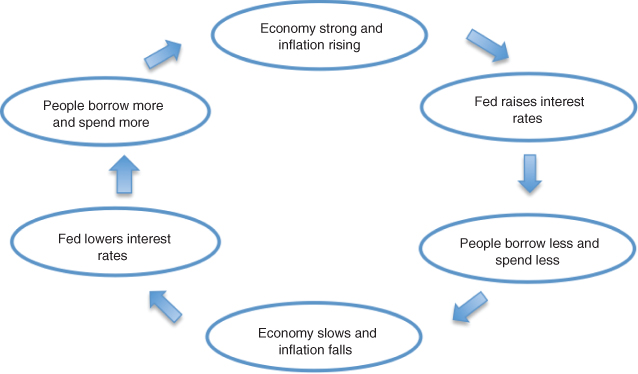
Figure 1.2 The Normal Business Cycle
Most investors, economists, and even lay people are probably familiar with the above-described parts of the economic machine. What follows next is much less understood, and in fact the concepts that will be presented have been completely missed by many economists and certainly by most investors.
The Long-Term Debt Cycle
There is another cycle that is working in the background of the economic machine just described. Most people are completely unaware of its existence because the cycle only hits its inflection point once or twice in a lifetime. By comparison, the business cycle covered earlier turns every three to seven years, on average. This longer-term cycle, often referred to as the long-term debt cycle, may last many decades before it changes direction. The only time it really matters and is worth paying attention to is near those critical inflection points. It is at those rare moments that no one can continue to ignore the powerful forces that ensue.
As covered above, the short-term business cycle exists because the Fed moves short-term interest rates in response to economic conditions. Over time, whenever the Fed lowers rates, increased borrowing adds to debt levels on balance sheets. Debt levels can continue to rise for a long period of time due to the self-reinforcing dynamic that is involved. The dynamic is self-reinforcing because the creditworthiness of a borrower is based largely on the value of his assets and income. Lenders want to make sure that they can be paid back. The higher the borrower's income and collateral, the higher are the odds of repayment. Going back to economic machine basics, when I borrow and spend, then the economy grows because that spending is someone else's income. In sum, when we borrow to spend, our collective incomes rise. Rising incomes further support debt accumulation. Additionally, the value of our assets increases through this leveraging phase of the cycle because we have a greater ability to spend on assets such as stocks and real estate. The boosted spending on assets pushes their prices higher. The cycle is virtuous in nature: More borrowing leads to increased spending, which improves incomes and asset values, which are the key factors used by lenders to assess creditworthiness of borrowers.
Therefore, the short-term business cycle (three- to seven-year boom-bust economic cycles) operates within this longer-term debt cycle (50- to 75-year leveraging-deleveraging cycles). Each time the Fed lowers rates, the amount of debt in the economy increases; when it raises rates, debt growth slows. The level of debt generally does not materially decline during this phase; the growth of the debt merely pauses temporarily. Then the economy requires additional stimulus and debt levels go up once again. This continues until the total amount of debt in the system is too high and can no longer rise. In other words, balance sheets go through a long period of leveraging as they are constantly supported by higher asset values and incomes. This cannot continue forever as the cycle ends when debt limits are reached. We collectively hit our debt ceiling when we can no longer make interest payments on our debt and our assets have become impaired. At that point, we are no longer creditworthy and have difficulty refinancing our debt and increasing our borrowing. Our aggregate balance sheet is too highly levered relative to our assets and income and must be repaired over time. The typical dynamic is illustrated in Figure 1.3.

Figure 1.3 The Virtuous Cycle of Debt Growth
The Deleveraging Process
The virtuous cycle continues until the system collapses under its own weight. Bad loans are made to bad borrowers; defaults pick up and the cycle finally turns. The Fed, in its normal response to weakening growth, predictably lowers interest rates to stimulate more borrowing. This time it does not work. More borrowing is not possible simply because the borrowers are no longer creditworthy and the lenders, after recently being burned with massive defaults, have stopped lending. Rates fall to zero and the business cycle unexpectedly does not revert this time. The market is stunned and the economic machine literally stalls. Since total spending must come from money plus credit, and credit growth has reversed, total spending falls precipitously. This surprise creates fear, and those with money significantly cut their spending, which further exacerbates the problem. The cycle reverses after decades of going in one direction and the deleveraging process begins. It's akin to a speeding car on a crowded freeway suddenly shifting into reverse. Horrific accidents are inevitable. This is exactly what happened to the U.S. economic machine in 2008, and it is the exact same experience that captured the nation in 1929 at the onset of the Great Depression. These periods are normal responses, but they just don't repeat frequently enough for people to fully recognize and understand them.
The deleveraging process is just that: a process. It is inescapable and will repeat over and over again. The process is a largely unavoidable part of the economic machine because it is fundamental to how the machine is built. A credit-based economic system like ours is dependent on increased borrowing to finance spending, and there is great incentive to keep the cycle going as long as possible. It works well for a long time until the debt cycle reverses. When the cycle changes course, the process is self-reinforcing, just as it was during the upswing. In contrast, the normal business cycle is self-correcting. When the economy is too strong, tight policy causes it to slow, and when it is too weak, loose policy promotes an improvement. The long-term debt cycle feeds off of itself, however. I have already covered how this is the case on the way up. The opposite set of conditions drives the self-reinforcing process on the way down. I can't borrow any more so I spend less than I spent before. My reduced spending brings down your income so you spend less and that in turn negatively impacts someone else's income. The reduced overall spending and selling of assets to pay down debt also drives down asset prices, which hurts the value of borrowers' collateral, further degrading their ability to borrow. I spend less because I am earning less but also because I recognize that I have too much debt and want to take some of my income and pay down debt to gradually repair my balance sheet. This self-feeding dynamic causes a severe economic contraction in the beginning stages of the deleveraging process. The weak economic climate exacerbates conditions and confidence and can quickly lead to an economic depression. This is why a depression is not simply another variant of the normal business cycle recession. It is caused by a reversal of the debt cycle, not by the Fed tightening interest rates too much, which is precisely what causes normal recessions. Most people fail to appreciate this critical distinction because of a general misunderstanding of the mechanics of the economic machine and a lack of appreciation of the difference between the short-term business cycle and the long-term debt cycle.
How does all this relate to where we are in the cycle currently? The simplest way to measure the total debt to income ratio of a country is by taking all the debt in the economy and dividing it by the country's income, called the gross domestic product (GDP). This is a very basic measure of how indebted a nation is. You would follow the same logic to assess whether you personally have too much debt relative to your income. The country as a whole is merely a sum of its parts and is no different.
Figure 1.4 illustrates the debt level of the United States over the past century. The last deleveraging process in the United States took about 20 years to run its course. The country reached its debt ceiling in 1929 (after the Roaring Twenties) and deleveraged until around 1950. It subsequently enjoyed the tailwinds of the leveraging cycle from the early 1950s until 2008 and is likely now once again saddled with the headwinds of the deleveraging process, and will likely be for a decade or two. The ratio of debt to GDP in 1929 was about 175 percent (it jumped to 250 percent during the Great Depression because GDP fell faster than total debt). In 2008 the ratio hit 350 percent, twice the level that caused the Great Depression! It took about 60 years of leveraging to achieve such a high ratio. Last time it took 20 years to bring the debt-to-GDP ratio back to a normal level; how long will it take this time, given the more extreme starting point? It certainly will not happen in a few years.

Figure 1.4 U.S. Total Debt as a Percentage of GDP (1900–2013)
Source: Bridgewater Associates.
In most cases throughout history, economies live through a painful depression during the deleveraging process as the self-reinforcing negative feedback plays out. This process produced Japan's so-called lost decade, which began in the early 1990s. Europe is suffering through the same fate today, and even countries like Australia and Canada remain vulnerable to that critical inflection point, given their high debt levels.
Given this discouraging backdrop, why has the U.S. economy not fallen into a depression during the present deleveraging process? What makes the current period seem not as bad as the Great Depression or other similar depressionary environments? Deleveraging produces a persistent headwind for the economic machine and prevents it from functioning in its normal fashion. This force is exceptionally powerful and if left alone to run its course, extreme economic and social hardship is a near certainty. Fortunately the central bank has the tools to manufacture a smooth deleveraging, one in which the debt ratio gradually declines over time, but with positive growth through the process. Recall that the Fed's main policy tool is having control of short-term interest rates. Thus, their first step is to lower rates to zero. Normally during the deleveraging process this does not work because high debt levels prevent the normal leveraging response to lower rates. People can't borrow more, even though rates are extremely low, because they already have too much debt and are no longer creditworthy.
Recall that spending must be financed by money or credit. The credit pipelines have been impaired so the Fed is not able to increase spending by stimulating borrowing. Therefore, it must create money to make up for the spending falloff from declining credit. If spending must be financed by money or credit, and credit is constrained, then the only tool left to stimulate more spending is to manufacture more money as shown in Figure 1.5.

Figure 1.5 The Source of Spending
Printing Money
The Fed has the unique ability to print money and buy assets. It can essentially create more money and inject it into the economic machine. Normally the Fed prints money to buy government bonds, which has the dual effect of lowering long-term interest rates and pushing money into the economy. Lower long-term rates along with already low short-term rates help reduce debt service and leaves more money to be spent.
Many argue that printing money is irresponsible and will ultimately create more problems than it solves (including hyperinflation). Proponents of this perspective may not recognize that nearly every deleveraging in history has ended with printing of currency. The reason is straightforward within the context of the economic machine: The negative feedback loop of the deleveraging process will continue until the cycle is broken with the printing of more money. Spending will continue to decline as credit contracts (remember that spending = money + credit). The debt-to-GDP ratio will get worse because the debt is falling slower than asset values and incomes. This is exactly what happened during the first few years of the Great Depression and in the United States in 2008, and is what Japan has been living through since the early 1990s. In all three cases conditions degraded until the printing of currency ensued. The same process has been repeated across countries over time.
Along the same lines, a common question is why the printing of trillions of dollars does not automatically result in high inflation. The answer is that the printing of more money replaces the decline in credit to the degree that total spending does not increase enough to cause inflation. Money plus credit equals total spending, and the decline in credit is roughly offset by the increase in money. If there were no printing of currency, then total spending would likely fall significantly (because the quantity of money would not have grown), and deflation would be the most probable outcome. In other words, the printing of money—which is normally inflationary on its own—merely offsets the deflationary conditions that exist at the time. That is why we have yet to see inflation from the 2008 crisis and why printing money may never lead to inflation. The result is entirely dependent on whether too much money is printed. Printing money alone is not a sufficient prerequisite for higher inflation. In fact, printing currency is necessary to keep spending positive while the debt-to-GDP ratio is simultaneously reduced over time. By pumping more money into the economic machine the resulting increase in spending can generate positive growth rates while credit—the normal tool used to prop up the economy—is healing itself from high debt levels.
The Importance of Balance Always, but Particularly Today
Today's environment should be observed within this understanding of how the economic machine operates. Prudent portfolio construction should thoughtfully consider the wide range of potential economic outcomes. In a nutshell, the headwinds of deleveraging constrain economic growth and inflation. Unprecedented levels of money printing that aim to produce a tailwind of strong growth and rising inflation are meeting this negative force. Deleveraging versus the printing of currency: these two powerful forces are going head to head. Which will win? We are in uncharted waters and the potential range of economic outcomes is extremely wide. If there is too much printing of money, inflation becomes a high risk; but if there is not enough, deflation may result. More printing of currency is positive for economic growth; however, an insufficient level will be overcome by the deleveraging process and result in low or negative growth. How this dynamic plays out is a crucial input for developing the appropriate portfolio mix for the foreseeable future because of its impact on the economy.
Investors may be blindsided if they are positioned for one specific economic environment and experience another. For example, if one expects strong growth and weak inflation (as we experienced for much of the 1980s and 1990s) and instead experiences weak growth and strong inflation, then significant portfolio underperformance is likely. This is because the type of portfolio that does well during one economic environment is very different from the allocation that outperforms during the opposite environment.
Given the broad range of economic outcomes in the current market environment, maintaining an economically balanced portfolio is prudent. That is, rather than aggressively betting on one economic outcome, you may be better served by balancing the risks across multiple economic environments. Balance is always important, but especially so when the range of potential economic outcomes is so wide.
What do economic outcomes have to do with asset allocation? The fact is that the future returns of asset classes are largely dependent on what transpires in the economic environment relative to what was expected. These foundations will be more fully explored throughout this book, but for now a simple summary should suffice. If growth is stronger than expected, then certain asset classes are biased to do better in that environment. If inflation is rising faster than what had been anticipated, then certain asset classes will benefit from such a scenario. What really matters is how the future plays out in relation to what was expected. Therefore, about half the time the economy is growing faster than expected, and half the time it underperforms expectations. The same holds true for inflation. This is a critical point that will be repeated and reinforced.
A corollary to this fact is that the bigger the difference between the discounted economic environment and actual results, the bigger the market response. For instance, if the market is expecting (and pricing in) 3 percent growth and the economy ends up growing by 3.2 percent, then assets that benefit from rising growth will probably outperform a little bit because the environment was slightly better than what was expected. This is a logical outcome. If I buy stocks and pay a price that assumes 3 percent growth and actually get 3.2 percent economic growth, then the price should rise to reflect this new reality. I received a benefit and am rewarded for the foresight. This example can be repeated for a single company as well. If I want to buy company X, a big factor in the price that I will pay depends on how much I think this company will earn in the future (since the return of my investment is ultimately based on the company's future earnings). I would expect to earn more if the economy is doing well versus if the economy is doing poorly, all else being equal. If I calculate that a fair price would be $10 per share if the economy grows 3 percent, then I would certainly be willing to pay more if I knew for a fact that the economy would deliver a little more than that (again, all else being equal). For one company, all else being equal is a less likely reality as the idiosyncrasies of individual units become bigger factors in the analysis. But if we are talking about hundreds or thousands of big public companies, then how the economy performs becomes a much more reliable factor.
Conversely, if the market prices in 3 percent growth and the economy actually contracts 3 percent, then the prices of these stocks are likely to fall drastically. If I paid for growth and the companies actually lost money, then I must have really overpaid. Public markets reflect changed conditions and shifts in future expectations (which are often a reflection of recent trends) by adjusting today's prices. As –3 percent growth becomes recognized, prices will reflect the deteriorating conditions.
In the current period, we are experiencing not only a massive deleveraging process, but also a policy response of printing an unprecedented amount of money. The natural consequence of such conditions is an extremely wide range of potential economic outcomes. In other words, the range of outcomes is always unknown because the odds of guessing right are about fifty-fifty during all periods. However, the likelihood of extreme outcomes today are even greater because of the significant forces of the deleveraging process and of printing trillions of dollars. In short, we live in times of great uncertainty both in terms of direction and magnitude.
Summary
The following summarizes the key points thus far:
- An appreciation of how the economic machine works and the current deleveraging cycle suggests that we live in a challenging environment that may last as long as a decade or two.
- Asset class returns are highly dependent on how economic growth and inflation transpire relative to what was expected. These outcomes are inherently unpredictable, particularly relative to anticipated conditions.
- The bigger the difference between growth and inflation expectations and actual conditions, the bigger the price changes in asset classes.
- Given the economic backdrop and policy response to such conditions, the odds of extreme outcomes have been heightened.
The natural conclusion from this analysis is that the importance of constructing a portfolio that is very well balanced is paramount. By balance, I mean a portfolio whose success is not overly dependent on one economic outcome. This may sound obvious. However, the reality is that nearly every portfolio fails this simple test and in most cases the portfolio owner is completely unaware of this crucial oversight. The main reason for this oversight is that investors do not think of portfolios within this context. There is a lack of appreciation of the fact that every asset class is merely a package of economic biases. Most do not construct portfolios with this perspective and therefore do not realize the inherent biases, exposures, and risks that exist. I will cover this topic in greater detail in the chapters ahead.
Since economic outcomes (relative to expectations) largely drive asset-class returns and more extreme outcomes lead to wider ranges of returns, the most prudent investment approach is to build a portfolio that is positioned to perform well regardless of the future economic environment—that is, one that is well balanced across economic environments so that whether inflation or growth is rising or falling the portfolio's result will not be materially impacted. Good balance is always important because the future is always uncertain; however, because of the greater likelihood of extreme outcomes in the current period, balance is even more critical today. It is one thing to get the direction of outcomes wrong, but completely another when the consequences of being wrong are severe.
One final warning before you proceed to the next chapter. You should never be too confident that you know what will happen next. This is especially true today. Look at all the major inflection points in history and honestly ask yourself whether you would have been able to accurately predict the next economic environment. How many people accurately forecasted the current period 10 years ago? The next 10 years will be equally difficult to foretell. If we know that we don't know the future, then we shouldn't invest as if we do. Simply stated, the reason to keep good portfolio balance is to minimize the risk and impact of guessing wrong.
In investing you cannot control the outcome, so your goal should be to put yourself in the best possible position to achieve the highest probability of success. The thought process behind developing such a strategy as described in this book is key because it provides the tools to help you create the conditions to increase your odds of achieving your long-term portfolio objectives. Even if you do not agree with everything you read, my hope is to introduce you to a different way of thinking so that you can make your own informed decisions about the most rational approach to balancing your portfolio.