
Chapter 15
The Strange Case of the Anonymous Stockbroker
This chapter deals specifically with how to measure risk when we invest in securities. Impossible as that may sound, quantification of investment risk is a process that is alive, well, and regularly practiced by professionals in today’s world of globalized investing. Charles Tschampion, a managing director of the $50 billion General Motors pension fund, recently remarked, “Investment management is not art, not science, it’s engineering. . . . We are in the business of managing and engineering financial investment risk.” The challenge for GM, according to Tschampion, “is to first not take more risk than we need to generate the return that is offered.”1 A high degree of philosophical and mathematical sophistication lies behind Tschampion’s words.
![]()
Throughout most of the history of stock markets—about 200 years in the United States and even longer in some European countries—it never occurred to anyone to define risk with a number. Stocks were risky and some were riskier than others, and people let it go at that. Risk was in the gut, not in the numbers. For aggressive investors, the goal was simply to maximize return; the faint-hearted were content with savings accounts and high-grade long-term bonds.
The most authoritative statement on the subject of risk had been issued in 1830 and had been purposefully vague.2 It appeared in the judge’s decision in a lawsuit over the administration of the estate of John McLean of Boston. McLean had died on October 23, 1823, leaving $50,000 in trust for his wife to receive the “profits and income thereof during her lifetime; on her death, the trustees were to distribute half the remainder to Harvard College and the other half, or “moiety,” to Massachusetts General Hospital. When Mrs. McLean died in 1828, the estate was valued at only $29,450. Harvard and the hospital promptly joined in bringing suit against the trustees.
In rendering his decision in the case, Justice Samuel Putnam concluded that the trustees had conducted themselves “honestly and discreetly and carefully, according to the existing circumstances, in the discharge of their trusts.” He declared that trustees cannot be held accountable for a loss of capital that was not “owing to their wilful default. . . . If that were otherwise, who would undertake such hazardous responsibility?” He continued with what came to be immortalized as the Prudent Man Rule:
Do what you will, the capital is at hazard. . . . All that can be required of a trustee to invest, is, that he shall conduct himself faithfully and exercise a sound discretion. He is to observe how men of prudence, discretion, and intelligence manage their own affairs, not in regard to speculation, but in regard to the permanent disposition of their funds, considering the probable income, as well as the probable safety of the capital to be invested.
There the matter rested for 122 years.
![]()
In June 1952, the Journal of Finance, the leading academic journal in finance published a fourteen-page article titled “Portfolio Selection.”3 Its author was Harry Markowitz, an unknown 25-year-old graduate student at the University of Chicago. That paper was innovative on so many levels, and ultimately so influential both theoretically and in terms of practicality, that it earned Markowitz a Nobel Prize in Economic Science in 1990.
In choosing equity investing as his topic, Markowitz was dealing with a subject that serious journals up to that time had considered too dicey and speculative for sober academic analysis. Even more daring, Markowitz was dealing with the management of the investor’s total wealth, the portfolio.a His main theme was that a portfolio of securities is entirely different from holdings considered individually.
He had no interest in the foolishness that characterized most stock-market literature, such as lessons from a ballet dancer on how to become a millionaire without really trying, or how to be recognized as a guru among market forecasters.4 Nor did he make any effort to present his ideas in the simple-minded language typical of most articles about the stock market. At a time when any kind of mathematical treatment was rare in economics, particularly in finance—-Jevons and von Neumann had cut a lot less ice up to that point than they had hoped—ten of the fourteen pages that make up Markowitz’s article carry equations or complicated graphs.
Markowitz is parsimonious in providing footnotes and bibliography: he makes only three references to other writers in a setting where many academics measured accomplishment by the number of footnotes an author could manage to compile. This failure to credit his intellectual forebears is curious: Markowitz’s methodology is a synthesis of the ideas of Pascal, de Moivre, Bayes, Laplace, Gauss, Galton, Daniel Bernoulli, Jevons, and von Neumann and Morgenstern. It draws on probability theory, on sampling, on the bell curve and dispersion around the mean, on regression to the mean, and on utility theory. Markowitz has told me that he knew all these ideas but was not familiar with their authors, though he had invested a good deal of time studying von Neumann and Morgenstern’s book on economic behavior and utility.
Markowitz placed himself solidly in the company of those who see human beings as rational decision-makers. His approach reflects the spirit of the early years after the Second World War, when many social scientists set about reviving the Victorian faith in measurement and the belief that the world’s problems could be solved.
Strangely, Markowitz had no interest in equity investment when he first turned his attention to the ideas dealt with in “Portfolio Selection.” He knew nothing about the stock market. A self-styled “nerd” as a student, he was working in what was then the relatively young field of linear programming. Linear programming, which happened to be an innovation to which John von Neumann had made significant contributions, is a means of developing mathematical models for minimizing costs while holding outputs constant, or for maximizing outputs while holding costs constant. The technique is essential for dealing with problems like those faced by an airline that aims to keep a limited number of aircraft as busy as possible while flying to as many destinations as possible.
One day, while waiting to see his professor to discuss a topic for his doctoral dissertation, Markowitz struck up a conversation with a stock broker sharing the waiting room who urged him to apply linear programming to the problems investors face in the stock market. Markowitz’s professor seconded the broker’s suggestion, enthusiastically, though he himself knew so little about the stock market that he could not advise Markowitz on how or where to begin the project. He referred Markowitz to the dean of the business school, who, he hoped, might know something about the subject.
The dean told Markowitz to read John Burr Williams’ The Theory of Investment Value, an influential book on finance and business management. Williams was a scrappy, impatient man who had launched a successful career as a stock broker in the 1920s but had returned to Harvard as a graduate student in 1932, at the age of thirty, hoping to find out what had caused the Great Depression (he didn’t). The Theory of Investment Value, published in 1938, was his Ph.D. thesis.
Markowitz dutifully went to the library and sat down to read. The book’s very first sentence did the trick for him: “No buyer considers all securities equally attractive at their present market prices . . . on the contrary, he seeks ‘the best at the price.’”5 Many years later, when Markowitz was telling me about his reaction, he recalled, “I was struck with the notion that you should be interested in risk as well as return.”
That “notion” seems unremarkable enough in the 1990s, but it attracted little interest in 1952, or, for that matter, for more than two decades after Markowitz’s article was published. In those days, judgments about the performance of a security were expressed in terms of how much money the investor made or lost. Risk had nothing to do with it. Then, in the late 1960s, the aggressive, performance-oriented managers of mutual fund portfolios began to be regarded as folk heroes, people like Gerry Tsai of the Manhattan Fund (“What is the Chinaman doing?” was a popular question along Wall Street) and John Hartwell of the Hartwell & Campbell Growth Fund (“[Performance means] seeking to get better than average results over a fairly long period of time—consistently”).6
It took the crash of 1973–1974 to convince investors that these miracle-workers were just high rollers in a bull market and that they too should be interested in risk as well as return. While the Standard & Poor’s 500 fell by 43% from December 1972 to September 1974, the Manhattan Fund lost 60% and the Hartwell & Cambell Fund fell by 55%.
This was a dark time, one marked by a series of ominous events: Watergate, skyrocketing oil prices, the emergence of persistent inflationary forces, the breakdown of the Bretton Woods Agreements, and an assault on the dollar so fierce that its foreign exchange value fell by 50%.
The destruction of wealth in the bear markets of 1973–1974 was awesome, even for investors who had thought they had been investing conservatively. After adjustment for inflation, the loss in equity values from peak to trough amounted to 50%, the worst performance in history other than the decline from 1929 to 1931. Worse, while bondholders in the 1930s actually gained in wealth, long-term Treasury bonds lost 28% in price from 1972 to the bottom in 1974 while inflation was running at 11% a year.
The lessons learned from this debacle persuaded investors that “performance” is a chimera. The capital markets are not accommodating machines that crank out wealth for everyone on demand. Except in limited cases like holding a zero-coupon debt obligation or a fixed-rate certificate of deposit, investors in stocks and bonds have no power over the return they will earn. Even the rate on savings accounts is set at the whim of the bank, which responds to the changing interest rates in the markets themselves. Each investor’s return depends on what other investors will pay for assets at some point in the uncertain future, and the behavior of countless other investors is something that no one can control, or even reliably predict.
On the other hand, investors can manage the risks that they take. Higher risk should in time produce more wealth, but only for investors who can stand the heat. As these simple truths grew increasingly obvious over the course of the 1970s, Markowitz became a household name among professional investors and their clients.
![]()
Markowitz’s objective in “Portfolio Selection” was to use the notion of risk to construct portfolios for investors who “consider expected return a desirable thing and variance of return an undesirable thing.”7 The italicized “and” that links return and variance is the fulcrum on which Markowitz builds his case.
Markowitz makes no mention of the word “risk” in describing his investment strategy. He simply identifies variance of return as the “undesirable thing” that investors try to minimize. Risk and variance have become synonymous. Von Neumann and Morgenstern had put a number on utility; Markowitz put a number on investment risk.
Variance is a statistical measurement of how widely the returns on an asset swing around their average. The concept is mathematically linked to the standard deviation; in fact, the two are essentially interchangeable. The greater the variance or the standard deviation around the average, the less the average return will signify about what the outcome is likely to be. A high-variance situation lands you back in the head-in-the-oven-feet-in-the-refrigerator syndrome.
Markowitz rejects Williams’ premise that investing is a single-minded process in which the investor bets the ranch on what appears to be “the best at the price.” Investors diversify their investments, because diversification is their best weapon against variance of return. “Diversification,” Markowitz declares, “is both observed and sensible; a rule of behavior which does not imply the superiority of diversification must be rejected both as a hypothesis and as a maxim.”
The strategic role of diversification is Markowitz’s key insight. As Poincaré had pointed out, the behavior of a system that consists of only a few parts that interact strongly will be unpredictable. With such a system you can make a fortune or lose your shirt with one big bet. In a diversified portfolio, by contrast, some assets will be rising in price even when other assets are falling in price; at the very least, the rates of return among the assets will differ. The use of diversification to reduce volatility appeals to everyone’s natural risk-averse preference for certain rather than uncertain outcomes. Most investors choose the lower expected return on a diversified portfolio instead of betting the ranch, even when the riskier bet might have a chance of generating a larger payoff—if it pans out.
Although Markowitz never mentions game theory, there is a close resemblance between diversification and von Neumann’s games of strategy. In this case, one player is the investor and the other player is the stock market—a powerful opponent indeed and secretive about its intentions. Playing to win against such an opponent is likely to be a sure recipe for losing. By making the best of a bad bargain—by diversifying instead of striving to make a killing—the investor at least maximizes the probability of survival.
The mathematics of diversification helps to explain its attraction. While the return on a diversified portfolio will be equal to the average of the rates of return on its individual holdings, its volatility will be less than the average volatility of its individual holdings. This means that diversification is a kind of free lunch at which you can combine a group of risky securities with high expected returns into a relatively low-risk portfolio, so long as you minimize the covariances, or correlations, among the returns of the individual securities.
Until the 1990s, for example, most Americans regarded foreign securities as too speculative and too difficult to manage to be appropriate investments. So they invested just about all their money at home. That parochial view was costly, as the following calculations demonstrate.
From 1970 to 1993, the Standard & Poor’s Index of 500 stocks brought its investors a total of capital appreciation plus income that averaged 11.7% a year. The volatility of the Index’s return, as measured by its standard deviation, averaged 15.6% a year; this meant that about two-thirds of the annual returns fell between 11.7% + 15.6%, or 27.3% on the high side, and 11.7% − 15.6%, or −3.9% on the low side.
The major markets outside the United States are usually tracked by an index published by Morgan Stanley & Company that covers Europe, Australia, and the Far East. This index is known as EAFE for short; the regulars in these markets pronounce it “Eee-fuh.” EAFE’s average annual return for a dollar-based investor from 1970 to 1993 was 14.3% versus S&P’s 11.7%, but EAFE was also more volatile. Largely because of Japan, and because foreign market returns are translated back into a dollar that fluctuates in value in the foreign exchange markets, EAFE’s standard deviation of 17.5% was over two full percentage points above the volatility of the S&P 500.
EAFE and the U.S. markets do not usually move up and down together, which is why international diversification makes good sense. If an investor’s portfolio had held 25% of its assets in EAFE and 75% in the S&P since 1970, its standard deviation of 14.3% would have been lower than either the S&P or EAFE, even while it was producing an average return that bettered the S&P 500 alone by an average of 0.6% a year.
An even more dramatic illustration of the power of diversification appears in the accompanying chart, which shows the track record of 13 so-called emerging stock markets in Europe, Latin America, and Asia from January 1992 through June 1994. The average monthly return of each market is plotted on the vertical axis; each market’s monthly standard deviation of return is plotted on the horizontal axis. The chart also shows an equally weighted index of the 13 markets as well as the performance of the S&P 500 over the same time period.
The blessings of diversification. The track records of 13 emerging stock markets compared to the index (average of 13) and the S&P 500 from January 1992 through June 1994. The data are in percentages per month.
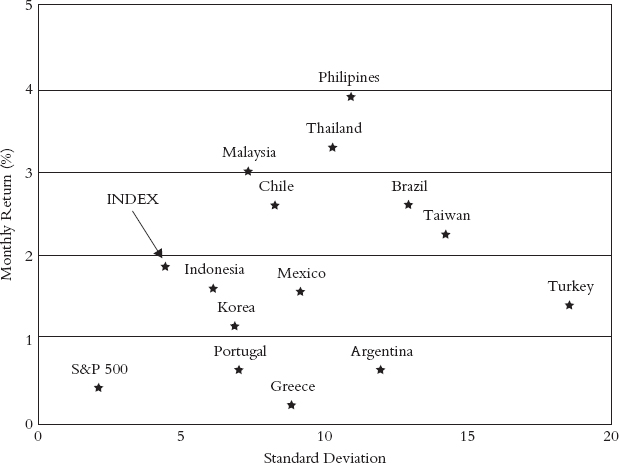
Although many investors think of emerging markets as a homogeneous group, the graph shows that these 13 markets tend to be largely independent of one another. Malaysia, Thailand, and the Philippines had returns of 3% a month or better, but Portugal, Argentina, and Greece were barely in the black. Volatilities ranged from about 6% all the way out to nearly 20% a month. There is plenty of heat in this oven.
The lack of correlation, or low covariance, among the markets caused the index to have the lowest standard deviation of any of its 13 components. A simple average of the monthly standard deviations of the twelve markets works out to 10.0%; the actual standard deviation of the diversified portfolio was only 4.7%. Diversification works.
Note that the emerging markets were much riskier than the U.S. stock market over this 18-month period. They were also a lot more profitable, which explains why investors were so enthusiastic about these markets at the time.
The riskiness of these markets came to light just eight months after the end of the time period covered here. Had the analysis been extended to February 1995, it would have included the Mexican debacle at the end of 1994; the Mexican market fell by 60% between June 1994 and February 1995. From January 1992 to February 1995, the average return of the 13 markets was only a little over 1% a month, down from nearly 2% during the time span shown on the chart, while the standard deviation of the index jumped from under 5% to 6% a month; an investor in Mexico and Argentina would have ended up losing money.b The Philipines, the best-performing market, dropped from 4% a month to only 3% a month. Meanwhile, the performance of the S&P 500 showed virtually no change at all.
![]()
By substituting a statistical stand-in for crude intuitions about uncertainty, Markowitz transformed traditional stock-picking into a procedure for selecting what he termed “efficient” portfolios. Efficiency, a term adopted from engineering by economists and statisticians, means maximizing output relative to input, or minimizing input relative to output. Efficient portfolios minimize that “undesirable thing” called variance while simultaneously maximizing that “desirable thing” called getting rich. This process is what prompted Tschampion 30 years later to describe the managers of the General Motors pension fund as “engineers.”
Investors will always want to own securities that represent “the best at the price.” The expected return of a portfolio made up of such securities will be the mean, or average, of the expectations for each of the individual holdings. But holdings that appear to offer the best returns frequently disappoint while others exceed the investor’s fondest hopes. Markowitz assumed that the probabilities of actual portfolio returns above and below the mean expectation will distribute themselves into a nice, symmetrically balanced Gaussian normal curve.
The spread of that curve around the mean, from loss to gain, reflects the variance of the portfolio—with the range of possible outcomes reflecting the likelihood that the portfolio’s actual rate of return will differ from its expected rate of return. This is what Markowitz meant when he introduced the concept of variance to measure risk, or the uncertainty of return; the combined approach to risk and return is commonly referred to by professionals and academics as mean/variance optimization. Common stocks have a much wider range of possible results than an obligation of the U.S. Treasury that will come due and pay off in 90 days; the return on the Treasury obligation has almost no uncertainty, because buyers will see their money again so soon.
Markowitz reserved the term “efficient” for portfolios that combine the best holdings at the price with the least of the variance—“optimization” is the technical word. The approach combines two clichés that investors learn early in the game: nothing ventured, nothing gained, but don’t put all your eggs in one basket.
It is important to recognize that there is no one efficient portfolio that is more efficient than all others. Thanks to linear programing, Markowitz’s method produces a menu of efficient portfolios. Like any menu, this one has two sides: what you want is on one side and the cost of what you want is on the other. The higher the expected return, the greater the risks involved. But each efficient portfolio on the menu will have the highest expected return for any given level of risk or the lowest level of risk for any expected return.
Rational investors will select the portfolio that best suits their taste for either aggressive objectives or defensive objectives. In the tradition of von Neumann and Morgenstern, the system provides a method to maximize each investor’s utility. This is the only point in the Markowitz system in which gut matters. All else is measurement.
![]()
“Portfolio Selection” revolutionized the profession of investment management by elevating risk to equal importance with expected return. That paper, together with the book by the same name that Markowitz wrote in 1959, provided the groundwork for just about all of the theoretical work in finance that followed. It has also supported a variety of applications over time, ranging from techniques of stock selection and the allocation of portfolios between stocks and bonds to the valuation and management of options and more complex derivative securities.
Despite its importance, critics of “Portfolio Selection” have turned Markowitz’s work into a punching bag, attacking from every side the entire set of assumptions that support it. Some of the problems they have raised are more mechanical and technical than substantive and have been overcome. Other problems continue to stir controversy.
The first is whether investors are rational enough in their decision-making to follow the prescription that Markowitz set out for them. If intuition triumphs over measurement in investing, the whole exercise could turn out to be a waste of time and a flawed explanation of why markets behave as they do.
Another criticism questions whether variance is the proper proxy for risk. Here the consequences are less clear. If investors perceive risk as something different from variance, some other measure might serve equally well and still preserve Markowitz’s optimizing approach to risk and return. And perhaps not.
Finally, what would happen if Markowitz’s assumption that there is a positive relationship between risk and return fails to survive empirical tests? If high returns are systematically available on low-risk securities, or if you land in the soup with securities you thought were low-risk, a retreat to the drawing board will be necessary.
We shall deal here briefly with the technical problems and then at greater length with the question of how well variance serves as a proxy for risk. Investor rationality is so important a matter that we devote Chapters 16 and 17 to it; investors, after all, are just people, although engaged in a particular activity, which means that the whole question of human rationality is involved.
The technical problems arise from Markowitz’s assumption that investors will have no difficulty estimating the inputs to his model—expected returns, variances, and the covariances among all the individual holdings. But, as Keynes emphasized in A Treatise on Probability and later as well, the use of data from the past is dangerous. And degrees of belief do not always lend themselves to precise measurement, particularly with the precision that the Markowitz approach requires. As a practical matter, most applications of the approach combine past experience with forecasts, though investors recognize that a significant margin of error surrounds the results of such calculations. In addition, the sensitivity of the process to small differences in estimates of the inputs makes the results even more tentative.
The most difficult step is in amassing the calculations required to measure how each individual stock or bond might vary in relation to each other stock or bond. William Baumol, the author of the paper demonstrating how long-term trends in productivity regress to the mean, calculated as late as 1966—fourteen years after the appearance of “Portfolio Selection”—that a single run to select efficient portfolios on the computers of that time would cost from $150 to $350, even assuming that the estimates of the necessary inputs were accurate. A more elaborate search would have run into thousands of dollars.8
Markowitz himself was concerned about obstacles to the practical use of his ideas. In cooperation with William Sharpe—a graduate student who later shared the Nobel Prize with him—Markowitz made it possible to skip over the whole problem of calculating covariances among the individual securities. His solution was to estimate how each security varies in relation to the market as a whole, a far simpler matter. This technique subsequently led to Sharpe’s development of what has come to be known as the Capital Asset Pricing Model, which analyzes how financial assets would be valued if all investors religiously followed Markowitz’s recommendations for building portfolios. CAPM, as it is known, uses the term “beta” to describe the average volatility of individual stocks or other assets relative to the market as a whole over some specific period of time. The AIM Constellation Fund that we looked at in Chapter 12, for example, had a beta of 1.36 during the years 1983 to 1995, which means that AIM tended to move up or down 1.36% every time the S&P 500 moved up or down 1%; it tended to fall 13.6% every time the market dropped 10%, and so on. The more stodgy American Mutual Fund had a beta of only 0.80%, indicating that it was significantly less volatile than the S&P 500.
Another mathematical problem stems from the idea that a portfolio, or the security markets themselves, can be described with only two numbers: expected return and variance. Dependence on just those two numbers is appropriate if, and only if, security returns are normally distributed on a bell curve like Gauss’s. No outliers are permitted, and the array of results on either side of the mean must be symmetrically distributed.
When the data are not normally distributed, the variance may fail to reflect 100% of the uncertainties in the portfolio. Nothing is perfect in the real world, so this is indeed a problem. But it is more of a problem to some investors than to others. For many, the data fit the normal distribution closely enough to be a useful guide to portfolio decisions and calculations of risk. For others, such imperfections have become a source of developing: new kinds of strategies that will be described later on.
![]()
The matter of defining risk in terms of a number is crucial. How can investors decide how much risk to take unless they can ascribe some order of magnitude to the risks they face?
The portfolio managers at BZW Global Investors (formerly Wells Fargo-Nikko Investment Advisors) once built this dilemma into an interesting story. A group of hikers in the wilderness came upon a bridge that would greatly shorten their return to their home base. Noting that the bridge was high, narrow, and rickety, they fitted themselves out with ropes, harnesses, and other safeguards before starting across. When they reached the other side, they found a hungry mountain lion patiently awaiting their arrival.9
I have a hunch that Markowitz, with his focus on volatility, would have been taken by surprise by that mountain lion. Kenneth Arrow, a man who thinks about risks in many different dimensions and who understands the difference between the quantifiable and the messy, would be more likely to worry that the mountain lion, or some other peril, might be waiting at the other side of the bridge.
Nevertheless, volatility, or variance, has an intuitive appeal as a proxy for risk. Statistical analysis confirms what intuition suggests: most of the time, an increase in volatility is associated with a decline in the price of the asset.10 Moreover, our gut tells us that uncertainty should be associated with something whose value jumps around a lot over a wide range. Most assets whose value is given to springing up violently tend to collapse with equal violence. If you were asked to rank the riskiness of shares of the Brazil Fund, shares of General Electric, a U.S. Treasury bond due in thirty years, and a U.S. Treasury bill due in ninety days, the ranking would be obvious. So would the relative volatility of these four securities. The overwhelming importance of volatility is evident in the role it plays in fashioning the risk-hedging instruments known as derivatives: options, swaps, and other instruments tailored to specific investor requirements.
Morningstar, the Chicago-based service that analyzes the performance of mutual funds, has provided an interesting example of how well volatility serves as a proxy for risk.11 In May 1995, Morningstar reported that mutual funds that invest in bonds and that charge fees (known as 12b-l fees) to cover their promotional expenses—fees that come out of the shareholders’ pockets—had standard deviations that averaged about 10% higher than bond funds that do not charge such fees. Morningstar came to this conclusion: “The true cost of 12b-1 fees, then, at least for bond funds, is not a slightly lower return, but a higher risk investment. . . . [I]t is the logical consequence of moving marketing costs into the investment equation.”
Yet there is no strong agreement on what causes volatility to fluctuate or even on what causes it in the first place. We can say that volatility sets in when the unexpected happens. But that is of no help, because, by definition, nobody knows how to predict the unexpected.
On the other hand, not everyone worries about volatility. Even though risk means that more things can happen than will happen—a definition that captures the idea of volatility—that statement specifies no time dimension. Once we introduce the element of time, the linkage between risk and volatility begins to diminish. Time changes risk in many ways, not just in its relation to volatility.
My wife’s late aunt, a jolly lady, used to boast that she was my only in-law who never asked me what I thought the market was going to do. The reason, she explained, was this: “I didn’t buy in order to sell.” If you are not going to sell a stock, what happens to its price is a matter of indifference. For true long-term investors—that small group of people like Warren Buffett who can shut their eyes to short-term fluctuations and who have no doubt that what goes down will come back up—volatility represents opportunity rather than risk, at least to the extent that volatile securities tend to provide higher returns than more placid securities.
Robert Jeffrey, a former manufacturing executive who now manages a substantial family trust, has expressed the same idea in a more formal manner: Volatility fails as a proxy for risk because “volatility per se, be it related to weather, portfolio returns, or the timing of one’s morning newspaper delivery, is simply a benign statistical probability factor that tells us nothing about risk until coupled with a consequence.”12 The consequence of volatility to my wife’s aunt was nil; the consequence of volatility to an investor who will need to invade capital tomorrow is paramount. Jeffrey sums the matter up in these words: “[T]he real risk in holding a portfolio is that it might not provide its owner, either during the interim or at some terminal date or both, with the cash he requires to make essential outlays.” (The italics are mine.)
Jeffrey recognized that the risk inherent in different assets has meaning only when it is related to the investor’s liabilities. This definition of risk reappears in many different guises, all of them useful. The central idea is that variability should be studied in reference to some benchmark or some minimum rate of return that the investor has to exceed.
In the simplest version of this approach, risk is just the chance of losing money. In that view, a zero nominal return becomes the benchmark as investors try to build portfolios that minimize the probability of negative returns over some time period.
That view is a long way from Markowitz’s, as we can see from the following illustration. Consider two investors. One of them invested 100% in the S&P 500 at the beginning of 1955 and held on for forty years. The other invested in a 30-year Treasury bond. In order to maintain the 30-year maturity, this investor sells his original bond (now a 29-year bond) at the end of each year and buys a new 30-year bond.
According to the Markowitz method of measuring risk, the second investor’s bond, with an annual standard deviation of 10.4%, was a lot less risky than the first investor’s stock portfolio, whose standard deviation worked out to 15.3%. On the other hand, the total return on the stock portfolio (capital appreciation plus income) was much higher than the bond’s total return—an annual average of 12.2% as against only 6.1%. The stock portfolio’s high return more than compensated for its greater volatility. The probability of a year with a zero return on the stock portfolio was 22%; the bondholder faced a 28% probability of a down year. The stock portfolio returned more than the bond’s average return in two-thirds of the years in the time period. Which investor took the greater risk?
Or consider those 13 emerging markets I mentioned earlier. From the end of 1989 to February 1994, they were three times as volatile as the S&P 500, but an investor in the package of emerging markets had fewer losing months, was consistently wealthier, and, even after the sharp drop at the end of 1994, ended up three times richer than the investor in the S&P 500. Which was riskier, the S&P 500 or the emerging markets index?
The degree to which a volatile portfolio is risky, in other words, depends on what we are comparing it with. Some investors, and many portfolio managers, do not consider a volatile portfolio risky if its returns have little probability of ending up below a specified benchmark.c That benchmark need not be zero. It can be a moving target, such as the minimum required return for a corporation to keep its pension fund solvent, or the rate of return on some index or model portfolio (like the S&P 500), or the 5% of assets that charitable foundations are mandated to spend each year. Morningstar ranks mutual funds by riskiness in terms of how frequently their returns fall below the return on 90-day Treasury bills.
Yet measuring risk as the probability of falling short of a benchmark in no way invalidates Markowitz’s prescription for portfolio management. Return is still desirable and risk is still undesirable; expected return is to be maximized at the same time that risk is to be minimized; volatility still suggests the probability of falling short. Optimization under these conditions differs little from what Markowitz had in mind. The process holds up even when risk is seen as a multi-dimensional concept that incorporates an asset’s sensitivity to unexpected changes in such major economic variables as business activity, inflation, and interest rates, as well as its sensitivity to fluctuations in the market in which it trades.
Risk can be measured in yet another probability-based fashion, this one based exclusively on past experience. Suppose an investor acts as a market-timer, trying to buy before prices rise and sell before prices fall. How much margin of error can a market-timer sustain and still come out ahead of a simple buy-and-hold strategy?
One of the risks of market timing is being out of the market when it has a big upward move. Consider the period from May 26, 1970, to April 29, 1994. Suppose our market-timer was in cash instead of stocks for only the five best days in the market out of that 14-year period of 3,500 trading days. He might feel pretty good at having just about doubled his opening investment (before taxes), until he reckoned how he would have done if he had merely bought in at the beginning and held on without trying anything tricky. Buy-and-hold would have tripled his investment. Market timing is a risky strategy!
Risk measurement becomes even more complicated when the parameters are fluid rather than stationary. Volatility itself does not stand still over time. The annual standard deviation of monthly returns on the S&P 500 amounted to 17.7% from the end of 1984 to the end of 1990; over the next four years the standard deviation was only 10.6% a year. Similar abrupt changes have occurred in bond-market volatility. If such variation can develop in broadly diversified indexes, the likelihood is much greater that it will appear in the case of individual stocks and bonds.
The problem does not end there. Few people feel the same about risk every day of their lives. As we grow older, wiser, richer, or poorer, our perception of what risk is and our aversion to taking risk will shift, sometimes in one direction, sometimes in the other. Investors as a group also alter their views about risk, causing significant changes in how they value the future streams of earnings that they expect stocks and long-term bonds to provide.
An ingenious approach to this possibility was developed by Markowitz’s student, associate, and fellow Nobel Laureate, William Sharpe. In 1990, Sharpe published a paper that analyzed the relationship between changes in wealth and the willingness of investors to own risky assets.13 Although, in accordance with the view of Bernoulli and of Jevons, wealthy people are probably more risk-averse than other people, Sharpe hypothesized that changes in wealth also influence an investor’s aversion to risk. Increases in wealth give people a thicker cushion to absorb losses; losses make the cushion thinner. The consequence is that increases in wealth tend to strengthen the appetite for risk while losses tend to weaken it. Sharpe suggests that these variations in risk aversion explain why bull markets or bear markets tend to run to extremes, but ultimately regression to the mean takes over as contrary investors recognize the overreaction that has occurred and correct the valuation errors that have accumulated.
![]()
Despite the criticisms of Markowitz’s theory of portfolio selection, his contribution has been immense. It has provided the foundation for the primary theoretical work accomplished since 1952 and has given rise to practical applications that dominate the field of investing. Indeed, diversification has become a veritable religion among investors. Even the attacks on Markowitz have triggered new concepts and new applications that might never have come about without his innovative contributions.
Yet much of what one makes of Markowitz’s achievement, and the structure whose foundations he laid, depends on how one feels about the controversial issue of investor rationality. Just as Wall Street was beginning to apply the new theories of investment, the sound of different drummers was heard. The critically important work on rational behavior, most of which dates from the tumultuous early 1970s, provoked a dramatic break with the optimistic views of rationality that had characterized the innovations of the 1950s and 1960s. The stage was set to take up cudgels against the models of Daniel Bernoulli, Jevons, and von Neumann, to say nothing of the central assumptions of traditional economic theory.
The response to this rough assault on hallowed principles of behavior was tentative at first, in part because academics do not always express themselves with clarity, and in part because of the enormous vested interests that had accumulated around the established theories of decision-making and choice. But the gloomy environment of the 1970s provided the impulse that unleashed the power, ingenuity, and common sense that marked the new ideas and ultimately brought them into the forefront of academic research and to the attention of practitioners. Today the journals are full of attacks on concepts of rational behavior and risk aversion.
Daniel Bernoulli had admitted in his paper that there were “exceedingly rare exceptions” to his propositions. He underestimated how frequently human beings stray from the strait and narrow path he laid out for them. Recent research reveals that many of the deviations from established norms of rational behavior are systematic.
There is another possibility. Perhaps people are not nonrational, but the traditional model of rationality may specify a pattern of behavior that captures only in part the way that rational human beings make their decisions. If that is the case, the problem is with the model of rationality rather than with us human beings. If the choices people make are both logical and predictable, even with varying rather than constant preferences, or with preferences that do not suit the strict prescriptions of rationality, behavior can still be modeled by mathematical techniques. Logic can follow a variety of paths in addition to the paths specified in the traditional model.d
A growing volume of research reveals that people yield to inconsistencies, myopia, and other forms of distortion throughout the process of decision-making. That may not matter much when the issue is whether one hits the jackpot on the slot machine or picks a lottery number that makes dreams come true. But the evidence indicates that these flaws are even more apparent in areas where the consequences are more serious.
The word “irrational” may be too strong to apply to such behavior, because irrationality conveys craziness and most people are (perhaps by definition?) not crazy. Richard Thaler, a University of Chicago economist, has observed that people are neither “blithering idiots” nor “hyperrational automatons.”14 Nevertheless, Thaler’s pioneering studies of how people make choices in real life reveal significant deviations from what Bernoulli or Markowitz believed.
This is a fascinating area, a course in self-discovery. The more we learn about it, the more we realize that each of us fails the traditional tests of rationality in ways that we may never have thought about. Von Neumann, despite the brilliance of his insight, omitted important parts of the story.
a The word has a Latin root, from portare, to carry, and foglio, leaf or sheet. Portfolio has thus come to mean a collection of paper assets.
b The standard deviation of the Mexican market alone leapt from 8% to 10% a month (four times the monthly volatility of the S&P 500) to better than 15% a month during the first half of 1995.
c For an extended and informative discussion of these issues, see The Journal of Investing, Fall 1994.
d Jack Benny had a routine on a Sunday radio show in which he remained silent when confronted by a mugger demanding “Your money or your life.” After a long pause, the mugger cried, “Come on!” “I’m thinking it over,” Benny predictably responded.
Notes
1. From an address on February 7, 1995, on the subject of investing worldwide.
2. The full text of “The Prudent Man Decision” may be found in The Journal of Portfolio Management, Fall 1976, pp. 67–71.
3. A full biographical sketch of Markowitz and a detailed analysis of his 1952 paper appears in Bernstein, 1992, Chapter 2.
4. Darvan, 1994 (reprint).
5. Williams, 1938, p. 1.
6. Kaplan and Welles, 1969, p. 168.
7. All quotations from Markowitz are from Markowitz, 1952.
8. Baumol, 1966.
9. Wells Fargo-Nikko Investment Advisors, Global Currents, March 1995, p. 1.
10. See Sorensen, 1995, p. 12.
11. Phillips, 1995.
12. Jeffrey, 1984.
13. Sharpe, 1990, p. 34.
14. Thaler, personal correspondence.