
52
2. THICK-ELECTRODE DEP FOR SINGLE-CELL 3D ROTATION
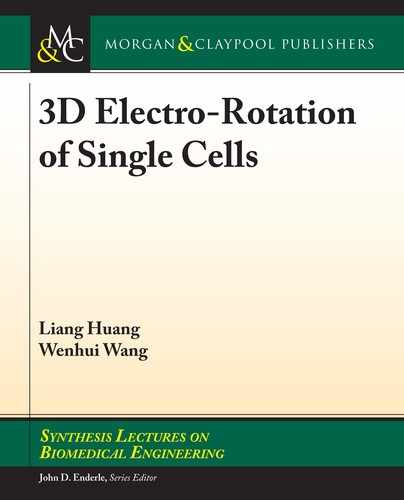
2.7.3 EXPERIMENTAL ANALYSIS
e dielectric properties of four cells (HeLa, C3H10, B lymphocytes, and HepaRG) were extracted
according to the curve tting method, and each cell type had 8–12 samples. e horizontal rotation
spectrum of the cells was obtained by applying an electrical signal of 10 V and frequency range from
100 kHz–10 MHz (Figure 2.36(a)).
Twenty frequency points were measured for each cell sample and the rotation spectrum was
tted with least error. According to the tting results, the B lymphocyte measurement results (C
mem
= 10.14 ± 0.08 mF/m
2
; σ
cyto
= 0.55 ± 0.07 S/m) are very close to the literature [165] (C
mem
= 10.33
± 1.60 mF/m
2
; σ
cyto
= 0.41 ± 0.10 S/m), verifying the accuracy of the method. Figure 2.36(b) and
Table 2.3 compare the measurements of the four types of cells. It can be seen that the dielectric
properties of the four cells are dierent. Among them, B lymphocytes have the smallest area-spe-
cic membrane capacitance and the largest cytoplasmic conductivity.
1,000
500
0
-500
-1,000
-1,500
HeLa
C3H10
B lymphocyte
HepaRG
HeLa-fitting
HeLa-experiment
C3H10-fitting
C3H10-experiment
B lymphocyte-fitting
B lymphocyte-experiment
HepaRG-fitting
HepaRG-fExperiment
15
10
5
10
4
10
6
10
8
cyto
AC Frequency (Hz)
Rotation Speed (˚/sec)
(b)(a)
(µm)
(S/m)
C
mem
(mF/m
2
)
Φ
σ
14
10
6
0
0.2
0.4
0.6
Figure 2.36: Measurement of four types of cell electrical parameters: (a) rotation spectrum measure-
ment and tting results; and (b) spatial distribution of electrical parameters.
Table 2.3: Electrical characteristics of four types of cells
Cell Types Number
Diameter
Φ (μm)
Area-specic Membrane
Capcitance
C
mem
(mF/m
2
)
Conductivity of
Cytoplasm
σ
cyto
(S/m)
HeLa 10 14.0 ± 1.8 13.11 ± 0.11 0.36 ± 0.05
C3H10 8 14.0 ± 1.5 14.73 ± 0.14 0.31 ± 0.04
B lymphocyte 9 8.2 ± 1.4 10.14 ± 0.08 0.55 ± 0.07
HepaRG 12 12.0 ± 0.5 15.83 ± 0.12 0.26 ± 0.05
..................Content has been hidden....................
You can't read the all page of ebook, please click here login for view all page.