
13. Core Risks of Software Projects
,If you’ve been in the software business for any time at all, you know that there are certain common problems that plague one project after another. Missed schedules and creeping requirements are not things that just happen to you once and then go away, never to appear again. Rather, they are part of the territory. We all know that. What’s odd is that we don’t plan our projects as if we knew it. Instead, we plan as if our past problems are locked in the past and will never rear their ugly heads again. Of course, you know that isn’t a reasonable expectation. This chapter will help you figure out how much your next project plan needs to accommodate the problems you’ve observed in the past. While we’re at it, we’ll demonstrate use of the RISKOLOGY simulator as a tool for applying patterns of core risk behavior to a new project plan.
Risks Common to All Software Projects
You could probably make a list of twenty or thirty problems that are so ubiquitous they could reasonably be expected to appear—at least to some extent—on every project. We’ve chosen to work with only five. We selected these five because they account for most of the deviation between plan and actual, and also because we have been able to collect some useful industry data on the extent of these risks. Here’s our shortlist of core risks:
2. requirements inflation (requirements creep)
3. employee turnover
4. specification breakdown
5. poor productivity
Of these, only the last is really performance-related. The other four are almost totally independent of how hard you work and how competent and clever you are about doing that work. This is worth emphasizing because one of the worries many managers have about risk management is that it will be an excuse for poor performance. But making some reasonable provision for these uncontrollables is the heart of risk management. Such a provision doesn’t give you leave to fail; it just sets aside a reserve in case some number of these uncontrollables turn against you.
The following sections define the five risks and show industry patterns to quantify them.
Core Risk #1: Schedule Flaw
The first core risk is due to some flaw in—or the total bankruptcy of—the process of setting budgets for time and effort. This can be viewed as an error in the schedule itself as opposed to an error in the way the project is run. (That overaggressiveness can be a schedule flaw will come as a surprise to the kind of managers who have never seen an aggressive schedule they didn’t like.) Schedule flaw is not only a real risk; it is the largest of the five core risks in its impact on plan versus actual performance.
Schedule flaw can be viewed as a tendency to misjudge the size of the product to be built. If you make a serious effort to size a software product—let’s say in function points or COCOMO-weighted KLOC, or the equivalent—there is still a serious likelihood of undersizing. You’re more inclined to neglect work that turns out to be needed than to include work that subsequently proves unnecessary. Any oversizing that happens to be in your plan is seldom sufficient to offset the undersizing.
If you don’t make a serious effort to size the product, then your schedule estimates are based on nothing more than wishful thinking: “Gee, the customer wants this by May; May is seven months away, so I guess the schedule is seven months.” When the schedule is set without regard to product size, overruns of 50 to 80 percent are likely. When a seven-month project ends up taking twelve months, angry upper managers seldom blame the schedule; instead, they blame those who were supposed to make that schedule—no matter how ridiculous it was—into reality. But the problem is flawed schedule, not flawed performance. In retrospect, the product was undersized by fiat; the act of restricting the length of the project limited its size to what could be built in that time, and that limit turned out to be unrealistic.
How big a problem is schedule flaw across the software industry? In order to come up with an answer to this, we had to digest overrun data, including data that others had collected, and then back out the effects of the remaining core risks. This enabled us to assert that we had isolated the effect of schedule flaw. This separation of causal factors is not a trivial problem—and we don’t claim to have achieved perfection in our result—but the following uncertainty diagram is our best assessment of deviation from schedule due, on average, to improper scheduling alone:

As the graph implies, if we know nothing else about your project or your organization, our safest bet is that your original size estimate—either directly calculated or inferred by a fiat schedule—will cause you to overrun your schedule by at least 30 percent. For example, a horizontal drawn at 0.50 intersects the curve at a point implying 1.30 or more of a time-multiplication factor.
The situation shown here is considerably worse than it needs to be. The industry-wide trend is compromised by the fact that so many companies don’t do their homework on sizing, opting instead for backward scheduling or pure wishful thinking. While we as an industry do no better than the pattern shown in the graph above, those companies that do make a serious effort to size can reduce the impact of schedule flaw to less than 15 percent. Collecting data for a few projects on the extent of undersizing could teach you to set aside a sensible provision for this on future projects. Eventually, you could produce a risk diagram that was balanced, where the fifty-fifty point is at 0-percent overrun and the likelihood of finishing ahead of schedule (considering this one core risk alone) is equal to the likelihood of finishing late.
Our data is biased toward smallish projects, those under three-thousand function points. Larger projects seem to suffer slightly less from this effect. Maybe fewer of them try to bypass the sizing effort. Also, larger (longer) projects afford greater opportunity for resizing along the way.
We asserted above that most of the core risks had no implication of poor performance by the team. This is true of the schedule-flaw risk, but only if we ignore the performance of management. Managers who come up with or agree to seriously flawed schedule commitments are performing poorly. The key point is that when a project overruns its schedule, it is in spite of, not due to, developer performance. The team, apart from the manager, may be performing at an optimal level.
Core Risk #2: Requirements Inflation
The piece of software that you and your staff build is always intended to fit into somebody’s business domain. One thing you can be sure of is that the domain is not going to remain static during the building process. It will change at a rate dictated by its markets and its own invention rate. If you set out in January to deliver an X, ten months hence, by the end of those ten months, an X is no longer what your business partners really want. What they really want is an X-prime. The difference between what they wanted at the beginning and what they want at the end is due to some change that has affected the domain in the meantime.
From the project’s point of view, this change is always inflation. Even removing something already built is a kind of inflation since it causes increased work.
How much inflation should you reasonably expect? If you agree with what we’ve written in the last two paragraphs, you can see that 0 percent is not a good answer. Yet it is the answer implied by the way we usually schedule new projects. Our reasoning seems to go,
If you want an X, we can give it to you in ten months; if you turn out to want something other than an X, that’s your problem.
But it isn’t. Hitting the moving target is everybody’s problem. Planning on delivering in the future exactly what the stakeholders say that they want today is like throwing a football to where the receiver used to be.
A better logic would go something like this: “You say you want an X; our experience suggests that there will be some change in that requirement along the way and that you will eventually end up wanting something slightly different, so we will plan on building an X with some accommodation for expected change.”
But how much? In the mid 1990’s, the U.S. Department of Defense (DoD) proposed some quantitative targets for how well-run projects should behave. They quantified the extent of reasonably expected change to be something less than 1 percent per month. So, a project that set out to build a product sized at twenty-thousand function points, over two years, should expect to build about twenty-five thousand function points of software (20,000fp * (1.00 + 24 months * 1% per month)). The actual deliverable may be sized somewhere in between since some of the changes will cause work already completed and paid for to be discarded.
The DoD experience may be somewhat difficult to apply to your project. Since typical DoD software products are large, the projects are contracted and sometimes subcontracted to several levels, and the projects are longer than most commercial efforts. Furthermore, the DoD approximation is expressed in terms of size itself rather than the time effect of changing size.
From our own data—which is rich in one- and two-year projects with ten or fewer staff members—we come up with the following expected time effect of shifting requirements:
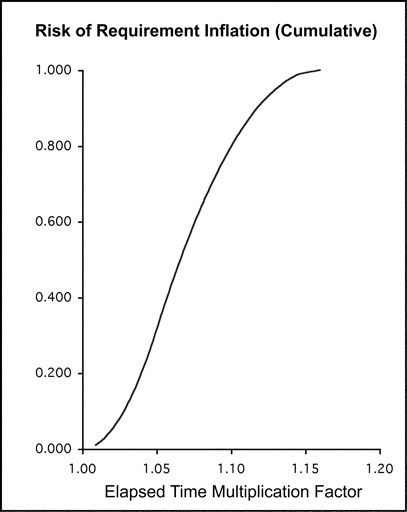
The impact of this risk may be different in your organization from what we have shown. Of course, you’ll want to override our data with your own, if you have any (see the next section for tips on overriding). If you don’t have data, use what we’ve provided in the RISKOLOGY simulator as a starting point. It is sure to be a better guess than the standard one of expecting 0-percent change.
Core Risk #3: Turnover
People sometimes leave during a project. The possibility that this will happen is usually left out of the estimation process. To take account of this factor, you’ll want to allocate some buffer to contain the risk. How much? This is what we come up with from our project database:
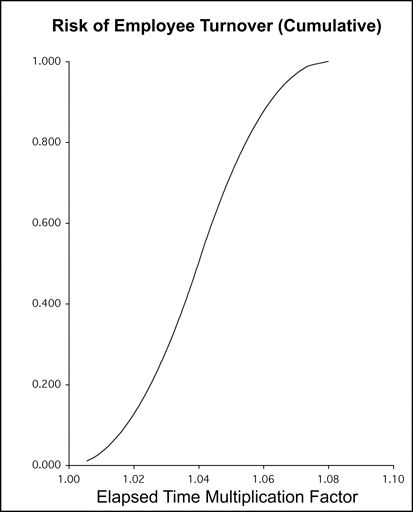
Shown here is the effect of employee turnover on one- and two-year projects, assuming industry average turnover figures.
This is one core risk for which you are likely to have decent internal data, and you should override our risk table with one of your own. The instructions for overriding are available at the RISKOLOGY Website. The information you’ll need to complete your override is this:
• average turnover percentage per year for technical staff at your company
• your own best assessment of ramp-up time for each replacement hired
We define ramp-up time as the number of months it takes a typical new hire to begin performing at the level of the person he or she replaces. Figures for ramp-up time tend to vary from around two months for a plain-vanilla in-house business IT shop to twenty-four months for companies doing esoteric engineering applications. Obviously, the extent of ramp-up time is a function of how complex your domain is and how much it deviates from the norm (from the kind of experience base your typical new hire might have).
Coming up with a reasonable assessment of ramp-up time may be a chore, but any well-thought-out number you come up with is a great improvement on zero, the default assumption that has always been built into our project management hypothesis set . . . until now.
Core Risk #4: Specification Breakdown
The fourth core risk, specification breakdown, is different in kind from the others. It is discrete rather than continuous, binary in its effect (in other words, it either happens or doesn’t happen, rather than affecting you to some varying degree), and when it does happen, it is almost always fatal. It doesn’t slow your project down—it sinks it.
Specification breakdown refers to the collapse of the negotiation process that is at the heart of requirements-setting, at the beginning of any project. You might think that this would be a relatively easy problem to spot, and therefore fairly containable: The various parties just can’t agree on what product to build, so you cancel early, pick up your marbles, and go home without too great a loss.
Unfortunately, it seldom works that way. People are supposed to agree. They are supposed to cooperate. When there is sufficiently deep conflict to make that impossible, the effect is often covered up. The project goes ahead with a flawed, ambiguous target, something that no one is happy with but that each party can live with for the time being, at least.
Let’s say that the conflict is over which stakeholder is to control a certain key piece of data. The specification artfully avoids stating where the data is to reside, what permissions are required to alter it, what audits track it, which backup it is part of, whether it is altered by certain transactions, when and how it can be overridden, and so on. People grumble over the spec because it isn’t very clear. But it also has the advantage of not being clearly unacceptable to any of the parties. The project proceeds (or seems to proceed) into internal design and implementation activities.
The covered-up problem goes away for a time, but not permanently. While it is possible to specify a product ambiguously, it is not possible to build a product ambiguously. Eventually, the deferred problems need to be faced, and the conflict arises again. In the worst cases, this happens very late in the project, after most or all of the budgeted time and money have been used up. The project is fragile at that point, and erosion of support by any of the parties can lead to a quick cancellation. The project is effectively killed without anyone ever needing to confess to the underlying lack of accord that was the real problem.
Specification breakdown manifests itself in other ways as well. One of these is what management authority Peter Keen calls counter-implementation, in which disaffected stakeholders overload the project with more and more functionality.1 Functions A through F are used to justify a project. But then functions G through Z are added on by seemingly enthusiastic supporters of the project. With that much added functionality, there is no hope of benefit exceeding cost. This kind of “piling on” typically happens late in the analysis activity and results in a failure to close on specification.
1 Peter G.W. Keen, “Information Systems and Organizational Change,” Communications of the ACM, Vol. 24, No. 1 (January 1981), pp. 24–33.
About a seventh of all the projects in our database were canceled without delivering anything. Other researchers have come up with different estimates of the proportion of canceled projects, but most are in the range of 10 to 15 percent. We’ve taken a middle value from this percentage range of project cancellations and treated it as a fixed specification-breakdown risk. For simplicity, we have assumed that specification breakdown is the only cause of project cancellation. (You can probably find a project somewhere that was canceled for reasons having nothing to do with stakeholder conflict; be sure, though, that the purported reason is not just a cover up for a deep lack of accord among the parties.)
The application of this core risk is also a bit unique. We propose that you burden each new project with this cancellation risk up until there is clear closure on specification. After that, you turn the risk off.
To deal with the problem of ambiguity used to conceal disagreement, we define specification closure to mean that all parties sign off on the boundary data going into and out of the product, and on definitions down to the data element level of all dataflows arriving or departing from the software to be constructed. Notice that this agreement is only on data, not on functions to be performed on that data or functions required in order to produce the data. While agreement on dataflows may only be part of the required accord, it is a key part. Since data descriptions are less prone to ambiguity than function descriptions, we feel safe concluding that sign-off on net arriving and departing dataflows is a fair indicator of accord. When such an accord is reached, the cancellation risk should be deactivated.
There is some pseudo-science here that ought not to be allowed to stand unchallenged. We’ve ignored additional causes of cancellation and produced our RISKOLOGY simulator so that it forces you to confront the possibility of project cancellation up until our sign-off milestone is met—and then it shows zero chance of cancellation from that point on. This is a fairly coarse handling of the delicate matter of canceled projects, justified only by the fact that such a high proportion of the projects that eventually get canceled never can muster the agreement necessary to pass the milestone.
Core Risk #5: Under-Performance
There is a lot of evidence in the literature of substantial differences in performance across any population of developers. The differences among whole project teams are damped somewhat and always less than the extremes of difference between individuals. Further, some of the difference in individual performance is due to one or another of the four core risks that we’ve already presented. After backing out the effect of the other risks and spreading individual differences across teams, we come up with this effect of team performance variation (see graph, below).
This factor tends to be fairly balanced: You are essentially as likely to get a positive break on performance as a negative one.
There is a danger in using our data for very small teams since individual differences there may not damp out. A team of one, for example, exposes you to a far greater effect of under- or over-performance.
A balanced risk such as under/over-performance merely introduces noise into the process. It widens your window of uncertainty without shifting mean expectation in either direction.

Combined Effect of the Core Risks
The simulator asks you for a few project parameters, gives you the opportunity to override any or all of the core risks with your own data, and then runs instances of the project to profile how long it can be expected to take. The profile is the result of five-hundred separate simulations, with finish dates grouped into discrete ranges. For a project (here named Amalfi) with N at about 26 months and no overrides, the RISKOLOGY simulation results look like the figure you encountered at the end of Chapter 12:

If this were your project, here’s how you might interpret and explain the result: There is some nonzero likelihood of delivering your product in the period from Month 26 to Month 27. It’s far more likely, however, that you’ll be done by Months 32 to 34. For a 75-percent confidence level, you may have to go all the way out to Month 38. About 15 percent of the runs ended up with the project being canceled. That is a fair assessment of the cancellation risk, looking forward at the project from day one, but within the first six months, it should be possible to assess that cancellation risk much more precisely and perhaps retire it.
Core Risks as an Indicator of Completeness
Core risks can also be used to assess whether or not the risk management process has been reasonably performed. For example, if you represent the five core risks but use different data from ours, you may still reasonably assert that you’ve done risk management and done it sensibly. We take a very dim view, however, of projects that claim to be managing risks when they have clearly not taken account of these five core risks.