
FIGURE
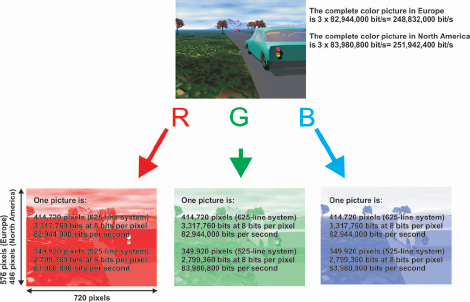
1.7
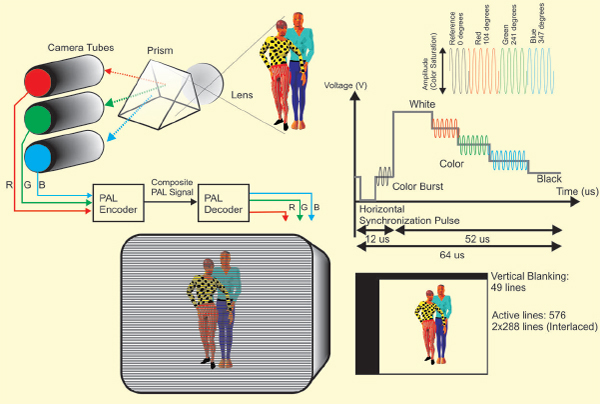
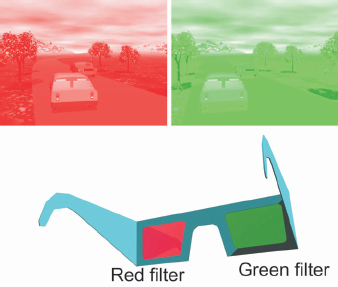
By using color filters or a prism, a picture can be separated into its three basic color components.
FIGURE
1.8
In the European analog system for color television, PAL, the color information is coded in a phase modulated subcarrier at 4.43 MHz. The phases of the carrier indicate the color tone and the amplitude symbolizes the saturation of the color.
FIGURE
1.9
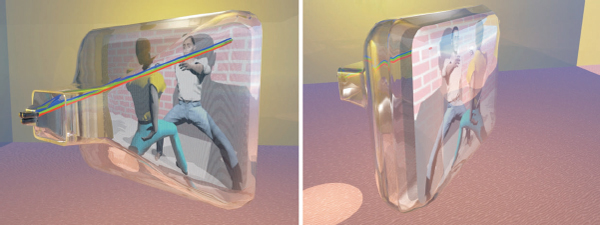
In a color tube, there are three electron guns instead of one as in a black and white tube.
FIGURE
1.11
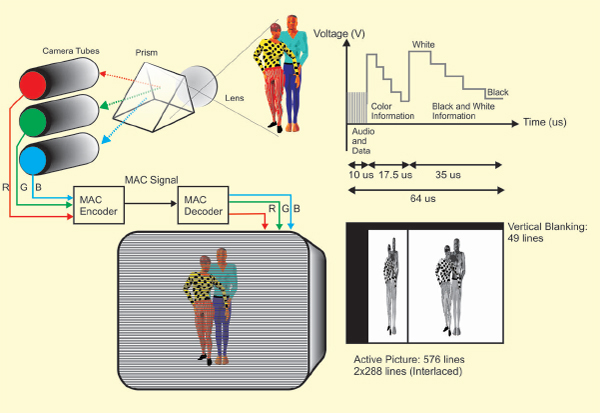
In the MAC system, the color components of the picture were separated by transmitting the black-and-white part of the picture in the beginning of each line and the color information was sent in the later part of each line.
FIGURE
2.3
A color pictue really consists of three pictures (red, green and blue). Alternatively, the picture may be represented by the black-and-white Y signal along with the U and V color difference signals.
FIGURE
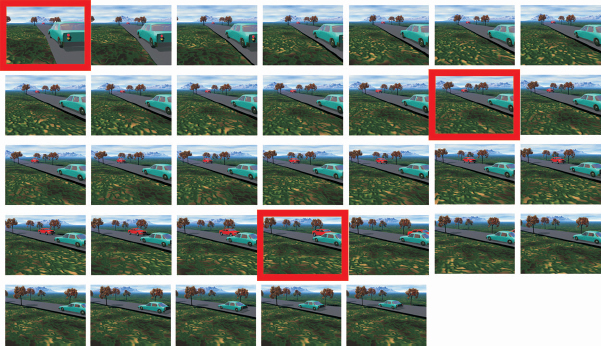
2.5
MPEG algorithms are based on using only the difference in information between the original pictures in the video file. In this example only one of every 12 pictures is saved or transmitted (marked in red).

FIGURE
2.9
Statistical multiplexing takes advantages of the variations in motion and capacity demands across the channels in a multiplex.
FIGURE
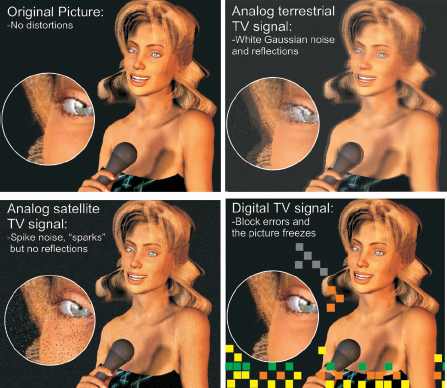
2.11
Digital TV is different from analog TV when it comes to distortions. Either you have a perfect picture or no picture at all. However there is a very narrow range between acceptable reception and loss of signal where you will see blocking effects in the picture.
FIGURE
4.30
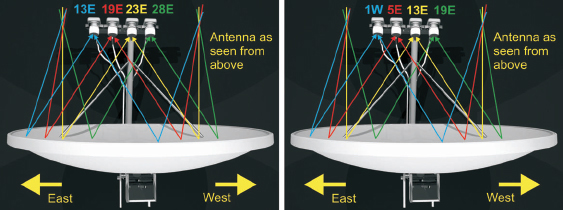
A popular European configuration for four LNBs on one dish (left) and a popular Scandinavian configuration for four LNBs on one dish (right).

FIGURE
4.37
Comparison between the efficiency in the use of the receiving antenna aperture for the multi-focus versus the motorized receiving antenna.
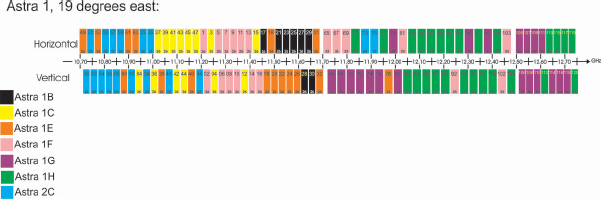
4.53
The frequency plan for Astra at 19 degrees east.
FIGURE
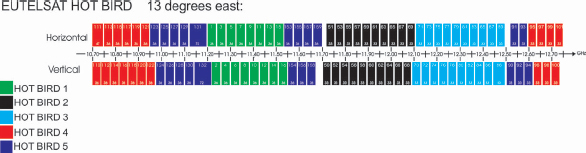
4.54
The frequency plan for Eutelsat HOT BIRD at 13 degrees east.
FIGURE
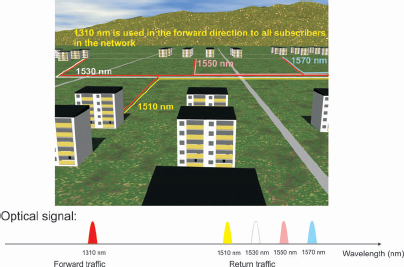
5.10
This HFC network uses different wavelengths for return traffic from different areas in the network.
FIGURE
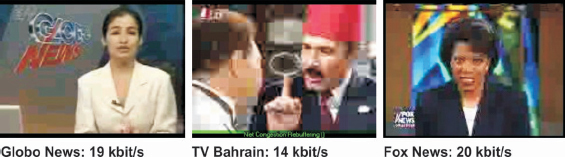
7.5
Screenshots from Internet TV channels; Globo News at a bitrate of 19 kbit/s. Bahrain TV at 14 kbit/s. Fox News at 20 kbit/s.
FIGURE
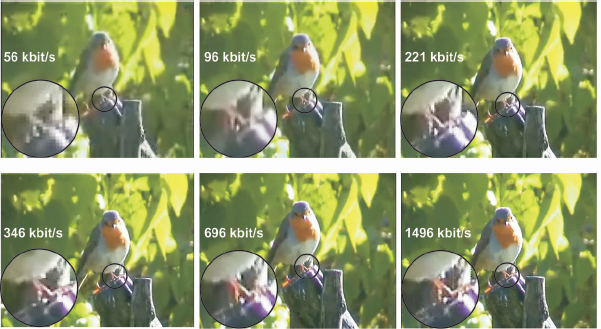
7.7
An example of reception at various bitrates ranging from 56 kbit/s to 1496 kbit/s using Windows Media Player.

FIGURE
9.11
The RF modulated signals from several receivers and video devices can be combined by cascading the RF inputs and outputs.
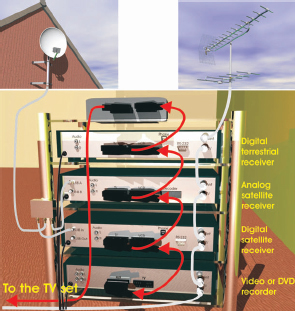
9.15
Several devices may be connected one after another in a scart “chain.” But there are compromises to be made since it is a matter of one-way communication.
FIGURE
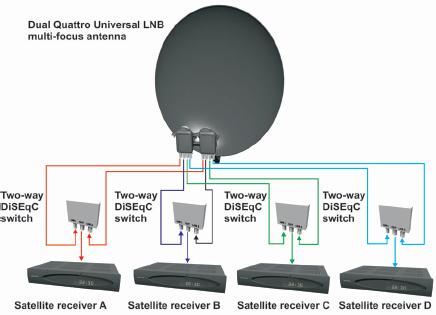
9.26
A dual Quattro LNB multi-focus antenna can supply four separate homes with satellite signals from two orbital positions.

FIGURE
9.28
A four Quattro LNB multi-focus antenna can supply four separate homes or receivers with satellite signals from four orbital positions completely independently.

FIGURE
10.8
If the multi-focus satellite dish has twin LNBs, two sets of DiSEqC switches and is connected to a twin receiver, the same smart card may be able to decrypt two simultaneously received TV signals. One of the signals might be used for instant viewing and the other might be stored on disc for later use.
FIGURE
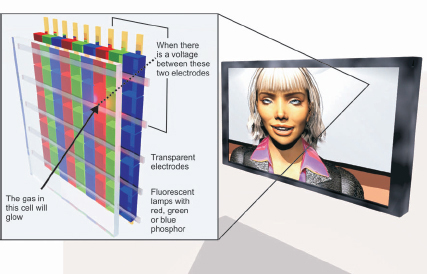
11.3
The technology behind a plasma display.

FIGURE
11.4
The technology behind an LCD display.

FIGURE
11.6
In LCD projectors, there are often three separate LCDs for each color.
FIGURE
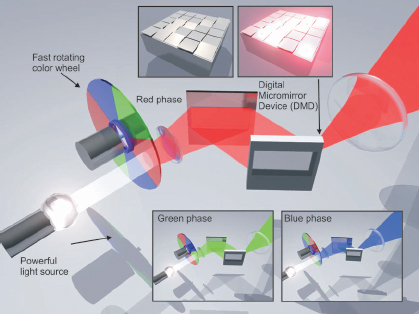
11.7
The DLP is based on a small chip with micro-mirrors. Controlling the angle of the mirrors determines whether a certain pixel will be bright or not.
FIGURE
11.16
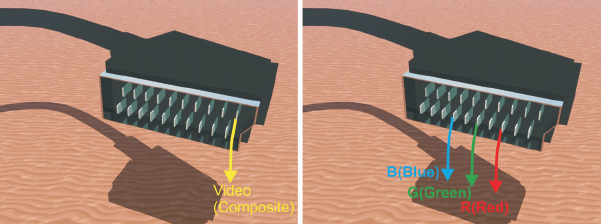
The composite and component RGB signals are available in the scart connector. The RGB signal provides the best picture quality.

FIGURE
12.2
Comparing common screens and resolutions.
FIGURE
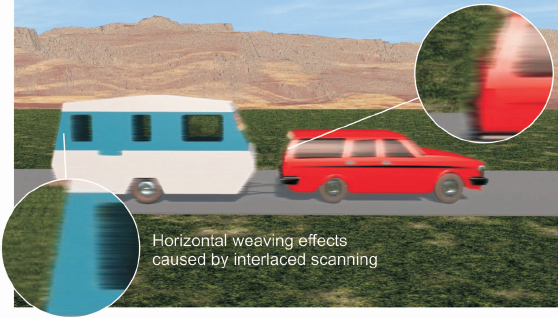
12.3
Fast horizontal movement in interlaced scanned images will cause weaving effects.
FIGURE
12.6
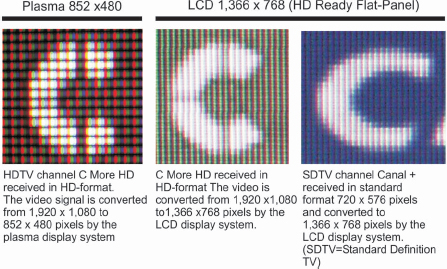
Comparisons at pixel level between different screen resolutions and different signal resolutions (detail screenshots from Scandinavian pay TV operator Canal Digital channels C More HD and Canal+).

FIGURE
12.14
MPEG-2/DVB-S HDTV promotional transmission received from French pay TV operator Canal Plus. Sports events with audience pictures become more believable than ever before. Check the resolution in the enlarged part of the received picture from Canal Plus (Screenshot from Canal Plus, France).
FIGURE
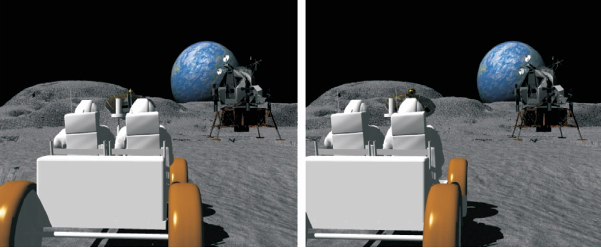
12.17
The stereo pair of picture on top can be experienced as a three dimensional picture if you focus at a distant and then quickly look down in the book without defocusing.
FIGURE
12.20
The first 3D movies used color filters on the projector's cinema audiences.

FIGURE
12.21
The next generation of 3D movies was based on polarization rather than color.

FIGURE
12.24
The future of 3DTV depends on the development of an inexpensive display system that does not require glasses for viewing.

FIGURE
12.26
The future audio and video technologies may give us completely new experiences such as augmented reality.