
Chapter 3
The Wallet Allocation Rule in Action
The more original a discovery, the more obvious it seems afterwards.1
—Arthur Koestler, author and journalist
Linda Wolf, former chair and chief executive officer (CEO) of Leo Burnett Worldwide observed, “Before you can have a share of market, you must have a share of mind.”2 This mind-set drives most companies' marketing budgets. Companies spend hundreds of billions of dollars each year to capture share of customers' minds. In fact, AT&T and Verizon—the two biggest advertisers in the United States—spent $3 billion (approximately $1.5 billion each) in 2013 to attract customers to their brands.3
Of course, the reason for this massive spending is that getting customers to seriously consider using a brand is no easy task. For customers to change their regular buying behaviors, they first must think about why they should. Given the numerous purchases that each of us makes every week, it is completely unrealistic to expect this for most of the things we buy. We would never make it out of the grocery store if we seriously considered the alternatives for everything we put in our shopping carts.
As purchase decisions become routine for most brands, appealing to customers requires a winning strategy. Inside the walls of every company are groups of people trying to figure out how to attract new customers and keep their current customers and also get them to buy more. The anemic growth rates of most companies, however, demonstrate just how hard that is to do.
Grinding a New Set of Lenses
The aim of any strategy is to gain an advantage over competitors, but strategic advantage can be fluid. The history of modern management has shown that competitive advantage can be built slowly over time or captured in a moment as market newcomers leapfrog traditional players.
There are many paths to successful strategy and marketplace differentiation. The one constant is that customers must view the outcome of that strategy as being in their interest if it is going to be successful.
One of the most high-profile examples of failing to convince customers that a company's new strategy is in their best interest is the saga of JCPenney, later rebranded JCP. CEO Ron Johnson inherited an older brand that played competitively in a distinct way: having the right sizes, decent pricing with the option to “stack” coupons, and an everyday feel to the brands it provided. Johnson changed everything about the firm: the brands, the pricing strategy, the brand image, and the store layout.
One of the most disconcerting changes for customers, however, was a switch to “everyday fair pricing.” This meant customers could no longer enjoy the fun of coupon stacking and shopping for that perfect $50 shirt for 90 percent off.
Interestingly, Johnson's pricing plan lowered customers' overall annual spending on average. Still, customers defected in droves, leading to continuous sales losses and store closings. As a result, Johnson's fate was sealed and the former CEO was restored, bringing with him an apology tour and the return of traditional brands and pricing—and customers began to return.
As the JCPenney story demonstrates, the best-laid plans either win or lose in the hearts, minds, and wallets of customers. Therefore, the first step in a winning strategy is to actually think like your customers. This requires seeing the world as they see it.
Although this sounds easy, it most definitely is not. Managers think about their brands constantly. For most brands, however, customers think about them only when they are compelled to think about them. Moreover, when customers do think about your brand, they think about it relative to whatever else they could be doing with their time or money.
The simple rule that managers must never forget is this: No customer knowingly spends his or her money to have an inferior experience. They either believe that this is the best choice for their hard-earned money, or they go elsewhere.
Of course, this is (or should be) obvious. The strange thing is that it is not reflected in how companies typically measure, analyze, or manage the customer experience. What is required is a fundamental shift in how managers view their customer data.
Managers treat their customer metrics as if they existed in a vacuum. Sure, they might benchmark key competitors, but the measures that they actually use to drive and reward improvement are almost always inward looking. For example, companies frequently set target customer satisfaction or Net Promoter Score (NPS) levels for employee bonuses. By contrast, rarely do companies set performance thresholds for being customers' preferred brand in the category.
The Wallet Allocation Rule requires that managers take a customer-centric perspective. It forces managers to consider the rank that each customer assigns to their brands vis-à-vis the competition. In the end, it is all about giving customers fewer reasons to use the competition.
Putting the Wallet Allocation Rule to Work
The scientific evidence that the Wallet Allocation Rule works across cultures and industries is indisputable.4 Most managers, however, are not scientific researchers. As a result, they often are uncomfortable relying on scientific evidence alone. Moreover, scientific research frequently suffers from the problem of dullness combined with mind-numbing statistics. Still, it is the only way to prove that something really works.
The good news is that most managers are willing to accept that the Wallet Allocation Rule strongly links to share of wallet. And it is very easy to prove that the metrics companies are currently using do not.
What is less obvious to managers, however, is how using the Wallet Allocation Rule approach leads to different conclusions. If, in the end, you get the same answer regarding what to do, then why go through the pain of change?
Managers using the Wallet Allocation Rule system do not get the same answers. This is because Wallet Allocation Rule analysis revolves around understanding the key drivers of a brand's relative rank vis-à-vis competition, not the traditional drivers of satisfaction or NPS. It also requires that managers recognize the market barriers that affect customers' ability to buy a preferred brand. (Key driver analysis and market barriers are discussed in more detail in Chapter 5.) When viewing markets from this perspective, it becomes clear what is really driving customers' decisions about where to spend their money.
What follows are examples of Wallet Allocation Rule thinking across different countries and industries. Each case briefly captures the essence of viewing a company and its competitive position using a Wallet Allocation Rule framework. They are designed to be self-contained so that readers can pick and choose those cases most relevant to them.
Credit Unions in the United States
Credit unions serve more than 90 million members in the United States.5 Credit unions differ from other financial institutions in that they are nonprofit, member-owned companies. In general, however, U.S. credit unions offer most of the same core services as their retail banking competitors (e.g., checking, savings, CDs—although they may use different names for these services).
Credit unions typically have much higher satisfaction and NPS levels than their banking competitors. In fact, they have achieved record-high satisfaction levels when compared with all other industries in the United States.6 Despite this, credit unions hold less than 10 percent of U.S. deposits.7
To understand the factors that drive credit union members to use multiple financial institutions, in 2012 we conducted a study with 4,712 credit union depositors.8 The results revealed that more than 65 percent of credit union depositors use one or more competing financial institutions.
As expected, satisfaction and NPS levels were much higher for credit unions than for their bank competitors. Satisfaction and NPS, however, explained only 9 percent of the variation in customers' share of deposits (see Figure 3.1). By contrast, the Wallet Allocation Rule explained 55 percent of variance in members' share of deposit allocations, and 90 percent of the variance at the credit union/bank level (see Figure 3.2).

Figure 3.1 The Relationship of Various Metrics to Members' Share of Deposits

Figure 3.2 The Relationship between the Wallet Allocation Rule and Share of Wallet (at the Financial Institution Level)
Next we conducted a key driver analysis similar to what most financial institutions currently use to uncover the factors that most influenced satisfaction. We also conducted a Wallet Allocation Rule key driver analysis to uncover the factors that most affected how members ranked the various financial institutions they used.
The analysis revealed that the top driver of satisfaction with credit unions was the company's resolution of customer complaints. Of course, this makes complete sense. Issues worthy of complaining clearly lower satisfaction, so fixing problems is bound to have a positive impact on customers' overall satisfaction levels.
But if you really think about it, pouring resources into complaint resolution may not improve a credit union's share of deposits. How many customers actually select a credit union because it is good at resolving their complaints? This probably wasn't a major reason for most customers.
By contrast, the research uncovered that the most important driver of rank (and ultimately share of deposits) was the competitiveness of fees. Low fees are a strong feature of credit unions when compared with banks (see Figure 3.3).
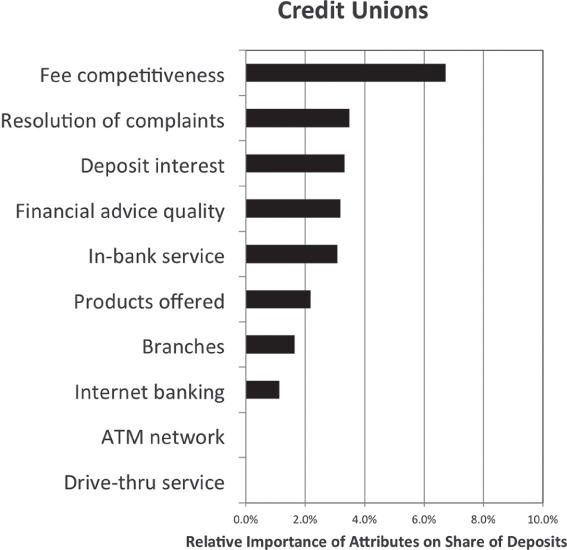
Figure 3.3 Drivers of Share of Deposits for Credit Unions
Despite lower fees, better complaint resolution, and considerably higher overall satisfaction (and NPS) levels, however, the majority of credit union customers also felt the need to use one or more competing financial institutions. A separate analysis reveals why. The most important driver of a competing bank's share among credit union members was Internet banking services. Internet banking is a strong feature of banks compared with credit unions (see Figure 3.4).

Figure 3.4 Drivers of Share of Deposits for Retail Banks by Credit Union Members
This example highlights the need for understanding drivers beyond traditional satisfaction frameworks. The natural takeaway from the traditional analysis of satisfaction is that credit unions need to focus on the in—credit union experience (i.e., complaint resolution). This finding is almost certainly true in the sense that failure on this dimension would lead to lower satisfaction scores, which would ultimately affect the credit union's rank among its competitors. Yet this picture is incomplete. Reducing complaints is unlikely to reduce credit union customers' perceived need to use competing financial institutions.
Even understanding the top driver of rank for credit union customers may offer an incomplete understanding of opportunities for growth. In this case, competitiveness of fees is the top driver of rank for credit unions. So leveraging this advantage further, either through changes in fee structure or emphasis in communication, could increase a credit union's share of deposits.
Credit unions, however, already have much lower fees than banks. In fact, fees are frequently nonexistent. As a result, there is little opportunity for credit unions to reduce fees further—unless they want to pay customers to use their services. The point here is that growth cannot be achieved by credit unions simply doing better on the things that they already do well.
It is only when you look at the drivers of competitors' share within your own customer base that areas of greatest opportunity present themselves. Your customers use other brands for a reason. Commercial banks filled a need for Internet-based banking that credit unions did not meet. This shows that the greatest share can be gained by eliminating your customers' need to use competitors.
So although few industries can approach the level of satisfaction of credit unions, gaining share of deposits requires mitigating banks' advantages in areas important to credit union members. Fortunately, this is doable. And the financial rewards for doing so are worth the effort. Our research finds that for credit union depositors who use more than one financial institution, $25,414 in deposits on average is going to competing institutions.
Quick-Serve Restaurants in Canada
The Canadian quick-serve restaurant (QSR) market is similar to many Western QSR markets: highly competitive with many national chains vying for share along with smaller local outlets. Because of the wide variety of choices, leveraging the important contributors to share of wallet is imperative to business growth.
Many QSR chains deploy NPS or satisfaction-based customer measurement programs that are designed to catalog customer experiences while those memories are fresh. Survey invitations have grown to be ubiquitous mainstays on customer receipts; notices on the receipts point patrons to a website or a phone number. These surveys invariably ask for ratings of performance on food quality, service speed, accessibility, customer service, and employee courtesy and other similar attributes.
These surveys are routinely analyzed to improve both individual location improvements—issues affecting a specific location (e.g., “This location is not always clean, and there's never any parking”)—as well as corporate structural improvements that could affect the firm nationwide (e.g., “No matter where I go, your egg sandwiches are never very good”).
These programs can even zero-in on customers who have painfully bad experiences, calling back low-rated customers to see if the relationship can be restored. There are many colloquial stories about bad in-store experiences where an angry customer is converted to a customer for life when the chief customer officer contacts him to apologize for bad service and offers a small-dollar coupon for a free meal.
Often, results from these programs are relayed back to every store manager for direct, tactical action (e.g., calling back the customer), or broader action (e.g., improving cleanliness at a particular outlet). These programs are invaluable for operational management to focus actions and improve performance in a measurable way.
The flaw in these programs is that the rating system simply does not accurately portend future customer behavior or alert head office management to the factors that are driving share of spend in the marketplace. Therefore, to understand whether or not there is a significant return on their improvement investments, QSRs need to accompany this transactional research with an additional layer that ensures their research is both tactical and strategic.
In an independent 2014 benchmarking study of five national-chain quick serve restaurants, the flaw in using a satisfaction-only measurement approach is clearly revealed.
To demonstrate this point, we conceal the brand names and allow you to focus only on the numbers. Figure 3.5 shows Top-2 box satisfaction scores (a satisfaction rating of 9 or 10 on a 10-point scale) for each brand, which reveals particular areas of strength and weakness.

Figure 3.5 Top-2 Box Satisfaction Levels
Using satisfaction data alone might lead Brand 4 to conclude that it needs to improve its menu range and accessibility. Similarly, Brand 5 might conclude that it has an advantage on convenience and speed and that, with minor improvements, it could become the leader on accessibility.
Traditional key driver analysis outlines the contribution of each of these attributes in explaining customer satisfaction. The higher an impact score, the more important it is in creating customer delight.
Using this traditional analysis, Brand 1 and Brand 5 would conclude that menu range is their most important area of focus; Brand 3 would conclude that it needs to allocate energy equally between environment, convenience, and customer service but less on speed, accessibility, and menu range.
The problem at the outset is that the correlation between satisfaction and share of wallet (i.e., actual business results) is very low. Clearly, a large component of consumer choice is based on factors other than satisfaction, so using satisfaction data to guide performance improvements will lead to higher satisfaction, no doubt, but not necessarily better financial results.
Using Brand 3 as our example, environment, convenience, and customer service are the key drivers of satisfaction. When using the Wallet Allocation Rule approach to understand the drivers of share of wallet, however, a dramatically different picture emerges altogether. The keys to financial success are convenience, customer service, speed, and accessibility (see Figure 3.6).

Figure 3.6 Drivers of Satisfaction and Share of Wallet for Tim Hortons
This makes complete sense when we reveal that Brand 3 is Tim Hortons. For those unaware, Tim Hortons is a ubiquitous fast-service food and coffee chain with 3,588 locations in Canada and is Canada's largest food service operator. To put this in perspective, there is one Tim Hortons location for approximately every 9,700 Canadians. Compare this with one Dunkin' Donuts for approximately every 44,700 Americans, or one Costa Coffee for every 53,800 Britons.
Although known for its coffee and doughnuts, choosing Tim Hortons is often based as much on its convenience and distribution strength as it is the quality of its fare.
Similar to Tim Hortons, all brands experience gaps between what makes customers happy and what keeps them coming back. Certainly in the case of Tim Hortons, a weaker customer service experience could drive overall satisfaction down—losing a competitive ranking position—and force customers to consider alternatives.
In the end, however, driving satisfaction tells only part of the story, and understanding what drives share of wallet ensures that the right measures are making it to the corporate scorecard.
Retail Banking in the United Kingdom
The retail banking market in the United Kingdom, as in many other developed markets globally is characterized by the fact that consumers typically have relationships with multiple providers. Despite this high level of multibanking, however, banking relationships tend to be typified by a high level of inertia. Only 2.8 percent of UK retail banking customers switched their checking accounts (called “current accounts” in the UK) in 2012.
To understand what underpins this inertia, as well as the push-and-pull factors that influence those who do change their banking relationships, we can apply Wallet Allocation Rule analysis to ascertain the influences on customers' choice of provider.
In 2012, we conducted a study among British bank customers with the goal of understanding more about their relationships with providers. The aim of this study was to investigate the stability of the relative position of the major brands in the category.
The largest brand in the market at the time was Lloyds TSB, although it has subsequently been split into two brands as a result of a European Commission legal ruling following UK government intervention in the banking market in 2008; more about this later.
At the time of our research, 44 percent of Lloyds TSB customers named the brand as their sole banking provider. This meant that the remaining majority (56 percent) had multiple checking account relationships with different institutions. Of those having multiple relationships, only a minority (13 percent of all customers) said that they rated Lloyds TSB higher in terms of overall satisfaction than their other providers. Despite its market-leading position, this indicated that Lloyds TSB could not take any of its customer relationships for granted.
Of the 56 percent who have more than a single checking account, more than three out of four rated Lloyds as on-par with competitors or worse. Despite its incredible heritage and market position, losses on possible customer revenue were apparent.
The competitiveness of the market was further evidenced by the proportion of customers who had relationships with competitors of Lloyds TSB, which highlighted the competitive challenge in the marketplace (see Figure 3.7).

Figure 3.7 Other Banks Used as a Percent of Total Lloyds TSB Customers
Given the relatively high likelihood of customers with multiple banking relationships to rate competitive brands at least as good as Lloyds TSB (and in many cases better), Wallet Allocation Rule analysis indicated that the most effective method for improving financial results was to identify performance improvements that would encourage a graduation in satisfaction ranking.
To facilitate this, we used Wallet Allocation Rule key driver analysis to identify the following:
- The areas that have the highest impact on Lloyds TSB customers' share of wallet (defined as the point at which increasing the mean score on an attribute would improve Lloyds TSB's rank compared with competitors)
- The areas that have the highest impact on Lloyds TSB retaining its customers (defined as the point at which increasing the mean score would have an impact but would not improve the bank's rank)
Figure 3.8 shows the relative impact of improving performance for a particular attribute on an individual's rating of Lloyds TSB compared with its competitors. These data are broken down by the impact on share of wallet and retention.

Figure 3.8 Lloyds TSB Branches Are Important for Retention and Share of Wallet, but Improving Fees + Charges and Financial Advice Offer the Greatest Opportunity to Increase Share of Wallet
Across all of the drivers shown in Figure 3.8, the branch network had the greatest overall impact on Lloyds TSB's satisfaction ranking, and this is particularly important for retaining customers. At the time, Lloyds TSB had the most extensive network of branches, and the ability to access a local branch was a key factor influencing its ability to retain customers. This is especially notable because—unlike the United States and many other world markets—UK banks do not charge automated teller machine (ATM) fees for noncustomers. The result is that the impact of ATM networks is low, further highlighting the role of the branch staff and services as core to servicing Lloyd's relationships.
Subsequent events, however, conspired to erode this key competitive advantage. In 2008 the EU Commission forced Lloyds TSB to split, resulting in a reduction of 631 branches, 5 million customers, 8 million accounts, and 8,000 staff. In September 2013, Lloyds TSB was separated into Lloyds Bank and TSB, which reduced the Lloyds Bank branch network by 32 percent.
Until this point, Lloyds TSB had benefited the most in terms of customers' perceptions of the effort required to move accounts and, when quantified, the relative importance of this “barrier to switching” cannot be underestimated (see Figure 3.9).

Figure 3.9 The Impact of Negative and Positive Barriers for Lloyds TSB
Just when the greatest barrier to switching providers was taken away, the second greatest barrier to switching (the convenience of branch location) was similarly eradicated for many customers with the separation of Lloyds and TSB.
To encourage competitiveness in the UK personal checking account market and help overcome the evident inertia among consumers, in September 2013, the UK Payments Council—an organization of financial institutions in the UK that sets strategy for evolution in payment mechanisms—launched a new “switching service” backed by the Current Account Switch Guarantee, designed “to let you switch your current account from one bank or building society to another in a simple, reliable and hassle-free way.”9
Like the establishment of cell phone number portability in the United States, which freed individuals of a tether to a single carrier, this process removed a structural barrier that worked in favor of the most capital-dominant institutions.
The Current Account Switch Guarantee ultimately reduced a switching process that previously could have taken up to six weeks down to one week. Although overall checking account switching levels remained relatively low, checking account switching volumes from January to June 2013 were up 16 percent in the same six-month period in 2014, possibly indicating that as the market calmed down, portable relationships could influence future growth intentions.
Timed well to coincide with this developing market opportunity, Santander launched an added-value checking account product in the UK—the 123 Current Account—which activated a significant “pull” factor and encouraged switching among banking customers. By July 2014, more than 200,000 current account holders had switched to Santander.
Our 2012 analysis of potential challengers for Lloyds TSB identified Santander as one of the greatest challengers to Lloyds TSB's market-leading position (see Figure 3.10). This prediction held in 2014 when Santander improved the attractiveness of its offer. Lloyds Bank suffered a loss of 103,704 customers in the last quarter of 2013—the largest net loss among the leading banks.
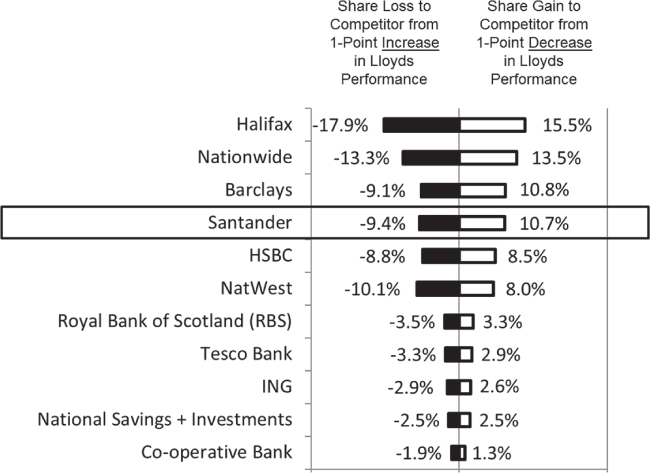
Figure 3.10 Potential Market Impact on Competitors from a Change in Lloyds TSB Performance
Pharmacy Retailing in Chile
The pharmacy market in Chile is highly concentrated, with three main pharmacy chains dominating the market: (1) Farmacias Cruz Verde with 40 percent share, (2) Farmacias Ahumada with 30 percent share, and (3) Salcobrand with 25 percent share. Together they represent approximately 95 percent of pharmacy sales (compared with about 50 percent of pharmacy sales for the top three U.S. drugstores). As a result, 90 percent of the Chilean population shops in one or more of these pharmacy chains.
In 2008, however, the industry suffered a significant blow when it was accused of collusion to elevate prices of high-demand drugs. As a result, the image for the entire industry transformed from one of healing to one of manipulation. This damaged the brand image of each of the big three pharmacy chains.
To understand both the short- and long-term effects of this blow to the industry, we conducted an examination of the market using the Wallet Allocation Rule framework. As a point of comparison, we also measured traditional performance measures to determine their comparative efficacy.
Although penetration of the most powerful firms is extremely high, a market study was still necessary to determine whether customers would penalize the big brands. Conventional research analytics indicated early on that a dire situation was unfolding for the big firms (see Figure 3.11).

Figure 3.11 A Large Percentage of Customers for the Top Three Pharmacies Were Detractors
Based on NPS levels, the top three firms were headed in the wrong direction. By contrast, small local pharmacies (that comprise only 5 percent of the market) were faring much better based on NPS levels. Given these findings, the big firms were believed to be in real trouble with market share loss on the near horizon.
Nonetheless, despite strong evidence that the scandal did, in fact, cause a significant blow to each firm's image, sales for the big three pharmacies remained very good. To understand why there were no serious consequences (in terms of sales), we used the Wallet Allocation Rule approach to determine what was driving the customers' share of wallet allocations. Comparing the drivers of share of wallet with the drivers of NPS, the differences were striking.
The top drivers of share of wallet for each of the top three firms were specific to their unique business models. For example, Cruz Verde's share of wallet is driven by three things: competitive prices, stock availability, and store location. Two of the top three drivers of share of wallet using Wallet Allocation Rule, however, are found to have very little effect using a model explaining NPS (see Figure 3.12).

Figure 3.12 Drivers of Share of Wallet versus Drivers of Net Promoter Score for Cruz Verde
Most of the smaller competitors are out of customers' consideration sets because they cannot meet the store location and stock availability needs offered by Cruz Verde. As a result, the fact that these smaller pharmacies have higher NPS levels is irrelevant. They don't meet the most important criteria driving Cruz Verde's customers' share of spending with pharmacies.
Based on the results of the Wallet Allocation Rule analysis, it is easy to see that the scandal affected the customer satisfaction levels but did so equally across the three biggest competitors. Given this, benchmarking average NPS levels is unlikely to offer useful insight into future share. This occurs in large part because the drivers of NPS do not predict share of wallet. That does not mean that having satisfied customers who are willing to promote the brand is unimportant. However, if the goal is improved customer spending, what matters most are the drivers of share of wallet.
DIY (Do-It-Yourself) Retailing in France
In France, the do-it-yourself (DIY) home improvement market is well established. The market grew 21 percent between 2004 and 2012. Despite the economic crisis that plagued global markets—which led to a flat sector growth rate in 2013—DIY remains the highest expenditure for household equipment, with the average household spending of €800 (approximately $1,000) per year.
These figures attest to the resilience of this sector, largely because 80 percent of the French describe themselves as “committed DIYers” who embrace completing repairs and enhancements to their homes within a controlled budget. The growth of this DIY customer base adds to the already robust core base of construction, carpentry and contract professionals, and handymen in the market.
Specialized retailers began expanding everywhere in France with the emergence of the competitive DIY retail environment in recent years. On average, a French person routinely visits almost three different DIY chains each year. (The equivalent in the United States would be to have eight in 10 adults shopping at three different DIY stores such as Home Depot, Lowe's, and True Value) on a regular basis.
The most-visited French DIY retails are (1) Leroy Merlin, with 37 percent market share; (2) Castorama, with 19 percent market share; (3) Brico Dépôt with 14 percent market share; and (4) Mr. Bricolage, with 12 percent market share. The top four retailers account for 82 percent of the total market, which demonstrates that this is a highly consolidated market.
The high average number of different DIY stores visited by customers, however, clearly shows that they are not held hostage to any particular retailer. Moreover, as each retailer has roughly the same satisfaction score, this is not a meaningful point of differentiation. It should also be noted that the DIY industry does a better job than other retailers in satisfying its customers—overall satisfaction averages in this industry (7.5) exceed the overall retail average (7.1).
When looking at the drivers of satisfaction across these retailers, the story is basically the same for each: Satisfaction is primarily driven by the range of products offered.
Given that each of the major brands is equally satisfying, then this clearly cannot explain the difference in total sales between the brands—certainly not to the level of disparity we see here, where the market share leader, Leroy Merlin, is three times larger than the third largest brand, Brico Dépôt.
When looking at the drivers of share of wallet, however, it becomes clear that each retailer has a distinct aspect of its offer that draws customers (see Figure 3.13).

Figure 3.13 Drivers of Share of Wallet for the Top DIY Retailers in France
In the case of Leroy Merlin, a strong reputation for offering good-quality service differentiates it from its competitors, particularly in terms of advice and support; Leroy Merlin is known for DIY trainings, videos, its documentation center, and an open helpline seven days a week. It is important to note, however, that despite its market leadership, Leroy Merlin's own customers are spending money at competitors as well.
Castorama is winning business based on the convenience of its locations. In this case, Leroy Merlin is unlikely to compete further with Castorama, because building new infrastructure is difficult, time consuming, and expensive. With improvements to customer service, however, Castorama may become a serious threat to Leroy Merlin.
Brico Dépôt is winning by welcoming customers looking for stores designed for savvy DIYers and professionals. It offers a wide range of products at low prices. This competitive strength, however, is offset by weak product availability and the proximity of its stores. This provides an opportunity for both Leroy Merlin and Castorama to win back more of their customers' spending by incorporating Brico Dépôt's current strengths into their own offerings.
Clearly, the competitive landscape is much more dynamic than is apparent by simply looking at the drivers of satisfaction. An understanding of what drives share of wallet indicates that the French DIY market has the potential for disruption should one of the big three retailers focus on minimizing the reasons customers feel compelled to use a competitor.
Grocery Retailing in Mexico
Mexico's supermarket sector has seen enormous change over the past 10 years. The most notable among these changes is that store formats and layouts have been extensively modified as a trend to big-box stores (e.g., hypermarkets, superstores, etc.) took hold.
These new store formats were significantly larger than those of traditional competitors, whose strategy was based in large part on the convenience of their locations. In response to competition, however, traditional grocery retailers updated their offerings to include both superstores and smaller convenience stores within a few years.
In Mexico, four supermarket chains have large market shares: Walmart is the leader both for its geographical coverage and its market share (47 percent), followed by Soriana (18 percent), Comercial Mexicana (10 percent), and Chedraui (9 percent). In 2013, Walmart showed continued growth through the opening of new stores throughout Mexico and Central America; this was accompanied by the rollout of their e-commerce platform in June 2013. Soriana's image was negatively affected by some political issues 2013, but it has managed to remain financially strong. Meanwhile, Comercial Mexicana experienced a major financial crisis in 2013, making its future uncertain. Finally, Chedraui, which began as a southeast regional player, expanded to have a presence throughout much of the country.
In 2014, we conducted a study among Mexican consumers to understand the competitive landscape of these firms along with general consumer behavior. The findings point to a variety of interesting reasons underlying market differentiation and customers' behaviors beyond just store format.
As predicted by the Wallet Allocation Rule, primary observations regarding the relationship between customer satisfaction and market share show that larger grocery retailers have much lower satisfaction than their smaller competitors. This is because the greater a grocery retailer's market penetration, the more mass market it must become to survive. As a result of its diverse customer base, it provides a less pleasant overall experience, which results in lower satisfaction levels.
In addition, despite higher market shares, customers of these larger players tend to purchase their groceries from multiple retailers. For example, despite significant differences in market shares, both Walmart's and Chedraui's customers allocate nearly identical share of their grocery spending to these brands—36 percent and 37 percent, respectively.
As would be expected, the primary driver of share of wallet for Walmart is price. Walmart, however, is already differentiated well on price. As a result, there is likely little potential in focusing even further on reducing prices.
Instead, Walmart needs to address the reasons that its customers feel the need to use the competition. In Mexico, the drivers of competitors' share differ significantly from their U.S. operations. Walmart in Mexico is losing share of customers' wallets due to a lack of available parking and a lack of product breadth. Although parking may seem to be a minor issue, poor parking is preventing customers from making one-off, small-purchase stops. As a result, these customers go instead to smaller convenience stores. Coupled with Walmart's ability to successfully execute add-on sale items (i.e., customers come in for one thing but end up purchasing additional items), it is clear that the parking problem is resulting in a much larger loss of sales than first meets the eye.
Walmart is also giving up share to its hypermarket competitors because it simply is not offering all of the products its customers want. While matching a hypermarket on its breadth of offerings is likely outside the strategic vision of Walmart, increasing the number of grocery items purchased by its customers most certainly is not. Our findings suggest that Walmart should determine the items its customers are buying elsewhere and identify potential new offerings that it can use to increase the size of its customers' shopping basket.
As this investigation clearly shows, the current traditional drivers of a company's business may not necessarily represent the best opportunities for increased share. For Walmart in Mexico, this means that the best opportunity for improved share of wallet comes from understanding what drives customers to use the competition and using that understanding to minimize competitors' advantages.
Retail Banking in Germany
Retail banking in Germany is a mature business, and almost all of the adult population engages in banking. Germany is home to 2,000 chartered banks, 36,000 bank branches, and about 55,000 ATMs, serving about 66 million adult retail customers. Together, these banks manage €3,090 billion (about $4,230 billion) of deposits. Despite regulation, competition among banks is intense, and managing margins is frequently a challenge.
On top of the existing level of competition, population growth in Germany has leveled off. The need to fight for more market share—without a growing potential customer base for new customers—means growth can be achieved only by stealing away customers from competitors or by garnering a greater share of wallet from existing customers.
There are “three pillars” of German banking: savings banks (Sparkassen), cooperative banks (Volksbanken and Raiffeisenbanken), and private banks. After the 2008 financial crisis, the Economist observed, “Two of the pillars—the 423 savings banks and 1,116 cooperative banks—have come through the crisis with barely a scratch so far.”10
Although the assessment of the Economist is correct in terms of the bad loan problems that plagued other financial institutions during the financial crisis, the competitive reality for German savings banks and cooperative banks is not as positive as portrayed.
Savings and cooperative banks combined manage a vast, but declining network of 25,000 branches across the country. It is important to note that for the most part, these institutions are not competing with one another. Most savings and cooperative banks focus on their region; regional savings banks do not compete with other regional savings banks, and cooperative banks typically do not compete with each other across demarcation lines.
Over the past 15 years, direct banks (i.e., Internet banks) have acquired 13 million customers, many of which are still customers of their local savings or cooperative bank. Today, one-third of savings bank customers have a relationship with at least one other bank—for the most part, with a direct bank or with small-footprint consumer finance specialists.
In terms of customer satisfaction, savings and cooperative banks rank at the top among German financial institutions. Nonetheless, despite their higher satisfaction ratings, they are losing pieces of their customers' business to new direct banking competitors.
On the one hand, customers choose savings and cooperative banks in large part because of their convenient branch locations, excellent traditional banking services, and multichannel access to accounts. On the other hand, the drivers of share of wallet for their Internet competitors are top-of-class products and services (for those solutions that they offer) and flawless account management.
Direct banks have recognized that to gain a greater share of customers' wallets, they must work to overcome some of the competitive strengths of savings and cooperative banks. To do this, direct banks expanded their offerings beyond short-tenure high-turnover products (consumer finance, investment accounts, and payments) to include banking products such as primary checking accounts, savings accounts and mortgages, which are the “home turf” of savings and cooperative banks.
Clearly, savings and cooperative banks must work to maintain an advantage in these core banking services. For savings and cooperative banks to gain greater share of wallet with their customers, they must address the reasons their customers are using these direct bank competitors. This means providing state-of-the-art online banking, bill pay, fund transfer, and flawless execution. Of course, this is all easier said than done, even for some of the world's most established financial institutions, because superior delivery means dovetailing services across in-branch and online channels.
The good news for savings and cooperative banks is that there are currently three important market barriers that limit the appeal of direct banks. These result in direct banks receiving relatively low share of wallet levels (around 30 percent), and fewer customers describing it as their “main bank.”
First, direct banks do not offer the breadth of services required to be considered an all-in-one institution. This shortcoming prevents between 10 and 15 percent of their customers from doing more business with their direct bank.
Second, approximately 25 percent of customers say that having no branch nearby is a reason to limit bringing in additional business to their direct bank. Of course, as broader acceptance of all-remote banking becomes the norm, this barrier is expected to become less important.
Third, more than 20 percent of direct bank customers hold back portions of their money because there are simply not enough ATMs. Cash is still a critical payment instrument in Germany; even if people don't pull out cash, they want to know they could access it if needed. Here too, however, recent changes may be bringing down this barrier. In cooperation with Visa, the largest direct banks have been offering free cash withdrawal from all Visa-branded ATMs.
The competitive realities of the German banking market highlight the problem of a simple reliance on customer satisfaction. Customers can be very satisfied but still give away pieces of their business to competitors. Addressing this requires an understanding of the drivers of share of wallet for both your firm and the competitors your customers also use.
It also shows that mature markets—such as the German retail banking market—are not immune from shifts in share. Clearly, this market is still evolving. Branch bank groups seek to monetize their huge infrastructure investments, while direct banks seek to overcome barriers by taking novel approaches. Even decades after the emergence of the Internet, it has forced established industries such as the German retail banking sector to continue to innovate in the competition for share of wallet.
Grocery Retailing in Brazil
The grocery retail industry in Brazil is a mixture of large national or international chains that compete with many small, localized chains, as well as one or two outlet shops. Because of their size, the largest supermarkets are able to serve broader customer needs than just grocery shopping. For example, in addition to groceries, larger retailers may also offer services such as pharmacy, tobacco shop, lottery, gasoline, bill-pay stations for utilities, and mobile phone payment.
As a result, large chains such as Extra, Carrefour Hyper, Walmart, and Dia represent formidable challengers to smaller grocery retailers such as Cooperative de Consumo (known as Coop). Coop has 28 stores in 10 cities around São Paulo in Brazil. It has more than 1.5 million “cooperative members” (who receive special discounts and other benefits from being part of a consumer cooperative).
Relative to other, larger grocery retailers, Coop receives high customer satisfaction ratings. The problem, however, is that high satisfaction does not translate into high behavioral loyalty among its customers. Coop's customers overwhelmingly divide their grocery spending among multiple grocery retailers. In fact, 77 percent of Coop's customers use at least one other grocer, and 40 percent shop at two or more competitors. The end result of this divided loyalty is that 45 percent of every Coop customer's spending on groceries goes to a competitor.
An examination of the drivers of Coop's satisfaction revealed that the top four drivers of satisfaction are price, the pharmacy (every Coop store has one), the variety and quality of items, and the membership in the Coop. Of course, price is often one of the most important drivers of satisfaction. Moreover, there is no doubt that if Coop could significantly drop prices, price-sensitive customers would buy more from Coop. As a small cooperative grocery retailer, however, Coop has little room for additional price concessions.
When we use the Wallet Allocation Rule approach to determine precisely why customers feel the need to use competitors (i.e., what drives share of wallet), the most important reason turns out to be the ambience and cleanliness of the stores (specifically the store layout and hygiene). This issue does not even make it into the top six drivers of satisfaction!
Given the results of the Wallet Allocation Rule analysis, it is clear that Coop has real opportunities to win a greater share of its customers' business. But a misguided focus on satisfaction alone would not provide the necessary insight into how to grow share of wallet. Of course, satisfaction is clearly important. For Coop, however, the best opportunity to improve satisfaction—offering even lower prices—is expensive, and it is unclear whether increases in sales with lowered prices will offset the loss of margins. Instead, Coop has an opportunity to improve its customer spending levels by enhancing something completely under its control without having to reduce prices further: how its stores look and feel to customers.
Retail Banking in China
The retail banking market in China is composed of various types of commercial banks, including state-owned banks, joint-equity banks, city banks, rural banks, and foreign banks. The market leadership position of the country's five state-owned banks has come under serious threat from competitors. This is occurring during a period of change in a number of market conditions: interest rate liberalization, a slowdown in national economic growth, a softening of profit margins, and aggressive expansion of service-oriented foreign banks.
In China, it is difficult to discern clearly where customers are depositing their money and why. With such a significant unknown, customer relationship management (CRM) has become increasingly important to banks' competitive strategies aimed at attracting customers' deposits and investments.
The glitch with most CRM approaches, however, is that they fail to focus on the correct key performance indicator (KPI). As a result, it is difficult, if not impossible, to achieve real financial success. By and large, traditional approaches focus on satisfaction and miss the main goal of the entire effort: to reap greater share of wallet.
To gain an understanding of what's driving customers' decisions, we undertook a study of retail banks in China. The major banks investigated included China Merchants Bank (CMB, a joint-equity bank) and five state-owned banks: Bank of Communications (BANKCOMM), Bank of China (BOC), Agricultural Bank of China (ABC), Industrial and Commercial Bank of China (ICBC), and China Construction Bank (CCB).
Using a traditional CRM perspective, ICBC is significantly underperforming relative to its competitors because it has the second-lowest average satisfaction level among the major banking players. In terms of market performance, however, ICBC has the highest share of wallet levels of any of the major banks.
It is clear that satisfaction is a poor predictor of share of wallet in the Chinese retail banking sector. Figure 3.14 clearly shows the weak relationship between satisfaction and share of wallet for the largest banks in China. The correlation is a miniscule 0.052 when looking at all banks investigated. In layperson's terms, this means that in excess of 99 percent of the variation in share of wallet is completely unexplained by knowing customer satisfaction levels. By contrast, using the Wallet Allocation Rule results in an extremely strong correlation of 0.924 (the maximum possible is 1.0).

Figure 3.14 The Relationship between Satisfaction, the Wallet Allocation Rule, and Share of Wallet for the Largest Banks in China
The even more serious issue is that focusing on what drives satisfaction will most likely fail to deliver improved share of wallet. Figure 3.15 shows how the drivers of satisfaction differ significantly from the drivers of share of wallet for banks in China.

Figure 3.15 A Comparison of the Drivers of Satisfaction and the Drivers of Share of Wallet for the Largest Banks in China
Examining the stark difference in results between these approaches reveals how misleading this can be for many banks. BANKCOMM, for example, has three important drivers of share of wallet; two of these drivers in a satisfaction-based approach, however, are the weakest drivers of customer satisfaction (website and convenience across channels). As a result, a satisfaction-based CRM approach would have BANKCOMM focusing on financial advice (a weak share of wallet driver) just as much as customer service (a strong share of wallet driver). This same approach would highlight the website as inconsequential when it is, in fact, the bank's leading driver of share of wallet!
These problems are not isolated to BANKCOMM. The majority of major banks would fail to identify their top three drivers of share of wallet by focusing on satisfaction instead of share. In the case of ABC, on the one hand, its top driver of share of wallet is its sixth-strongest satisfaction driver. On the other hand, its top satisfaction drivers (convenience and range of products and services) are its weakest wallet share drivers. CMB's top share driver is its fifth-strongest satisfaction driver, while one of its strongest satisfaction drivers (financial advice) is among its weakest drivers of share of wallet.
It is obvious that the conventional approach of creating strategy based on absolute customer satisfaction has severe limitations if the ultimate goal is to gain a greater share of customers' banking business. Throughout the China market, the conventional analyses would have wasted time and resources for banks seeking to compete in a market with vast potential and increasing competition. Instead, the Wallet Allocation Rule focuses on what drives customers' share of wallet decisions.
Business Banking in Thailand
Arrow Bank* is a medium-size bank in Thailand with good brand awareness and a long history (established more than 60 years ago). In terms of size, however, it lags significantly behind the top three market leaders. Nonetheless, in addition to individual consumers, Arrow has been able to build a successful business with small and medium enterprises (SMEs) in Thailand. This represents an important customer segment for Arrow, because there are more than 3 million SMEs in Thailand, representing 37 percent of the country's gross domestic product.
Arrow's SME customers are very satisfied with their bank. In fact, the SME unit within Arrow has a world-class NPS of 63 (66 percent of its SME customers are promoters, and only 3 percent are detractors). The top four drivers of Arrow's NPS levels are as follows:
- Attractive bank fees
- Offering a variety of SME banking products
- Easy loan approval process
- Staff who can answer questions about the bank's products and services
Given these very high scores, it would be easy to conclude that there is little upside potential. After all, 66 percent of customers are classified as loyal using the NPS classification system.
That conclusion, however, would be far from correct. Arrow has a high percentage of customers who also use competing financial institutions. Worse still, despite high NPS levels, only 38 percent of its SME customers view Arrow as being better than the competition. Twenty percent of SME customers view Arrow as equal to competitors, and the remaining 40 percent see it as worse than the competition.
As a result, Arrow bank captures only 44 percent of its SME customers' share of wallet. Moreover, the average number of banks used by Arrow's SME customers is three.
Arrow Bank's SME customers clearly believe that they need to do business with other financial institutions. Why? An analysis of the Wallet Allocation Rule drivers of share of wallet for SME customers reveals a very different set of drivers:
- Market coverage/accessibility
- Overall brand image
- Branch service quality
- Easy loan approval process
Given the relatively low share of wallet and high number of competing banks used, there is a great deal of opportunity for Arrow Bank to grow business with its SME customers. However, this will not happen with a simple focus on the drivers of NPS.
The results of the Wallet Allocation Rule analysis revealed that the most important reason that customers do not do more business with Arrow Bank is that it lacks the market coverage of larger institutions. In other words, bigger banks have a bigger footprint (e.g., more branches, bigger ATM networks, etc.), which makes access to banking services much more convenient.
Clearly, Arrow Bank cannot go on a building spree and begin constructing numerous new branches around Thailand if it wants to remain financially strong. Knowing that physical capital is difficult to overcome, however, Arrow Bank should consider adding a few smaller, well-located branches or potentially even microbranches in high-traffic areas. It should also consider ways to use technology to make many of its banking services less location sensitive.
In addition, Arrow needs to actively promote itself as a bank that caters to the needs of small and medium enterprises. Its reputation currently centers on its strength as a consumer bank. Clearly, however, Arrow can provide outstanding service both to individuals and to SMEs.
For Arrow Bank, high NPS scores did not translate into high share of wallet levels, because what makes SME customers happy with Arrow Bank does not at the same time minimize their need to use competing financial institutions. That can be uncovered only by understanding what drives share of wallet.
Retail Banking in South Africa
South Africa enjoys one of the most sophisticated banking industries in the world. Both the retail and corporate services of South African banks compare favorably with the many Western banks, such as Citibank, HSBC, Barclays, ING Bank, Deutsche Bank, ABN Amro, operating in the country.
As with any highly competitive market, however, tough competition has made market saturation a real possibility. The four or five largest banks, as well as a number of new market entrants, have been forced to alter their business models and accept new thinking regarding their services. In particular, banks have been forced to make their services more affordable to attract those without bank accounts (referred to as the “unbanked”) given market saturation, which has put downward pressure on margins.
The combination of competitive intensity with a new to banking customer base makes brand positioning critical to success. Moreover, as South African retail banking customers typically use a small number of institutions for their financial needs, it is important that financial institutions have messaging that both stands out and appeals to the majority of consumers.
To address this need, Surety Bank† conducted a study of South African banking customers to gain insight in the drivers of their banking attitudes and behaviors. Upon completing the study, however, they were less than thrilled with the findings. The overwhelming number one driver of satisfaction with a financial institution was trust. The rest of the drivers were weak and undifferentiated.
The problem with this finding is that managers at Surety Bank recognized this one simple fact: No one puts their money in a bank that they do not trust. Furthermore, as South Africa is a very sophisticated banking market, virtually all of the major banks in the market meet this standard.
To gain a better understanding of what drives “share of mind,” Surety Bank applied the Wallet Allocation Rule to analyze its brand image attributes with the South African banking market in much the same way as it would use the rule to gauge the drivers of share of deposits for its banking customers. On one level, the Wallet Allocation Rule analysis confirmed the initial findings, revealing that the most important factor was still trust. But the second most important driver was simplicity—specifically, that the bank made it simple for customers to use and understand its services. In addition, they wanted a bank that was involved in their communities.
These issues made perfect sense, particularly given the large new to banking segment of the population. More important for Surety Bank executives, it pointed the bank to the key elements of its messaging to prospective customers.
Clearly, Surety Bank has many other opportunities to improve the share of deposits it receives from its customers. Only by first defining a clear and attractive brand positioning, however, would it be given the chance. To grow share of wallet with customers, Surety Bank first had to attract them.
Retail Banking in Turkey
The retail banking sector in Turkey is a changing landscape that faced difficulty during the economic crises of the late 2000s and early 2010s. The dominant institutions in the Turkish banking sector are composed primarily of private and state-owned public banks.
The five largest banks are a mix of both private and public banks: Türkiye I![]() Bankasi (I
Bankasi (I![]() Bank), Yapi ve Kredi Bankasi (Yapi Kredi), Garanti Bank, Akbank, and Ziraat Bank. Together, they have combined assets greater than the remainder of the Turkish banking market. As a result, most of the market competition is not between these top five and the remainder of the market. Rather, the toughest competition is between the top five banks as they fight to win share from one another.
Bank), Yapi ve Kredi Bankasi (Yapi Kredi), Garanti Bank, Akbank, and Ziraat Bank. Together, they have combined assets greater than the remainder of the Turkish banking market. As a result, most of the market competition is not between these top five and the remainder of the market. Rather, the toughest competition is between the top five banks as they fight to win share from one another.
In such a competitive environment, managers anywhere in the world would be expected to readily embrace approaches they believe can provide them with a competitive advantage. Turkish banks are no different and have whole-heartedly accepted satisfaction and NPS systems into their marketing and development functions.
I![]() Bank (formerly a national bank) is the largest bank in terms of assets in the country. Of the top banks, it has the highest satisfaction ratings, has the highest NPS levels, and is tied for the highest average share of wallet among all its competitors.
Bank (formerly a national bank) is the largest bank in terms of assets in the country. Of the top banks, it has the highest satisfaction ratings, has the highest NPS levels, and is tied for the highest average share of wallet among all its competitors.
At the same time, Garanti Bank—the third-largest bank in terms of assets in the country—is also tied for highest average share of wallet. It, however, has the lowest satisfaction and NPS scores of the top five banks (see Figure 3.16).

Figure 3.16 The Relationship between Satisfaction, Net Promoter Score (NPS), and Share of Wallet for Banks in Turkey
As this example clearly demonstrates, high satisfaction and NPS levels are no guarantee of high share of wallet. Of course, this is not to suggest that focusing on creating satisfied customers willing to recommend the brand is unimportant. It most definitely is. But it is not necessarily a good guide for improving share of wallet. In fact, our research finds that not only are the drivers of share of wallet and the drivers of satisfaction different but the drivers of wallet share also differ significantly from bank to bank (see Figure 3.17).

Figure 3.17 A Comparison of the Drivers of Satisfaction and the Drivers of Share of Wallet for the Largest Banks in Turkey
The drivers of share of wallet for I![]() Bank are focused on multichannel convenience (tied for fifth as a driver of satisfaction), customer service (the top satisfaction driver), and website utility (the fourth-highest satisfaction driver). Equally important for I
Bank are focused on multichannel convenience (tied for fifth as a driver of satisfaction), customer service (the top satisfaction driver), and website utility (the fourth-highest satisfaction driver). Equally important for I![]() Bank is that efforts to drive satisfaction would be largely split across six drivers, but to drive share the focus would be limited to the three described earlier.
Bank is that efforts to drive satisfaction would be largely split across six drivers, but to drive share the focus would be limited to the three described earlier.
For Garanti Bank, despite having relatively lower satisfaction levels, the bank shares the top spot for highest average share of wallet. This is largely driven by its loyalty reward schemes and the convenience of its locations. Its products, however, are the most powerful drivers of satisfaction.
Ziraat Bank reflects the most dramatic case of satisfaction drivers differing from share of wallet drivers amongst Turkey's largest banks. If Ziraat Bank were to follow a model solely based on driving satisfaction, it would see virtually no financial gain. Ziraat's top driver of satisfaction has a 0 percent impact on driving share of wallet. Similarly, its top driver of wallet share (customer service) would likely have been ignored altogether as it represents the fifth strongest satisfaction driver.
In the case of Akbank, a satisfaction model would have served the bank reasonably well—three of the top four share drivers were also top satisfaction drivers. The top driver of share of wallet (multichannel convenience), however, was last in explaining satisfaction and would have likely been ignored altogether. Similarly, a greater focus would have been placed on financial advice to improve satisfaction despite this attribute having only a 1 percent impact on explaining share of wallet.
Finally, a satisfaction based model for Yapi Kredi would require a focus on four things: customer service, multichannel convenience, products and services, and accurate statements. Only two attributes, however, explain most of customers' share of wallet behavior among Yapi Kredi customers: convenience (a top satisfaction driver) and financial advice (the median satisfaction driver).
In terms of driving share of wallet across the market, the landscape is dotted with many opportunities to grow wallet share that will not be visible in models focusing solely on improved customer satisfaction scores. Convenience is a strong share driver for each of the top five institutions, but it drives satisfaction for only one (Yapi Kredi). Strong website utility is a modest to weak satisfaction driver for each of the top five, but it is a strong wallet share driver for all except Yapi Kredi. Products and services are a universal driver of satisfaction but drive share only for Akbank. Banks that create satisfied customers through things such as financial advice (Ziraat) aren't necessarily the ones benefitting financially from them (Yapi Kredi).
As a result, bank managers in Turkey need to clearly understand what really drives wallet share and what drives only satisfaction. Although both are important, only one drives growth.
Retail Banking in MENA (Middle East and North Africa)
The Gulf Region within Middle East and North Africa (MENA) is widely seen as the region's financial center. It is ranked as one of the wealthiest sectors worldwide. Since 2010, an upswing in the sector has led to increased investments aimed at improving bank offerings, bringing them into closer alignment with those in more developed markets.
This has ultimately resulted in the financial services market becoming one of the most competitive in the entire MENA region. With increased investment comes pressure to succeed in a competitive landscape because capital-liquid investors want to see a return on investment from the managers running the institutions in which they invest.
As managers face increased responsibility, measurement systems have become crucial barometers for performance. Many competitive measurement systems are emblemized by scorecards that contain topline financial information alongside customer metrics such as the NPS.
Over the past half-decade, many scorecard systems in the region have come to rely on NPS systems aimed at enhancing the customer experience. Wanting to examine the attributes critical to driving customer recommendation behavior, bank managers have honed in on eight measures they believe to be important (see Figure 3.18).

Figure 3.18 Drivers of Share of Wallet versus Drivers of NPS
Touch points (i.e., interactions between the customer and the bank) are typically determined to be the most important driver of NPS. In fact, it has more than double the impact of bank products and services on NPS. Therefore, if the goal is improved NPS, it is clear where managers must focus their resources and energy.
Bank managers are finding, however, that improved NPS scores are not resulting in the financial returns that they expected. Our research revealed that the focus on touch points is unlikely to result in customers allocating a greater share of their business to banks in MENA. Touch points deliver customer satisfaction, but products deliver share of wallet.
In fact, not only would selecting improvement opportunities based on the drivers of NPS fail to deliver financial results, our research finds that for banks in the Gulf region, there is actually a negative correlation between drivers of recommendation and the drivers of share of wallet.
The overwhelming top driver of share wallet ranks last among elements that drive customers' likelihood to recommend. Therefore, bank managers in the Gulf region who make changes to improve NPS without understanding the competitive landscape may see two unwanted outcomes: (1) failure to grow their customers' share of wallet and (2) having the happiest but least financially rewarding customers the market has to offer.
Conclusion
As these stories from around the world make clear, a misguided pursuit of satisfaction and NPS is unlikely to result in improved financial performance. This should not be taken to mean that satisfaction is not important. To be crystal clear, measuring, modeling, and managing customer satisfaction is more important than ever.
But if the goal is improved share of wallet, then traditional satisfaction and NPS approaches won't cut it. These measures must be put in context of the real-world choices that customers make each and every day. This is best done by applying the Wallet Allocation Rule framework and using it to identify what really drives customers' decisions to allocate more (or less) of their wallets to the brands they use.