
Confidence calibration
In Chapter one, we talked about the importance of qualifying (and calibrating) the confidence levels of our beliefs.
To begin with, our beliefs should be inherently uncertain. But this is not how we typically form opinions. Instead, when we are convinced of something, we instinctively attach a 100% confidence level to it. Expressing beliefs in probabilities needs to be practised. It is not what we do automatically.
Once it has become a habit to express your beliefs in probabilities, you should calibrate your belief system so that your probabilities are reliable and useful. But how do you go about calibrating your beliefs in a systematic fashion? Essentially, you will need to give answers to a number of questions and provide your subjective confidence level for each.
A sample question could be: “How many countries are members of the United Nations? Provide the range at a confidence level of 90%.” An answer to that question consists of an upper and lower boundary of that number. And 90% confidence means that if you were to repeat a question similar to this one, the true number would only be outside of the range that you specified once every 10 times. The Center for Applied Rationality (CFAR) has come up with an online Credence Calibration Game that comprises many questions like the ones above and allows you to measure your confidence.83
Another way is to start a long list of your own predictions. How sure are you that something will happen within a given time period, say one year? Write down what you expect will have happened at the end of the year. Do this exercise in the weeks around New Year’s Eve. Of course, you could also choose a smaller unit of time, such as a project, holiday or some other time interval. As you note down your projections, make sure they are binary – they can be answered with true or false, or simply yes or no. In addition, note down how confident you are.
| BELIEF | HOW CONFIDENT? |
| No new competitor will enter our market | 80% |
| President X will not be impeached | 90% |
| The value of our house will rise by more than 5% | 60% |
Do this for a large number of beliefs, say 50 to 100, and make sure you have plenty of predictions for each confidence level (i.e. at least 5 for the confidence level 80%).
At the end of the year, you can revisit your beliefs and mark if they were true or not. Simply add a column to your table to indicate whether or not the prediction was correct or incorrect.
| BELIEF | HOW CONFIDENT? | DID IT COME TRUE? |
| No new competitor will enter our market | 80% | Yes, the competitive set is unchanged |
| President X will not be impeached | 90% | Yes, President X is still in office |
| The value of our house will rise by more than 5% | 60% | No, the price of our house went up only 3% |
After noting down how the individual predictions turned out, plotting confidence levels on a graph will allow you to identify where you’ve been over or underconfident.
Start with an empty graph similar to the one below.
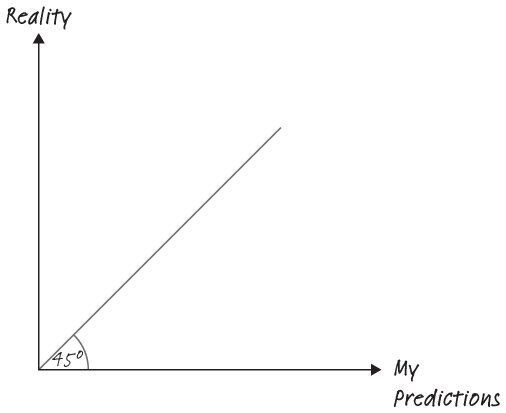
This chart will allow you to represent your predictions in a visual way and compare them against reality.
Aggregate all your predictions into ‘buckets’ of confidence. Start with the 50% bucket (predictions you were as confident about as a coin toss). How many of those predictions have come true? Enter that percentage as a percentage of all predictions on the y-axis.
Then continue with the next bucket of predictions, the ones where you indicated a confidence level of 60%. Proceed in a similar fashion. Take a look at all your predictions or beliefs that you are 60% confident about and calculate the percentage of those predictions [actually] matching reality. Find that point on the plot and mark it.
Continue with the rest of the confidence levels: 70%, 80%, 90% and 100% (completely sure that something will happen or something is true).
Connect the dots on your graph and compare them with the optimal 45-degree line. Whenever a dot is below the 45-degree line, you are overconfident at that confidence level. A dot below the 45-degree line means you were more confident than warranted. Whenever it is above the line, you are underconfident.

Repeat this exercise frequently to keep your beliefs about the world well-calibrated and challenge overconfidence.
You can use this method not only to hold yourself accountable, but also to do the same with experts and pundits. Compare their prediction with what turned out to be true.84
By the way, here is Simon’s graph of predictions made for the year 2017.
