
See the big picture
Practise systems thinking
Remember, always, that everything you know, and everything everyone knows, is only a model. Get your model out there where it can be viewed. Invite others to challenge your assumptions and add their own.
Donella H. Meadows
BENEFITS OF THIS MENTAL TACTIC
This mental tactic helps you spot, analyse and shape systems. It’s applicable wherever systems are at play. It is useful in four general ways:
- It lets you understand the causal influences of a problem, especially if it appears sticky and hard to overcome.
- It allows you to identify feedback loops that either grow, balance, or even destroy a system.
- It helps you find the most effective leverage points at which to influence a system.
- It’s a visual language that helps with thinking and communicating.
This mental tactic can help with planning a logistics chain and modelling the aggregated behaviour of suppliers. It can inform governments designing new traffic rules for highways or social policy changes. Or it can support entrepreneurs launching two-sided marketplaces, in which the attractiveness to one side of the market increases with the number of users on the other.
Systems thinking helps open the box and illuminate cause-and-effect relationships among a system’s multiple parts. It allows us to map out the inner workings using pen and paper, or simulate their behaviour using modelling software. Systems thinking can be the key to understanding deeply ingrained patterns and dynamics and can be used to model how trends emerge, products spread and diseases transmit.
But systems thinking is not only a diagnostic tool: it also reveals possible points for intervening in a system. Use this mental tactic both to design new systems, detect faulty ones and learn ways to correct them.
PRACTISE SYSTEMS THINKING
Political parties, companies, non-profits, working groups and entire societies are systems – networks of agents, connected by links between them. A system is a network that is more than just a collection of its parts.
As with biological systems, it is hard to predict how complex human systems will behave. That’s because systems comprise multiple elements that are interdependent. They are connected to one another and interact in complicated ways that produce their own patterns of behaviour over time. This has important implications for anyone seeking to address problematic systems behaviour. Here are some examples:
- Interest-rate manipulation doesn’t, in itself, boost employment, stabilise prices and foster long-term growth. Rather, it interacts with the economic system. And that system includes many additional elements besides interest rates, such as consumption patterns, policy changes, international trade, environmental influences and rate of technological change.
- Oil-exporting countries are not solely responsible for oil-price hikes. That action alone isn’t sufficient to trigger spikes in oil prices around the globe. Global oil price also depends on the policies and consumption behaviours of oil-importing nations.48
- Drug addiction doesn’t stem only from the failings or poor decisions of individual addicts. Causes also include forces in the large social system, such as the wider availability of drugs and the conditions that raise demand for drugs, including poverty and over-prescription from doctors.
FEEDBACK LOOPS
Much of a system’s peculiar behaviour is driven by what are called feedback loops. By understanding feedback loops, we can understand why some processes seem to spiral out of control, while others stabilise. Over the following pages, we will dig deeper into the nature of feedback loops and introduce a language to map and solve them effectively: causal loop diagrams. By understanding relationships in a systems-thinking way, we can identify better interventions to address problematic system behaviours.
The reinforcing feedback loop
Feedback loops are the cornerstone of thinking in systems. They are chains of cause and effect, in which the previous effect represents the next cause. Hence, they are closed loops, unlike open loops where the last effect doesn’t feed back into the system. The following visual example shows the first of the two general types of loops: the reinforcing feedback loop.

Reinforcing loops explain compounding interest: the higher the amount of savings in a bank account, the higher the interest earned, which in turn increases the total amount, earning even more interest. The results of exponential growth can often be astonishing: assuming a 5% interest rate, $100 grows to $13,150 in 100 years.49
Reinforcing feedback loops could also result in the opposite behaviour: rapid decline. Take, for example, the behaviour of the supervisor reacting to the performance of his employee. This feedback loop could go both ways. Praise and compliments could lead to enhanced motivation and increase in the performance, which again lead to positive reactions from the supervisor (and so on). But the opposite is also true: scold and chastisement could lead to further de-motivation of the employee, leading to a drop in performance.

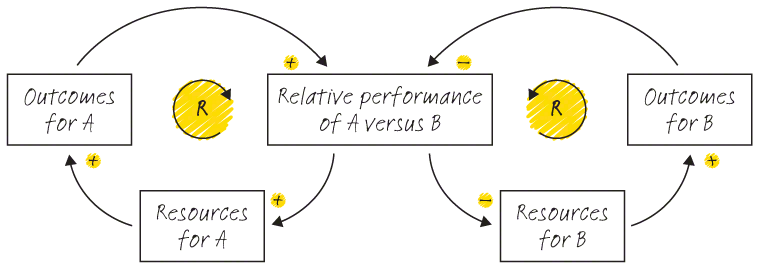
Feedback loops can also help explain the concept of a self-fulfilling prophecy, namely a forecast that causes itself to come true.
Let’s take the situation above, but with two employees, A and B.50 Both are on a similar path to promotion in a month and are similar in terms of seniority, ability and track record. You are the manager and can only promote one. So you set out to use the upcoming month as a way to decide between both of them. A family emergency strikes A and requires him to work from home for the first week. It’s an unavoidable consequence that you interact more frequently with B over the first week, implicitly providing more resources (attention, responsiveness, clues) to B than A. Given your busy time schedule, even after the return of A a week later, you subconsciously continue to provide more resources to B. After all, B has already done an outstanding job at the task you assigned her, you simply don’t feel you need to invest in A.
After the end of the month-long trial period, you promote B, who has clearly done a better job. But was the competition actually fair, and was B the right person to promote? Looking at the system diagram, it becomes clear that the outcome is very sensitive to initial conditions. In this example, favour will quickly swing towards B. B will enjoy more resources and, as such, perform better at work, outstripping candidate A and the cycle begins again.
Balancing loops
The second kind of loop is known as a ‘balancing loop’. As the term suggests, these are loops that bring the system to a desired target state – and keep it there.
A thermostat is the perfect example of a balancing (or goal-seeking) feedback loop.
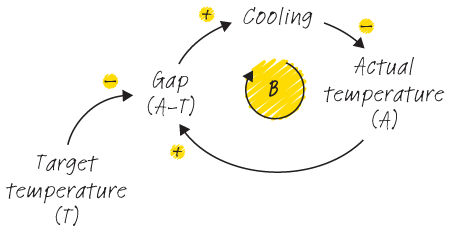
An air conditioning unit works by comparing the target with the actual temperature and cooling if a gap exists. Assume you start by setting the target temperature (T) to 72° F. The actual temperature (A) is 86° F, resulting in a gap A–T = 14° F. This will turn on the cooling mechanism, which in turn lowers the temperature and lessens the gap.
Let’s take a look at an example that combines both types of loops – reinforcing and balancing – in the realm of workplace safety.
PUTTING IT INTO PRACTICE: WORKPLACE SAFETY51
John never thought this could happen to him. He had been with his employer, a large industrial construction company, for over 20 years, and inspection walks have always been part of his routine as a health and safety supervisor. As he was busy inspecting a site for a new factory in New Jersey, he tripped over a loose steel pipe that lay on the ground. John lost his balance and fell into the construction pit.
Luckily for him, he came out of the incident with just a few scratches. But as this was the third incident that year, John’s accident alarmed the executive board who commissioned Marilyn, the head of on-site operations, to come up with a solution to systematically eradicate work-related injuries.
As a first step, Marilyn compiled statistics of work-related incidents across all the construction sites over the course of one year. Then she crunched the numbers in search for patterns. This allowed her to single out individual managers who were lax when it came to enforcing mandatory safety measures. But then she hit a wall: how should she go about finding the most important factors leading to workplace injuries and, more importantly, how could she eliminate them?
A friend pointed her to systems thinking, a methodology she was vaguely familiar with from her time at university. She was intrigued, as systems thinking promised to provide a more complete and effective way to understand and change the factors leading to accidents.
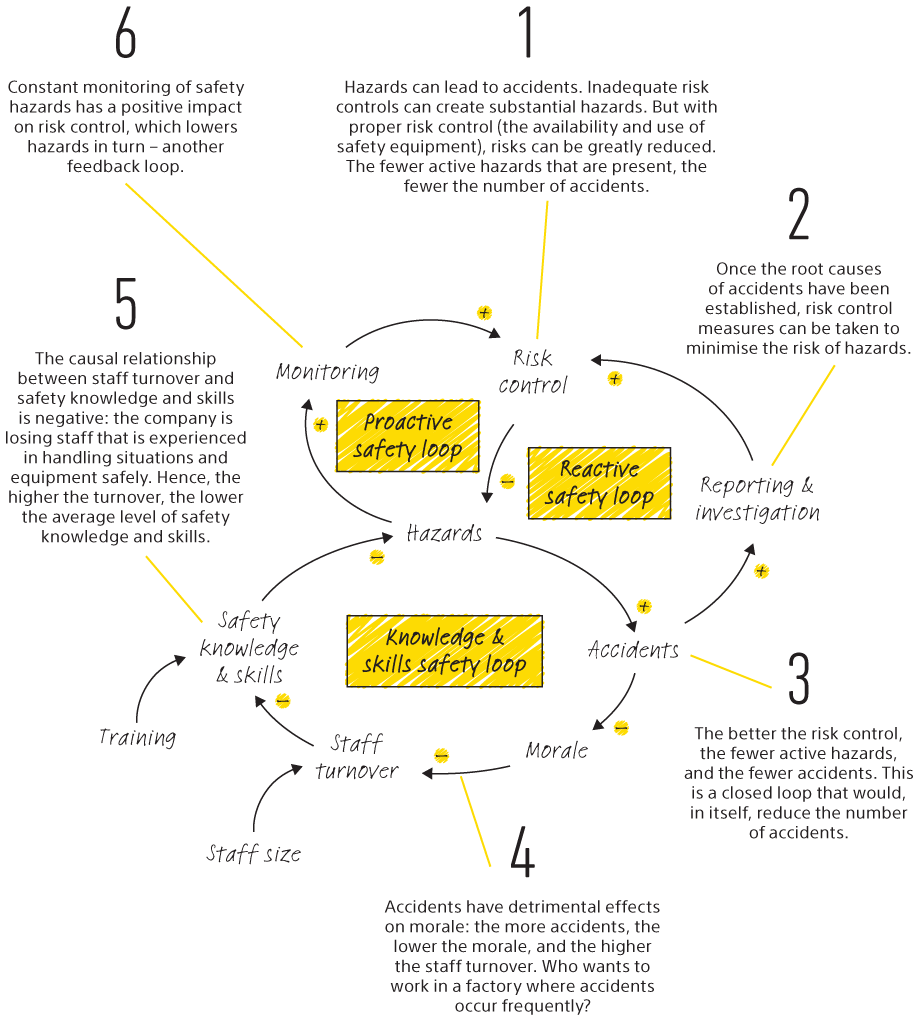
Marilyn went ahead and used a causal loop diagram (see image on the following page) to craft her strategy, analysing the many different factors affecting workplace safety levels and designing interventions to reduce the likelihood of accidents and injuries. Through interviews with site managers and the examination of work sites, she and her team discovered that, while managers were required to fill out reports after every accident, the reports lacked insights about what had led to that particular accident. Hence, the reports offered very few clues to determine ways to prevent each type of accident.
Marilyn knew that there had to be a better way to prevent accidents from happening. She examined the causal relationships and found three reinforcing feedback loops at work. Then, she actively looked for entry points that allowed her to intervene and shape the system.
Her analysis led her to propose incentives for employees that rewarded actively looking for, removing and reporting hazards encountered during their daily work. She also thought about penalties. Of course, cutting someone’s paycheque is an unpopular endeavour. So Marilyn did the opposite, and created a construction site safety fund that would be paid out to the workers as an end-of-year bonus. Every type of safety incident (from actual accidents, to safety hazards like leaving tools or material on the floor) was assigned a cost that would be subtracted from the fund. Hence, workers would not only have an incentive to comply themselves, but also to hold others accountable.
Marilyn also discovered that many employees didn’t take safety training all that seriously. She implemented a rigorous test for employees to take after their initial safety training, and involved senior management to communicate the new safety values.
Having employed the thinking systems mental tactic, Marilyn and her team managed to cut workplace-related accidents significantly.
FURTHER EXAMPLES
The VHS–Betamax war
In the videotape format war, video cassette recorders (VCRs) competed ferociously for market dominance in the late 1970s and the 1980s. The major contestants were two fundamentally incompatible systems: VHS and Betamax. Eventually, VHS won and became the market standard. One advantage for VHS was the low price of their recorders, making them popular, causing strong network effects. People recorded TV shows and swapped tapes among each other. The more players of one type in your community, the bigger your incentive to buy the same type of player or recorder. VHS managed to cash in most of the network effects. The chart below shows the illustrative sigmoid curve (also called ‘s-curve’) for the adoption of the two systems.

Personal productivity
Your productivity is measured by how much work you get done in an hour, a day or a week. It is simply output divided by input. Specific forces in the organisational system you’re working in can affect your productivity. Let’s say your boss wants you to deliver that project report by Wednesday, but you were under the impression that you had until Friday. In an effort to meet the strict deadline, you end up burning midnight oil over the next few days. Working overtime allows you to expedite your project and meet the deadline (a balancing loop), thus improving your productivity in terms of number of days required to complete the work (three days instead of five days). But it also leads to fatigue, which can cause you to make mistakes that require rework. That could mean putting in even more overtime hours (a reinforcing loop).

SOLVING PROBLEMS USING THE SYSTEMS APPROACH
Let’s use the following example to walk through a typical causal loop diagram. Take Sarita, an entrepreneur who developed a new exciting product, say, an electric skateboard. Sarita is trying to figure out how she can drive sales of her product.

THE BOTTOM LINE
Systems are groups of interdependent actors or items forming an integrated whole.52 The environment, social groups and companies are all examples of systems. When mapping out systems, one typically starts by identifying causal chains such as ‘A leads to B leads to C’. Whenever C has an effect (directly or indirectly) on A, we call them feedback loops. Feedback loops result in emergent behaviour such as exponential growth (reinforcing feedback loops) or convergence (balancing feedback loops). Depending on your aim, you typically try to create, change or stop causal loops. The systems thinking mental tactic lets you analyse loops and find the most effective points of intervention.