Chapter 10. Security
On many business intelligence (BI) projects, you will find yourself working with some of the most valuable and sensitive data that your organization possesses. It is no surprise, then, that implementing some form of security is almost always a top priority when working with Analysis Services. Of course, that means ensuring that only certain people have access to the model. However, it may also mean ensuring that certain people can see only some of the data and that different groups of users can see different slices of data. Fortunately, the tabular model has some comprehensive features for securing the data in your tables, as you will see in this chapter.
![]() What’s new in SSAS 2016
What’s new in SSAS 2016
The security roles in SSAS 2016 are not different from previous versions. Nevertheless, this chapter has been updated to include sections about testing roles using DAX Studio, visual totals and security in calculated columns and calculated tables, and security in DirectQuery.
User authentication
Analysis Services does not have a custom authentication service. It relies entirely on Windows authentication or on Azure Active Directory, which is available on Azure Analysis Services. In general, a user belonging to a Windows domain should have access to an SSAS instance within the same domain. If a user belongs to a different domain or is not connecting within the enterprise network (for example, the user is employing a VPN), then a workaround is possible—for example, connecting through HTTP/HTTPS access. Power BI also provides an alternative way to access SSAS databases on premises through the Data Gateway, mapping the Power BI user to the internal Windows users.
In this section, you will see some of the most common scenarios that require certain settings to establish a connection with Analysis Services. Alternatively, a connection within the corporate network is usually straightforward and does not require particular insights. A detailed description of the options for obtaining Windows authentication connecting to Analysis Services is also available at https://msdn.microsoft.com/en-us/library/dn141154.aspx.
Connecting to Analysis Services from outside a domain
Because Analysis Services relies on Windows authentication, enabling users from outside a domain to access Analysis Services can represent a challenge. Additionally, it can be a problem for users to connect to Analysis Services when a firewall blocks the ports on which it listens for client connections. The solution is to configure Analysis Services to use HTTP access through Internet Information Server (IIS), as shown in Figure 10-1.

In this scenario, a DLL called msmdpump.dll inside IIS acts as a bridge between the client machine and Analysis Services. When the client connects to IIS, IIS handles the authentication; msmdpump.dll then opens a connection to Analysis Services by using the end user’s credentials. You should use integrated Windows authentication with IIS whenever possible. If you cannot do so—for example, because users are accessing from outside a trusted Windows domain—use anonymous access or basic authentication with IIS. If you are using basic authentication, you should always use HTTPS connections. Otherwise, user credentials will be transmitted without encryption over the wire, making the system more vulnerable to unauthorized access.
Describing how to configure HTTP connectivity for Analysis Services is outside the scope of this book, but plenty of resources are available on the Internet that cover how to do this for Analysis Services Multidimensional, and the steps are the same for the tabular model. You can find a detailed description of how to configure HTTP access to Analysis Services on MSDN at http://msdn.microsoft.com/en-us/library/gg492140.aspx.
Kerberos and the double-hop problem
Figure 10-2 shows another common problem you might encounter when designing an Analysis Services solution: a scenario in which a client connects to a web-based reporting tool, and the web-based reporting tool must then connect to a separate Analysis Services server by using the end user’s credentials to run a query. This is called the double-hop problem.

By default, this situation is not possible with standard Windows authentication. But in cases in which it does occur, it can be solved in one of the following three ways:
![]() By setting up constrained delegation and Kerberos With this approach, you obtain the architecture shown in Figure 10-3. This is probably the best option, although setting up Kerberos is notoriously difficult, and many consultants and their customers would like to avoid it. A good starting point on enabling Kerberos for Analysis Services is the article from the Microsoft knowledge base at https://msdn.microsoft.com/en-us/library/dn194199.aspx.
By setting up constrained delegation and Kerberos With this approach, you obtain the architecture shown in Figure 10-3. This is probably the best option, although setting up Kerberos is notoriously difficult, and many consultants and their customers would like to avoid it. A good starting point on enabling Kerberos for Analysis Services is the article from the Microsoft knowledge base at https://msdn.microsoft.com/en-us/library/dn194199.aspx.

![]() By using dynamic security and the
By using dynamic security and the CUSTOMDATA function This requires you to configure your web application to open a connection. You do this by using the CustomData connection string property and passing an appropriate value through it. This is described later in this chapter in the section “Creating dynamic security.” This technique would not be possible in many cases, but the SQL Server Reporting Services expression-based connection strings can be used to do this. (See http://msdn.microsoft.com/en-us/library/ms156450.aspx for more details.)
![]() By using the
By using the EffectiveUserName connection string property To use the connection string property, the user connecting to Analysis Services must be an Analysis Services administrator. Therefore, this technique represents a significant security concern. Nevertheless, this is the approach Microsoft uses in the Data Gateway for Power BI, also providing a user interface to change the UPN property. Then, users in Azure Active Directory map to existing Windows users in the domain where Analysis Services is installed. For a detailed guide to the configuration of the Data Gateway for Analysis Services connections, see https://powerbi.microsoft.com/en-us/documentation/powerbi-gateway-enterprise-manage-ssas/.
Roles
Like the multidimensional model, the tabular model uses roles to manage security. A role is a grouping of users who all perform the same tasks and therefore share the same permissions. When you grant a role the permission to do something, you are granting that permission to all users who are members of that role.
Users are either Microsoft Windows domain user accounts or local user accounts from the machine on which Analysis Services is installed. All Analysis Services security relies on Windows integrated security, and there is no way to set up your own user accounts with passwords in the way that you can in the Microsoft SQL Server relational engine (by using SQL Server authentication). Instead of adding individual user accounts to a role, it is possible to add Windows user groups to a role—either domain user groups or local user groups, preferably the former. This is usually the best option. Note that only security groups work; distribution groups do not work. If you create a domain user group for each role, you need only to remove the user from the domain user group when an individual user’s permissions change rather than edit the Analysis Services role.
There are two types of roles in the tabular model:
![]() The server administrator role This controls administrative permissions at the server level. This role is built into Analysis Services and cannot be deleted. It can be managed only by using SQL Server Management Studio (SSMS).
The server administrator role This controls administrative permissions at the server level. This role is built into Analysis Services and cannot be deleted. It can be managed only by using SQL Server Management Studio (SSMS).
![]() Database roles These control both the administrative and data permissions at the database level. The database roles can be created and deleted by using SQL Server Data Tools (SSDT) and SSMS.
Database roles These control both the administrative and data permissions at the database level. The database roles can be created and deleted by using SQL Server Data Tools (SSDT) and SSMS.
Creating database roles
Database roles can grant permissions only at the database level. You can create and edit them in SSDT. Follow these steps:
1. Open the Model menu and select Roles. This opens the Role Manager dialog box, shown in Figure 10-4.

2. To create a new role, click the New button. This creates a new role with a default name in the list box at the top of the dialog box.
3. Rename the role, enter a description, and set its permissions, as shown in Figure 10-5.

4. To add Windows users and groups to this role, click the Members tab in the bottom half of the dialog box.
You can also create database roles in SSMS by doing the following:
1. In Object Explorer, connect to the Analysis Services instance.
2. Expand a database, right-click the Roles node, and select New Role. This opens the Create Role dialog box, shown in Figure 10-6. Here, you can do the same things you can do in SSDT. However, some of the names are slightly different, as you will see in the next section.

![]() Note
Note
A role name must not include the comma character, because it interferes with the Roles connection string property (described later in this chapter).
Membership of multiple roles
In some cases, users might be members of more than one role. In this case, the user has the permission of each individual role of which he or she is a member. If one role grants the user permission to do or see something, then he or she retains that permission, no matter what other roles he or she is a member of. For example, if a user is a member of multiple roles, one of which grants him or her administrative permissions on a database, that user is an administrator on that database even if other roles grant more restrictive permissions. In a similar way, if a user is a member of two roles, one granting permission to query only some of the data in a table and the other to query all the data in a table, the user will be able to query all the data in the table. There is no concept of “deny wins over grant,” as in the SQL Server relational engine. In fact, all security in Analysis Services is concerned with granting permissions, and there is no way of specifically denying permission to do or see something.
Administrative security
Administrative security permissions can be granted in two ways: through the server administrator role and through database roles.
Granting permission through the server administrator role
The server administrator role is very straightforward. Any user who is a member of this role has administrator privileges over the whole Analysis Services instance. This means server administrators can see all the data in the tables in every database, and create, delete, and process any objects.
By default, any members of the local administrator group on the server on which Analysis Services is running are also administrators of Analysis Services. The Analysis Services server property that controls this behavior is BuiltinAdminsAreServerAdmins. You can set it in SQL Server Management Studio in the Analysis Server Properties dialog box (see Figure 10-7) and in the msmdsrv.ini file. By default, it is set to True. If you set it to False, only users or groups you add to the role have administrator privileges on your Analysis Services instance. Likewise, the Windows account that the Analysis Services service is running as is also an Analysis Services administrator. You can turn this off by setting the ServiceAccountIsServerAdmin server property to False.

You must add at least one user to the server administrator role during installation, on the Analysis Services Configuration step of the installation wizard. After that, you can add users and groups in SSMS by right-clicking the instance name, selecting Properties, and, in the Analysis Server Properties dialog box, selecting the Security page, as shown in Figure 10-8. Then click Add and follow the prompts to add a new user or group.

In a development environment, developers are usually members of the server administrator role. In a production environment, however, only production database administrators (DBAs) should be members of this role.
Granting database roles and administrative permissions
At the database level, only a very limited set of administrative permissions can be granted. (These are also listed in the Permissions drop-down list in the SSDT Role Manager dialog box, shown in Figure 10-5.)
![]() None This is the default setting. Members of this role have no permissions on this database. Because a Windows user who is not a member of any role and is not an administrator has no permissions anyway, this option might seem unnecessary. However, it forces you to explicitly grant permissions to a role for it to be useful rather than blindly accepting any defaults.
None This is the default setting. Members of this role have no permissions on this database. Because a Windows user who is not a member of any role and is not an administrator has no permissions anyway, this option might seem unnecessary. However, it forces you to explicitly grant permissions to a role for it to be useful rather than blindly accepting any defaults.
![]() Read This setting grants members of the role permission to read data from the tables, which means that they can query the model. You can further control what data can be queried by applying row filters to tables, as discussed in the “Data security” section later in this chapter.
Read This setting grants members of the role permission to read data from the tables, which means that they can query the model. You can further control what data can be queried by applying row filters to tables, as discussed in the “Data security” section later in this chapter.
![]() Process This setting grants members of the role permission to process any object within the database, but not to query it. This permission would be appropriate for applications, such as SQL Server Integration Services (SSIS), that automate processing tasks. Note that a user with process permissions would not be able to process an object from SSMS because he or she would not have sufficient permissions to connect to Analysis Services in the Object Explorer pane.
Process This setting grants members of the role permission to process any object within the database, but not to query it. This permission would be appropriate for applications, such as SQL Server Integration Services (SSIS), that automate processing tasks. Note that a user with process permissions would not be able to process an object from SSMS because he or she would not have sufficient permissions to connect to Analysis Services in the Object Explorer pane.
![]() Read and process This setting grants members of the role permission to both query the model and process the objects.
Read and process This setting grants members of the role permission to both query the model and process the objects.
![]() Administrator This setting grants members of the role permission to query, process, create, alter, and delete any object. Developers and DBAs must be administrators of a database to do their jobs properly.
Administrator This setting grants members of the role permission to query, process, create, alter, and delete any object. Developers and DBAs must be administrators of a database to do their jobs properly.
A slightly different set of options is presented when creating a role in SSMS. As Figure 10-6 shows, three check boxes control the following administrative permissions:
![]() Full control (administrator) This is equivalent to the administrator permission in SSDT.
Full control (administrator) This is equivalent to the administrator permission in SSDT.
![]() Process database This is equivalent to the process permission in SSDT.
Process database This is equivalent to the process permission in SSDT.
![]() Read This is equivalent to the read permission in SSDT.
Read This is equivalent to the read permission in SSDT.
Selecting both the Process Database and the Read check boxes is equivalent to setting the Read and Process permission shown in SSDT. Checking any combination of boxes that includes Full Control (Administrator) is equivalent to the administrator permission.
Data security
It is an extremely common requirement on an Analysis Services project to make sure that some users can see only some of the data in a table. For example, in a multinational company, you might want to allow users at the head office to see the sales data for the entire company, but to enable staff at each of the local offices in each country to see the sales for just that country. You can achieve this by using DAX expressions in roles that act as filters on the tables. This is referred to as data security (as opposed to administrative security).
Basic data security
To set up data security on a role in SSDT, open the Role Manager dialog box and enter DAX filter expressions for one or more tables on the Row Filters tab, as shown in Figure 10-9. You can also set up data security in roles in SSMS after selecting the Read check box on the Row Filters page in the Create Role or Role Properties dialog box. The user interface is almost identical to the one described here for SSDT.

The DAX expression used to filter a table must return a Boolean value. For example, the following expression would result in the user being able to access only the data for the rows in the Product table where the Brand column is equal to the value Contoso:
= Product[Brand] = "Contoso"
It is important to understand that data security can be applied only to the rows of tables. It is not possible to secure entire tables, columns on a table, or perspectives. Thus, it is not possible to secure the individual measures in a model. A user can see all the measures in a model if he or she has read permissions on a database. (In contrast, in the multidimensional model, it is possible to secure individual measures—although security on calculated measures is problematic.) However, as you will see later, it is possible to apply a row filter that prevents the user from accessing any rows in a table. This gives a result similar to that of denying access to an entire table.
After row filters have been applied to a table, a user can see only subtotals and grand totals in his or her queries based on the rows he or she is allowed to see. Additionally, DAX calculations are based on the rows for which the user has permission, not all the rows in a table. This contrasts with the multidimensional model in which, when using dimension security, the Visual Totals property controls whether subtotals and grand totals are based on all the members of an attribute or just the members of the attribute that the user has permission to see.
![]() Note
Note
If you use MDX to query a tabular model, the VisualTotals() MDX function still works. The VisualTotals() function has nothing to do with the Visual Totals property controls for roles.
If you change the data security permissions of a role, those changes come into force immediately. There is no need to wait for a user to close and reopen a connection before they take effect.
Testing security roles
When writing row-filter expressions for data security, it is important that you test whether they work properly. However, as a developer, you have administrative rights over the database on which you are working, so you can see all the data in all the tables. Before any further discussion of data security, it is necessary to examine how to test the roles you develop.
Using Excel to test roles
The easiest way to test whether the row filters you have created work properly is to use Microsoft Excel. After you have created a role and clicked OK to close the Role Manager dialog box, open the Model menu and choose Analyze in Excel to browse your model as you normally would. Then, in the Analyze in Excel dialog box (shown in Figure 10-10), you can choose to test the security by browsing your model in one of two ways:
![]() As if you have logged in as a specific Windows user To do so, select either Current Windows User or Other Windows User. If you choose the latter, enter the desired user name in the corresponding text box.
As if you have logged in as a specific Windows user To do so, select either Current Windows User or Other Windows User. If you choose the latter, enter the desired user name in the corresponding text box.
![]() As if you were a member of one or more roles To do so, select the Role option and choose the desired role name(s) in the corresponding drop-down list.
As if you were a member of one or more roles To do so, select the Role option and choose the desired role name(s) in the corresponding drop-down list.

Click OK to open Excel with the permissions of that user or that role(s) applied. You can then browse the model as you normally would. To illustrate what querying a model through a role looks like, Figure 10-11 shows a Microsoft PivotTable with a query on a Contoso model run by a user with administrative permissions. Figure 10-12 shows the same PivotTable with the row filter on Contoso, applied to the Product table that was shown in the preceding section, “Basic data security.” Notice how the PivotTable shows data only for Contoso and how the Grand Total row, at the bottom of the PivotTable, is the same as the subtotal shown for Contoso in the previous example.


Testing roles by using connection string properties
When you choose a user or a role in the Analyze in Excel dialog box, SSDT opens Excel in the background and creates a connection to the workspace database with one of the following connection string properties set:
![]()
Roles This takes a comma-delimited list of role names as its input and forces the connection to behave as if the user connecting is a member of these roles—for example, Roles=RoleName1,RoleName2 and so on.
![]()
EffectiveUserName This takes a Windows domain user name and applies the security permissions that user would have—for example, EffectiveUserName=MyDomainMyUserName. (Note the local machine accounts are not supported.)
The Roles and EffectiveUserName connection string properties can be used only by Analysis Services administrators. You can apply both properties directly in Excel by editing the connection string properties of a connection in a workbook. To edit an existing connection, follow these steps:
1. Click the Connections button (on the Data tab in the ribbon) to open the Workbook Connections dialog box.
2. Select the connection you wish to edit.
3. Click the Properties button to open the Connection Properties dialog box.
4. Click the Definition tab and edit the connection string, as shown in Figure 10-13.

If you want to see how a DAX query is affected by security, you can also use these connection string properties in SQL Server Management Studio. To do so, enter the connection string properties in the Connect to Analysis Services dialog box, which appears when you open a new MDX query window. (Click the Options button in the bottom-right corner of the dialog box to display the advanced options, and then choose the Additional Connection Parameters tab, as shown in Figure 10-14.) The appropriate roles will be applied to the connection, which are used to run queries from the MDX pane. These connection string properties are not, however, applied to the connection that is used to populate the metadata pane to the left of the query window, so you will see all the MDX dimensions and hierarchies listed there.

Using DAX Studio to test roles
You can also test roles using DAX Studio, affecting both the metadata and the data that will be visible in the connection. To do so, expand the Advanced Options section in the Connect dialog box and enter the role’s name in the Roles text box, as shown in Figure 10-15. (If you have more than one role, use commas to separate them.)
![]() Note
Note
When you test roles or an effective user name in DAX Studio, the buttons in the Traces section are grayed out. You must log on as an administrator to activate these features.
You can specify other parameters in the Additional Options section that will be added to the connection string. For example, you might specify the CustomData property (discussed later in the section “Creating dynamic security”) by entering the following definition in the Additional Options text box:
CustomData = "Hello World"

Impersonating users to test roles
The third and final way to test a role is to log on to a machine or run an application using a specific user’s credentials to see how security behaves. Although logging off and logging on as someone else can be time-consuming, it is relatively easy to run an application as another user. All you have to do is press the Shift key while right-clicking the executable file or shortcut, select the Run as Different User option, and enter the user name and the password of the user whose security you wish to test.
Advanced row-filter expressions
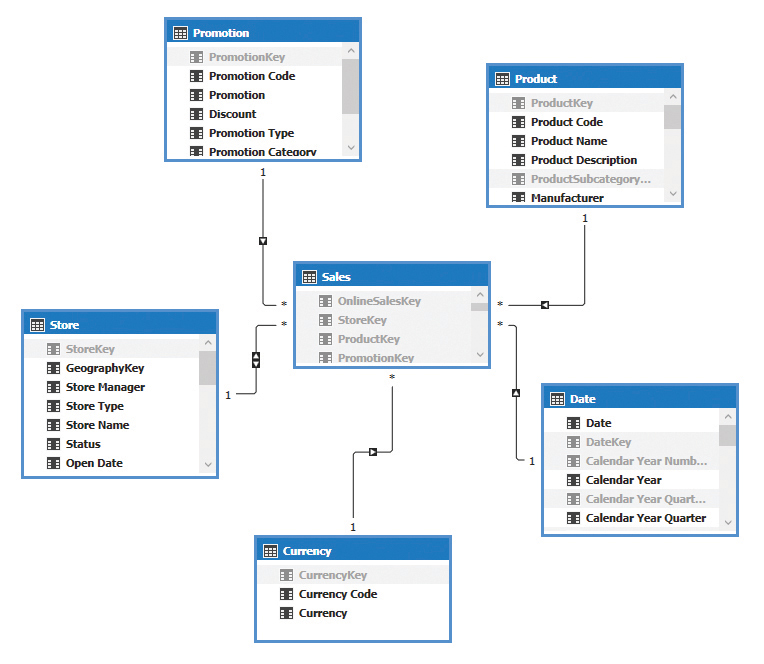
In many cases, some complex DAX is necessary to implement your security requirements. You can expand the limited amount of space in the Role Manager dialog box available for entering row-filter expressions by clicking the edge of the text box and dragging it outward. This section covers examples of row filters that address commonly encountered requirements. For all these examples, the Product, Sales, and Store tables in the Contoso database are used. The relationships among these tables are shown in Figure 10-16. Notice the bidirectional filter propagation defined between Store and Sales.
Filtering on multiple columns
When applying filters to multiple columns in a table, you usually use a mixture of And and Or logic. For example, if you want to filter the Product table to show only the products whose color is black and list price is greater than 3,000, you can use the following expression:
= Product[Color] = "Black" && Product[ListPrice] > 3000
If you want to change the logic so that you show the products whose color is black or list price is greater than 3,000, you can use the following expression:
= Product[Color] = "Black" || Product[ListPrice] > 3000
To get all the products whose color is anything other than black, you can use the following expression:
= [Color] <> "Black"
Finally, to deny access to every row in the product table, you can use the following expression:
= FALSE()
In this last example, although the table and all its columns remain visible in client tools, no data is returned.
Filtering and table relationships
Filters applied on one table can also have an indirect impact on other tables in the model. For example, you can use a filter such as the following one on the Product table:
= Product[Brand] = "Contoso"
This indirectly filters all the tables with which it has a one-to-many relationship—in this case, the Sales table. As a result, only the rows in Sales that are related to the product brand Contoso are returned in any query.
By default, filtering on a table does not result in a filter being applied to tables with which it has a many-to-one relationship. For example, after you filtered the Contoso brand in the Product table, the list of values visible in the CountryRegion column of the Store table always contains all the names available in the Store table, including the names for which there are no sales for the Contoso brand. This happens regardless of the filter propagation you have defined in the relationship between the Sales and Store tables (which in this case is bidirectional). In fact, the filter propagation affects only the DAX calculation, not the security, unless you enable a particular flag available in the relationship configuration.
Consider the list of values in CountryRegion that you see in the PivotTable in Excel. The list contains all the values of that column, regardless of whether there are visible rows in the Sales table for the active roles of the connected user. (In this case, the user belongs to the ReadContosoBrand role.) Because there is a measure in the PivotTable, you must change the Show Items with No Data on Rows setting (in the PivotTable Options dialog box) to show all the names, as shown in Figure 10-17.

Figure 10-18 shows the Apply the Filter Direction When Using Row Level Security check box in the Edit Relationship dialog box. You can select this check box after you enable the bidirectional filter of the relationship. By enabling this setting, the filter propagates from Sales to Store, so each user of the role (who can see only the Contoso branded products) will see only those stores where there is data available.

You cannot enable the Apply the Filter Direction When Using Row Level Security setting when the table on the many side of the relationship has a filter applied in any role. Similarly, if you apply this setting, you cannot later apply any filter to the table on the many side of the relationship. You would get an error, such as “Table ‘Sales’ is configured for row-level security, introducing constraints on how security filters are specified. The setting for Security Filter Behavior on relationship […] cannot be Both.”
After you apply the setting shown in Figure 10-18, the same PivotTable with the same options will show only the values in the CountryRegion column, for which there is at least one related row in the Sales table for the active security roles. This result is shown in Figure 10-19. Notice that the Show Items with No Data on Rows check box is now unchecked.

In some cases, you might need to filter specific combinations of keys in your fact table. For example, suppose you want to display only the sales values for black products in the year 2007 and for silver products in the year 2008. If you apply a filter on the Product attribute to return only the rows in which the Color value is Black or Silver and another filter on the Date column to return only rows in which the year is 2007 or 2008, then you see sales for all the combinations of those years and colors. To allow access to the sales values for only the black products from 2007 and the silver products from 2008—in other words, to disallow access to the sales values for the black products in 2008 or for the silver products in 2007, you can apply the filter to the Sales table itself instead of filtering by Product or Date at all. As noted, you cannot enable a filter on the Sales table if any of the relationships from this table to the other tables enable the bidirectional filter with row-level security. The following is the row-filter expression to use on Sales:
= ( RELATED ( 'Date'[Calendar Year Number] ) = 2007
&& RELATED ( 'Product'[Color] ) = "Black"
)
||
( RELATED ( 'Date'[Calendar Year Number] ) = 2008
&& RELATED ( 'Product'[Color] ) = "Silver"
)
Figure 10-20 shows a PivotTable containing data for the years 2007 and 2008 and the colors black and silver with no security applied. Figure 10-21 shows the same PivotTable when used with a role that applies the preceding filter to Sales.


![]() Note
Note
This last technique enables you to implement something like cell security in the multidimensional model. However, by using cell security, it is also possible to secure by using measures—and, as mentioned, this is not possible in the tabular model. That said, cell security in the multidimensional model often results in very poor query performance. It is usually best avoided, so the tabular model is not at a disadvantage to the multidimensional model because it does not have cell security.
Security in calculated columns and calculated tables
The values in calculated columns and calculated tables are evaluated at processing time. This is worth considering before you apply security as you decide where to apply row filters and where to create calculated columns and calculated tables. This behavior can be useful to create the non-visual totals in a tabular model.
For example, consider the requirement of a measure returning the percentage of the sales for a certain selection of products compared to the sales of all the products, including also those that are not visible to the user. A DAX measure used to compute such a percentage by default would use only the visible products in the ALL condition, as shown in the following formula:
Sales[% Sales] :=
DIVIDE ( [Sales Amount], CALCULATE ( [Sales Amount], ALL( 'Product' ) ) )
To retrieve the total of the sales while also considering the products hidden by security roles, you can create a DailySales calculated table (hidden to the user) that stores the total of sales day by day as follows. (In this example, we support browsing the model using only the Data and Product tables.)
DailySales =
ADDCOLUMNS (
ALLNOBLANKROW ( 'Date'[DateKey] ),
"Total Daily Sales", [Sales Amount]
)
You define a relationship between the DailySales table and the Date table and you create the following measure to compute the percentage against all the products, including those that are not visible to the user:
Sales[% All Sales] :=
DIVIDE ( [Sales Amount], SUM ( DailySales[Total Daily Sales] ) )
In Figure 10-22, you see the result of the two measures using the ReadContosoBrand role, defined previously in this chapter. The user can see only the products of the brand Contoso, so the first percentage represents the allocation of the sales by class in each year for the Contoso products (so the sum is always 100 percent at the year level). The second percentage represents the ratio between products visible to the user and the total of all the products, regardless of class and visibility. In this case, the value at the year level represents the ratio between the Contoso products and all the products in that year.

You must take care to avoid disclosing sensitive data because of calculated tables and calculated columns, considering that these tables are evaluated without using security roles. However, you can use this behavior to build the tables and columns supporting the calculation related to the non-visual totals.
![]() More info
More info
You can find a more complete implementation of non-visual totals leveraging calculated tables in this article: http://www.sqlbi.com/articles/implement-non-visual-totals-with-power-bi-security-roles/.
Using a permissions table
As your row filters become more complicated, you might find that it becomes more and more difficult to write and maintain the DAX expressions needed for them. Additionally, security permissions might become difficult for a developer to maintain because they change frequently and each change requires a deployment to production. This is a time-consuming task. You can use a data-driven approach instead, by which security permissions are stored in a new table in your model and your row-filter expression queries this table.
Recall the example at the end of the “Filtering and table relationships” section earlier in this chapter. Now suppose that, instead of hard-coding the combinations of 2007 and Black and 2008 and Silver in your DAX, you created a new table in your relational data source like the one shown in Figure 10-23 and imported it into your model with the PermissionsYearColor name.

A permissions table like this enables you to store the unique combinations of Calendar Year and Color, that you must secure, and the RoleName column enables you to store permissions for multiple roles in the same table. Inside your role definition, your row-filter expression on Sales can then use an expression like the following to check whether a row exists in the PermissionsYearColor table for the current role, the current CalendarYear column, or the current Color column:
= CONTAINS (
PermissionsYearColor,
PermissionsYearColor [RoleName], "MyRole",
PermissionsYearColor [CalendarYear], RELATED ( 'Date'[Calendar Year Number] ),
PermissionsYearColor [Color], RELATED ( 'Product'[Color] )
)
Adding new permissions or updating existing permissions for the role can then be done by adding, updating, or deleting rows in the PermissionsYearColor table, and then reprocessing that table. No alterations to the role itself are necessary.
As a final step, you should not only hide the Permissions table from end users by setting its Hidden property to True. You should also make sure the end users cannot query it by using the following row filter in the security role:
= FALSE()
Securing the Permissions table would not prevent the data in it from being queried when the role is evaluated. The row filter on the preceding Sales table is evaluated before the row filter on the Permissions table is applied.
Evaluating the impact of data security on performance
The existence of table filters in security roles can affect the performance of all the users belonging to that role. In general, you might experience performance issues with large tables, even when you apply the filters only to small tables.
The only rule of thumb is that you should measure performance of security roles before deploying the model in production. Do not wait for the user to experience poor performance accessing the data. When you connect to the model as an administrator, the security roles are not applied, so any performance issue related to table filters is not visible. Moreover, if you work in a development environment with a reduced set of data, you should test security roles using the full set of data because certain performance issues might arise with only a certain number of rows.
It is not easy to provide a more detailed list of best practices to avoid performance issues using security. This is because it depends on the specific data model and calculations of your solution and requires the ability to evaluate and optimize DAX query plans. However, you can find specific chapters that relate to this topic in our book The Definitive Guide to DAX, published by Microsoft Press. You can also find a more detailed explanation of the performance impact of data security in this article: https://www.sqlbi.com/articles/security-cost-in-analysis-services-tabular/.
Creating dynamic security
Dynamic security is a technique that enables a single role to apply different permissions for different users. It is useful when you would otherwise be forced to create and maintain numerous individual roles. For example, if you had a sales force of 1,000 people and you wanted to grant each salesperson access to only the sales in which he or she was involved, a non-dynamic approach would force you to create a thousand individual roles.
DAX functions for dynamic security
Two DAX functions can be used to implement dynamic security:
![]()
USERNAME This returns the Windows user name of the user who is currently connected.
![]()
CUSTOMDATA This returns the string value that has been passed to the CustomData connection string property.
The following query shows how these functions can be used:
CustomData = "Hello World"
Figure 10-24 shows the results of the query when the connection string property has been set. Refer to the section “Testing security roles” for details on how to do this in SSMS or DAX Studio. The functions are used as follows:
EVALUATE
ROW(
"Results from Username", USERNAME(),
"Results from CustomData", CUSTOMDATA()
)

The key point is that these functions are useful because they can return different values for different users. So, the same DAX expression that is used for a row filter in a role can return different rows for different users.
![]() Note
Note
In a multidimensional model, it is also possible to implement dynamic security by creating a custom MDX function (also known as an Analysis Services stored procedure) in a .NET dynamic link library (DLL) by uploading the DLL to Analysis Services and then calling the new function from inside the role definition. This approach is not possible in the tabular model because Tabular does not support the creation of custom DAX functions.
Implementing dynamic security by using CUSTOMDATA
The CUSTOMDATA function is used for dynamic security when a front-end application handles the authentication of users itself but you must push the job of applying data security back to Analysis Services. For instance, an Internet-facing reporting tool might not want to rely on Windows authentication. Instead it might have its own system for authenticating end users. It would then open a connection to Analysis Services (as a single Windows user) for each query that was run. Each time it opened a connection, it would pass a different value through the CUSTOMDATA connection string property to indicate the end user for whom the query was being run. Analysis Services would then use the value passed through the CUSTOMDATA property as part of a row-filter expression.
CUSTOMDATA is not suitable for dynamic security when end users connect to the tabular model directly. In those situations, an end user might be able to edit the connection string property in whatever client tool he or she is using and, therefore, see data he or she is not meant to see.
The use of CUSTOMDATA in a dynamic role can be demonstrated by creating a new role, called CustomDataRole, with read permissions, and by adding the following row-filter expression to the Product table:
=
IF (
CUSTOMDATA () = "",
FALSE (),
Product[Brand] = CUSTOMDATA ()
)
You can then connect to the model in SSMS by using the following connection string properties:
Roles=CustomDataRole; CustomData=Contoso
Alternatively, in DAX Studio, you can type CustomDataRole in the Roles text box and CustomData=Contoso in the Additional Options text box, as shown in Figure 10-25.

Then run the following DAX query:
EVALUATE ALL ( Product[Brand] )
You see that only one row is returned from the Brand column of the Product table—the row for the Contoso brand, as shown in Figure 10-26.

Implementing dynamic security by using USERNAME
The USERNAME function is used to implement dynamic security when end users connect to a tabular model directly, which means they will be opening connections to the model by using their own Windows identities. Because one user is likely to need access to many rows on the same table, and one row on a table is likely to be accessible by more than one user, a variation on the Permissions table approach (previously described) is usually necessary when this flavor of dynamic security is used. To illustrate this, use the UserPermissions values shown in Figure 10-27 as a starting point.

![]() Important
Important
Marcorusso is the domain name in this example. To make this work on your own machine, you must use the names of users that exist in your own domain.
Next, create a new role called UserNameDataRole, give it read permissions, and add the users MarcorussoMarco and MarcorussoAlberto to it. Use the following row-filter expression on the Product table:
= CONTAINS (
UserPermissions,
UserPermissions[User], USERNAME(),
UserPermissions[Brand], Product [Brand]
)
Then, in SQL Server Management Studio, open a new MDX query window with the following connection string properties set:
Roles=UserNameDataRole; EffectiveUserName=MarcorussoMarco
Run the following DAX query again:
EVALUATE ALL ( Product[Brand] )
You see that the three rows associated with the MarcorussoMarco user are returned from the Brand column of the Product table as shown in Figure 10-28.

If you have multiple tables you want to control with dynamic security, you might prefer an approach based on the propagation of the security filters through the relationships instead of using a DAX expression for every table you want to filter. This technique requires you to create more tables and relationships, but it simplifies the DAX code required. For example, consider how to implement the same dynamic security model for product brands with a model-based approach. Using the UserPermissions table you have seen before, you can create two other calculated tables, Brands and Users, using the following DAX expressions:
Brands =
DISTINCT ( 'Product'[Brand] )
Users =
DISTINCT ( UserPermissions[User] )
Then, you can hide the new tables and create the following relationships that are represented in Figure 10-29:
![]() Product[Brand] →R Brands[Brand]
Product[Brand] →R Brands[Brand]
![]() UserPermissions[Brand] →R Brands[Brand]
UserPermissions[Brand] →R Brands[Brand]
![]() Note
Note
This relationship is bidirectional and has the Apply the Filter Direction When Using Row Level Security setting enabled, as shown previously in Figure 10-18.
![]() UserPermissions[User] →R User[User]
UserPermissions[User] →R User[User]

At this point, create or replace the UserNameDataRole by specifying only this filter in the Users table and by removing any other filter from other tables. Use the following formula:
= Users[User] = USERNAME()
You can repeat the same test performed in the text that precedes Figure 10-28, obtaining the same result. The advantage of this approach is that you must implement other permissions for other tables. You will apply the security filter to only one hidden Users table in the data model. You can find further information about this technique in the whitepaper available at https://blogs.msdn.microsoft.com/analysisservices/2016/06/24/bidirectional-cross-filtering-whitepaper/.
Security in DirectQuery
When you have a tabular model in DirectQuery mode, you can define the security in two ways:
![]() By using the security roles defined in Analysis Services, just as you do in other models using in-memory mode
By using the security roles defined in Analysis Services, just as you do in other models using in-memory mode
![]() By applying the security on the relational data source by instructing Analysis Services to impersonate the current user when it sends the necessary SQL queries to the data source
By applying the security on the relational data source by instructing Analysis Services to impersonate the current user when it sends the necessary SQL queries to the data source
Usually, you choose either one technique or the other, but there is nothing that stops you from combining both together, even if it is usually unnecessary to do so.
If you want to rely on the standard role-based security provided by Analysis Services, be aware that all the SQL queries will include the necessary predicates and will only join to retrieve the required data. When you use DirectQuery, there are restrictions to the DAX expressions you can use in the filters of the role. These are the same restrictions applied to the calculated columns in DirectQuery mode. For more details about these limitations, refer to Chapter 9, “Using DirectQuery.”
If you have already implemented row-level security in the relational database and are supporting Windows integrated security, you must configure Analysis Services to impersonate the current user to use it, as described in the next section.
Security and impersonation with DirectQuery
A tabular model in DirectQuery mode can connect to SQL Server in two ways:
![]() By always using the same user (defined in the connection)
By always using the same user (defined in the connection)
![]() By impersonating the user that is querying Analysis Services
By impersonating the user that is querying Analysis Services
The latter option requires Analysis Services to be configured for the Kerberos constrained delegation, as explained at https://msdn.microsoft.com/en-us/library/dn194199.aspx. This section focuses on configuring the desired behavior on Analysis Services.
When you use DirectQuery, the tabular model has only a single connection, which has a particular configuration for impersonation. (This is the impersonationMode property in the JSON file, but it is called Impersonation Info in SSMS and simply Impersonation in SSDT). This security setting specifies which user must be impersonated by Analysis Services when connecting to the data source. Such impersonation determines which Windows user will execute the code in Analysis Services connecting to the data source. If the source database supports the Windows integrated security, this user will be flagged as the user consuming the data on the relational data source. If the source database does not support the Windows integrated security, then this setting is usually not relevant for DirectQuery.
Suppose the source database was a SQL Server database using integrated security. In this case, if Analysis Services were to impersonate the current user, SQL Server could receive queries from different users and could provide different results to the same requests depending on the user itself. If you have SQL Server 2016, this feature is available with the row-level security on the relational database, as described at https://msdn.microsoft.com/en-us/library/dn765131.aspx.
If your relational database can produce different results depending on the Windows user connected, then you might be interested in impersonating the current Analysis Services user in DirectQuery mode instead of using a fixed user. (Using a fixed user connecting to the data source is common when you create a tabular model that imports data in memory.) For example, you can edit the properties of the connection in SSMS in the Connection Properties dialog box, as shown in Figure 10-30. (To open this dialog box, right-click the connection of the database in the Object Explorer pane and choose Properties.)

Figure 10-30 The Impersonation Info in the Security Settings section of the Connection Properties dialog box in SSMS.
By clicking the button marked with an ellipsis (…) to the right of the Impersonation Info entry in the Security Settings section, open the Impersonation Information dialog box shown in Figure 10-31. There, you can choose the Use the Credentials of the Current User option instead of the fixed user that is available in the other two options (the service account or another specific one).

Click OK twice to close the two dialog boxes. Your Analysis Services instance will start to use a different user for every connection made to Analysis Services, impersonating the user connected to Analysis Services for each query. You can verify this behavior by checking the NTUserName column in SQL Profiler when monitoring the SQL queries received by SQL Server. You can also set impersonation options using the same Impersonation Information dialog box in SSDT, when you define the connection to the data source.
Row-level security on SQL Server earlier than 2016
If you are using a version of SQL Server earlier than SQL Server 2016, you can use an alternative technique to implement row-level security. This technique is based on permissions assigned to schemas and involves creating the same views on different schemas that are used as default by different users. You can implement it with the following steps:
1. Assume you have the original table of the model created in the dbo schema. (If you do not, replace the dbo with the schema name in the following steps.) The user used in the data source connection in Analysis Services must use the dbo schema as a default schema.
2. Define a schema on SQL Server for every group of users.
3. Define a user on SQL Server for every user you will also enable on Analysis Services to access the tabular model that is published in DirectQuery mode.
4. Assign to each user you create in SQL Server the corresponding schema (of the group to which he or she belongs) as a default schema.
5. Grant SELECT permission on each schema to all the users belonging to the same group (that is, users who see the same rows of data).
6. For every table in the dbo schema that you reference in the tabular model, create a SQL view with the same name in each schema. This view must include a WHERE condition that filters only the rows that should be visible to that group of users.
7. In the tabular model, assign to every DirectQuery partition a SQL statement instead of a direct table binding and remove any reference to schema in the SQL query you use.
After you complete these steps, when the user queries the Analysis Services model, his or her credentials will be used by Analysis Services to connect to SQL Server. That user has a default schema that uses views with the same name as the original tables. Alternatively, they use views with an additional WHERE condition that filters only the rows he or she can see. Therefore, the SQL query generated by Analysis Services will use these views and return only the rows that the user can see. You can find another implementation of row-level security that is based on a more dynamic (data-based) approach at http://sqlserverlst.codeplex.com.
Monitoring security
One final subject that must be addressed regarding security is monitoring. When you are trying to debug a security implementation, it is useful to see all the connections open on a server and find out which permissions they have. This is possible by running a trace in SQL Server Profiler and looking for the events shown in Figure 10-32.

The following events can be selected in the Events Selection tab:
![]() Audit Login/Logout These events are fired every time a user logs on and logs out of Analysis Services.
Audit Login/Logout These events are fired every time a user logs on and logs out of Analysis Services.
![]() Existing Session This event lists all the sessions that are currently active when the trace starts.
Existing Session This event lists all the sessions that are currently active when the trace starts.
![]() Session Initialize These events are fired every time a new session is created, which usually happens every time a user connects to Analysis Services.
Session Initialize These events are fired every time a new session is created, which usually happens every time a user connects to Analysis Services.
The last two of these events contain a lot of useful information, such as the user who is connecting to the model, the database to which he or she is connecting, all the properties from the connection string, and, crucially, the security roles applied to this session. It also shows the application from which the user is connecting, if the Application Name connection string property has been set. Some Microsoft client tools do this, and you might want to set it in your own applications to make debugging easier. When an administrator opens a session, you see a comma-delimited list of all the roles in the Analysis Services database, plus an asterisk at the beginning to show administrator rights in the TextData pane in Profiler, as shown in Figure 10-33. When a user who is not an administrator connects, you will see a list of the roles of which that user is a member instead.

The name of the user who is connecting is always shown in the NTUserName column. When the EffectiveUserName property is used, the value that was passed to that property is shown in the TextData pane, along with the other connection string properties used, as shown in Figure 10-34.

Summary
In this chapter, you saw how to implement security in the tabular model. Administrative security can be configured at the instance level, through the server administrator role and at the database level. This configuration is done by creating database roles with the administrator permission. Data security can also be implemented through database roles by applying DAX row filters to tables to filter the data in each table where the role allows access. Dynamic security can be used to make a single role apply different filters for different users. DirectQuery might take advantage of impersonating the current user to leverage data security filters already implemented in the relational database. Finally, this chapter describes more advanced security configurations, such as HTTP authentication and Kerberos, and how SQL Server Profiler can be used to monitor which roles are applied when a user connects to Analysis Services.